 [2]
[2] Worldwide declining death rates are rapidly bringing nonfatal diseases and injuries to the forefront of health concerns. As people live longer, more years are spent with disabling and life restricting diseases, including musculoskeletal diseases. Globally, life expectancy at birth in 2015 was 68.6 years,1 and 79.8 years in the US.2 By 2050, life expectancy worldwide is expected to rise to 76.2 years,1 and may be as long as 85.9 years and 93.3 years for males and females, respectively, in the US based on current improvements in health care.3 The most recent Global Burden of Disease Study4 has noted that “as countries around the world have made great progress in addressing fatal diseases, nonfatal diseases pose the next major threat in terms of disease burden.” Leading causes of years lived with disability (YLD) for both men and women include major musculoskeletal conditions.
Musculoskeletal conditions are among the most debilitating nonfatal health diseases. Persons affected with back pain and arthritis have high rates of chronic pain and disability, reducing the quality of life and limiting ability to participate in many common activities. More than one-half of the US population experience these conditions.
The Burden of Musculoskeletal Conditions in the United States, successor to Musculoskeletal Conditions in the United States published by the American Academy of Orthopaedic Surgeons (1992 and 1999), was first produced in print in 2008 as part of the United States Bone and Joint Decade, 2002-2011. The national recognition of musculoskeletal conditions as one of the most disabling and costly conditions experienced by Americans was proclaimed in March 2002 by then President George W. Bush.5,6 At the end of the decade, the multiple associations of health providers treating musculoskeletal diseases realized the work had only begun, and the United States Bone and Joint Initiative (USBJI), a part of the Global Alliance for Musculoskeletal Health, was created. The Burden of Musculoskeletal Conditions in the United States was updated in 2011, again in print. In 2014, the first electronic edition was completed. Future years will see individual chapter updates rotating in 2 to 3 year cycles.
The goal of USBJI is to improve the quality of life for people with musculoskeletal conditions and to advance understanding and treatment of these conditions through research, prevention, and education. The cornerstone of USBJI is describing the burden of musculoskeletal disease, defined as the incidence and prevalence of musculoskeletal conditions; the resources used to prevent, care, and cure them; and the impact on individuals, families, and society. Direct costs of the burden of musculoskeletal disease include hospital inpatient, hospital emergency and outpatient services, physician outpatient services, other practitioner services, home health care, prescription drugs, nursing home cost, prepayment, and administration and non–health-sector costs. Indirect cost relates to morbidity and mortality, including the value of productivity losses due to disability or premature death due to a disease, the value of lifetime earnings due to disability or early death, and the impact of the conditions on quality of life.
With the aging of the US population, musculoskeletal impairments and disability will become an increasing large burden as they are most prevalent in the older segments of the population. Using US Census Bureau projections, by the year 2060, the number of individuals in the United States older than the age of 65 years is projected to grow from the current 15% (47.8 million) of the population to 24% (98.2 million). Persons age 80 years and older will double from the current <4% to more than 8%.7 Looking at projections from the MacArthur Foundation Research Network utilizing improved healthcare treatments, by 2050, the population age 65 and older would be between 99.3 and 107.7 million, while the population age 85 and older would number 27.0 to 34.7 million.3
Regardless of the projection method, the share of the population age 65 and over, those most likely to suffer from musculoskeletal diseases, is projected to increase rapidly in the next few decades. Health care services worldwide will be facing severe financial pressures in coming decades unless new treatments or means of prevention are found to address the escalating number of people affected by musculoskeletal diseases.
 [4]
[4]
 [6]
[6] The following pages on this website, provide data to support research, education programs, and healthcare policy research that will bring about significant advances in the knowledge, diagnosis, and treatment of musculoskeletal conditions, with the goal of improving treatment to reduce pain and disabilities brought on by chronic musculoskeletal diseases.
As noted previously, great progress in addressing fatal diseases is being made worldwide and nonfatal diseases pose the next major threat in terms of disease burden. Musculoskeletal conditions – in particular, trauma, back pain, and arthritis – constitute a major share of this morbidity burden, often restricting activities of daily living, causing lost work days, and are a source of lifelong pain. In spite of this, research funding to ease this burden remains well below that of other disease conditions.
In 1998, the Institute of Medicine wrote “In setting national priorities, NIH (National Institutes of Health) should strengthen its analysis in the use of health data, such as burdens of disease, and of data on the impact of research and the health of the public.”1 The Global Burden of Disease has identified low back pain, neck pain, and other musculoskeletal conditions as three of the top ten leading causes for years lived with disability.2 By current US estimates, more than 78% of the persons age 18 years and older reporting a disabling condition reported a musculoskeletal disorder. (Reference Table 1.5.1 PDF [11] CSV [12]) Yet, research funding to alleviate these major health conditions remains substantially below that of other major health conditions such as cancer, respiratory, and circulatory (eg, heart) diseases. (Reference Table 1.1.2 PDF [13] CSV [14])
The National Institute of Arthritis and Musculoskeletal and Skin Diseases (NIAMS) was formed in 1987. Across the years, research funding for NIAMS has declined in relative terms, and since 2000, less than 2% of the annual National Institutes of Health (NIH) budget has been appropriated to musculoskeletal disease research. In fact, the funding share for 2016 was the lowest it has ever been, at 1.68% of the total NIH budget.
 [16]
[16] Over the last five years (2012 to 2016), funding for musculoskeletal conditions from NIH totaled $7.9 billion, while that of cancers and heart/circulatory disorders totaled $42.1 billion and $23.1 billion, respectively. (Reference Table 1.1.1 PDF [17] CSV [18], and Table 1.1.2 PDF [13] CSV [14])
 for National Institutes of Health Research by Disease Areas, United States 2012-2016 - Click on image to enlarge") [20]
[20] In spite of the major healthcare burden presented by musculoskeletal conditions, research funding falls well below that of most other conditions. Injury research commands half of the musculoskeletal condition research dollars ($4 billion) from NIH for the years 2012 to 2016. Funding for arthritis research is second, at $1.4 billion, followed by osteoporosis ($965 million). These numbers are well below the $8.3 to $55.9 billion in funding for the top 25 NIH research conditions, diseases, and areas. (Reference Table 1.1.3 PDF [21] CSV [22])
 [24]
[24] Looking at it another way shows the dominance of fatal diseases versus prevalence in the population. Three diseases with very high prevalence in the population – obesity, hypertension, and arthritis – are among the lowest research-funded diseases in the US. Arthritis, a major musculoskeletal disease, is responsible for an extra burden of pain and disability in nearly 1 in 4 persons. (Reference Table 1.3.1 PDF [25] CVS [26])
 [28]
[28] Since 1999, NIAMS has received an average of 2.8% of research project grant funds, and 2.3% of project grant dollars. Career development awards during this period have risen from 3.1% in 1999 to 4.2% in 2015, as a share of total career awards. (Reference Table 1.1.4 PDF [29] CSV [30])
Time and again, when the global burdens of disease are enumerated, musculoskeletal conditions rank high. Now we see that that rank is increasing. Although research funding reflects a long-term bias towards diseases with high mortality rates, the Global Burden of Disease project indicates that much of the growth in disease burdens has occurred for conditions that cause high disability rates. Redressing the funding disparity should become a high priority.
Although musculoskeletal conditions are common, disabling, and costly, they remain under-recognized, under-appreciated, and under-resourced. This book provides a strong case for the immediate and ongoing need to understand and support musculoskeletal conditions and reduce the burden they bring to people.
In the National Health Interview Survey (NHIS) in 2015, an annual survey of self-reported health conditions used throughout this chapter to highlight chronic health conditions of the US population, musculoskeletal medical conditions were reported by 124.1 million adults in the United States, representing one in two persons age 18 and over of the estimated 2015 population. The rate of chronic musculoskeletal conditions found in the adult population is greater than that of chronic circulatory conditions, which include coronary and heart conditions, and twice that of all chronic respiratory conditions, the next two most common health conditions. While the rate of circulatory conditions is approaching the rate of musculoskeletal conditions, the majority of circulatory conditions involve high blood pressure and high cholesterol, both of which are controlled medically and do not necessarily lead to the high levels of disability and pain found in arthritis and back pain. (Reference Tables 1.2.1 PDF [32] CSV [33] and 1.3.1 PDF [25] CSV [26])
Females report higher levels of most major non-fatal health conditions than do males. The rate of musculoskeletal conditions in females was 52.7, while males reported musculoskeletal conditions at a rate of 47.3 per 100 persons. (Reference Tables 1.2.1 PDF [32] CSV [33])
 [35]
[35] Age is a factor in many major health conditions, particularly those affecting the ability to function in daily living activities. The lower prevalence of some conditions in older age groups may be due to mortality caused by the condition in earlier age groups. By age 65, circulatory problems surpass musculoskeletal conditions slightly as hypertension, high cholesterol, and heart conditions all become more common in persons who have reached the age of 75. Respiratory conditions often have lower prevalence among older individuals, while cancer, hearing problems, and dental issues all increase after age 75. The prevalence of musculoskeletal conditions rises in the middle ages of 45 to 64, and tends to level off around age 65, creating a long period of time over which the pain and disability associated with musculoskeletal diseases impacts quality of life. (Reference Table 1.2.2 PDF [36] CSV [37])
 [39]
[39] Non-Hispanic Whites have the highest prevalence of several major health disease conditions, including musculoskeletal conditions. A major exception to this rule is diabetes, a common condition; prevalence rates of diabetes are highest among non-Hispanic blacks. (Reference Table 1.2.3 PDF [40] CSV [41])
 [43]
[43] In general, residents of the Midwest region report slightly higher rates of most major health conditions while residents in the West report the lowest prevalence. Musculoskeletal conditions are reported by 54.9% of Midwest residents, and a consistent 48.8% across all other regions. The reasons why this occurs are not known, but the median age of the population is older than the West and South; however, median age is oldest in the Northeast.1 There is also a higher prevalence of musculoskeletal conditions reported in several industries than generally found in other geographical regions. These include construction/extraction, office and administrative support, healthcare practitioners and technicians, and building and grounds cleaning/maintenance industries. (Reference Table 1.2.4 PDF [44] CSV [45])
 [47]
[47] Over the past decade, the reported prevalence of the most common health diseases has not changed. Reported prevalence in 2012 for several conditions was greater than in 2015, but additional years of data will be needed to determine if this is an actual slowing of these conditions. Circulatory related conditions increased significantly between 20112 and 2015, but this was primarily related to the increase in chronic hypertension, and the addition of chronic high cholesterol to the category. Musculoskeletal diseases continue to lead all medical conditions in prevalence. (Reference Table 1.2.5 PDF [48] CSV [49])
Three of the five most common medical conditions reported in 2012 were musculoskeletal conditions: low back pain, chronic joint pain, and arthritis. The other most commonly reported medical conditions are chronic hypertension and chronic high cholesterol. One in three to four persons over the age of 18 report having these conditions. Back and joint pain, along with arthritis, cause a much higher level of disability and affect quality of life at higher rates than do hypertension and high cholesterol. Major respiratory conditions are reported at much lower rates than circulatory and musculoskeletal conditions. (Reference Table 1.3.1 PDF [25] CSV [26])
 [52]
[52] Females report slightly higher levels of musculoskeletal conditions than do males, but males have higher rates of hypertension and high cholesterol. Age is a factor in increasing prevalence of all major conditions related to musculoskeletal and circulatory diseases, but the rates of hypertension and high cholesterol are much lower in young adults (18 to 44 years) and higher in older age groups (65 and over) than for musculoskeletal conditions. (Reference Table 1.3.1 PDF [25] CSV [26]; Table 1.3.2 PDF [53] CSV [54]; Table 1.3.3 PDF [55] CSV [56]; and Table 1.3.4 PDF [57] CSV [58])
Over the last decade, little progress has been made in reducing the prevalence of the most common respiratory, circulatory, and musculoskeletal diseases. In fact, musculoskeletal conditions and chronic hypertension, already affecting a majority of the population, have all seen a slight growth in prevalence. As mentioned earlier, there has been major progress in reducing prevalence of several fatal conditions worldwide. The time has come to focus research on non-fatal diseases, such as musculoskeletal diseases, that can cause many years of pain and disability and have been growing in prevalence. (Reference Table 1.3.5 PDF [59] CSV [60])
As previously noted, musculoskeletal conditions are one of the most debilitating nonfatal health diseases, leading to chronic pain and disability and reduced quality of life. The most common musculoskeletal conditions leading to disability are back and neck pain and arthritis and chronic joint pain.
Back pain affects most people at some point in their lives. For the lucky, this pain has a known cause and is temporary, healing with time and rest. But for many, back pain is a constant in their life. Chronic back pain is considered to be back pain lasting three months or longer. While spinal changes that are the source of back pain may be known and understood, there remains a gap in understanding why some people are affected and others are not, and what can be done to prevent or repair damage done.
In 2015, 72.3 million people age 18 and older reported they experienced chronic back pain in the previous year. This is nearly one in three adults. Of this group, more than one-third (37%) had back pain severe enough that it created radiating leg pain. Two in four (39%) also reported chronic neck pain, but 61% of the 38.9 million with neck pain had chronic neck pain alone.
Females report low back and neck pain at slightly higher rates than males, with females accounting for 54% of low back pain cases, with a rate of 30.8 per 100 persons compared to 27.4 for males. There is an even greater discrepancy in reported neck pain, with females reporting a 33% higher rate per 100 persons than males. (Reference Table 1.3.1 PDF [25] CSV [26])
Low back and neck pain are common among all ages of adults, with reported prevalence leveling as people reach middle age (45 and older). There is an actual slight dip in back pain prevalence in the oldest population, age 75 and older, but back pain remains a significant source of pain and disability throughout people’s lives. (Reference Table 1.3.2 PDF [53] CSV [54])
Low back and neck pain is reported at slightly higher rates among non-Hispanic whites than found in other racial/ethnic populations. Persons of other/mixed non-Hispanic racial/ethnic groups report the lowest rates. (Reference Table 1.3.3 PDF [55] CSV [56])
Back pain is reported in similar numbers in all geographic regions, with some minor differences seen. Low back pain is reported at the highest rate (30.3/100) in the Midwest, while low back pain with radiating leg pain is slightly higher in the South (11.3/100). Neck pain is reported highest in the West (17.9/100).
 [62]
[62] About one in two persons reporting a doctor has “ever” told them they have arthritis report either chronic joint pain or low back/neck pain. It is unknown why some people with arthritis are more likely to report pain than others. More than 55.4 million report they have some type of arthritis, an overall prevalence rate of nearly one in four adults (22.4/100). Females report higher rates than males, accounting for 58% of those reporting they have arthritis. This represents a one-in-four prevalence ratio (25.4/100) compared to one-in-five (19.1/100) males. (Reference Table 1.3.1 PDF [25] CSV [26])
Age is clearly a factor in arthritis, with very low rates found in younger adults. By middle age (45-64) the prevalence rate has more than quadrupled (6.8 to 28.6/100). By the age of 65, the reported prevalence rate has again nearly doubled, to 48.1/100 adults. There is a slight increase again in the oldest population, age 75 and older. (Reference Table 1.3.2 PDF [53] CSV [54])
Persons of non-Hispanic white race/ethnic background report arthritis at a prevalence rate more than twice that of those of Hispanic ethnicity and non-Hispanic other/mixed race/ethnicity. Non-Hispanic blacks report a rate slightly lower than non-Hispanic whites, but still nearly double that of Hispanics and non-Hispanic other/mixed race ethnicity. Understanding why these racial/ethnic differences occur could aid in understanding why some persons get arthritis while others do not, as well as why some persons with arthritis report more pain than others. (Reference Table 1.3.3 PDF [55] CSV [56])
Residents of the Midwest, with a population median age of 38.0 years, report slightly higher rates of arthritis than persons residing in other geographic regions, with residents of the West region, which has the youngest median age (35.9), reporting the lowest rate.1 (Reference Table 1.3.4 PDF [57] CSV [58])
 [64]
[64] Arthritis is associated with both chronic joint and back pain. Roughly one-half of persons reporting chronic joint pain (54%), low back pain (53%), and radiating leg pain (52%) also report they have arthritis. About one-third (32%) reporting neck pain report they have arthritis.
In recent years, chronic joint pain, defined as joint pain lasting three months or longer, has reached the prevalence level of low back pain as a common musculoskeletal condition. Chronic joint pain, was reported by 72.5 million adults age 18 and older, for a rate of 29.3 in 100 persons. Chronic joint pain and arthritis are not mutually exclusive and may be reported by the same individual. Although age is a general predictor of chronic joint pain and arthritis, with nearly one in two persons age 65 years and older reporting one or both of these conditions, the rate of reported chronic joint pain in younger persons is also of concern. In 2015, one in six persons ages 18 to 44 reported experiencing chronic joint pain in the past year, while more than one-third (37%) age 45 to 64 reported chronic joint pain. Long active lifestyles will continue to be a major cause of joint pain in the coming years. (Reference Table 1.4.1 PDF [65] CSV [66] and Table 1.4.2 PDF [67] CSV [68])
As with other musculoskeletal diseases, chronic joint pain is reported by a slightly higher rate of females than males, as well as among non-Hispanic whites, with one in three reporting chronic joint pain. Other racial/ethnic groups report a prevalence between 20 and 26 in 100 persons with chronic joint pain. Also, the Midwest geographic region reports a higher prevalence than other regions in the US. (Reference Table 1.4.3 PDF [69] CSV [70] and Table 1.4.4 PDF [71] CSV [72])
 [74]
[74] Chronic knee pain is reported by all ages older than 18 years, with nearly one in three persons age 65 and older reporting chronic knee pain, and one in four (23.9/100) among those 45 to 64 years old. Because only 1 in 10 persons age 18 to 44 reports knee pain, the overall prevalence is 19 in 100. Females report a slightly higher rate of knee pain than males do.
Shoulder pain, reported by 22.3 million of those age 18 and older in 2015, is the second most common joint site for chronic pain, with rates fairly equal for those age 45 and older. Shoulder pain is reported in fairly equal rates by males and females, with males having a slightly higher rate.
Hip pain was reported by 18.2 million people age 18 and older in 2105. Hip pain is much more common in females than in males. As with other sites of chronic joint pain, hip pain prevalence increases with age.
 [76]
[76]  [78]
[78] While multiple joints can be the source of chronic joint pain, overall, nearly one in three (29.3/100) people over the age of 18 reported chronic joint pain in 2015. The ratio jumps to nearly one in two (47/100) after the age of 65 years. However, even among younger adults age 18 to 44, about one in six (16.3/100) report chronic joint pain. (Reference Table 1.4.1 PDF [65] CSV [66] and Table 1.4.2 PDF [67] CSV [68])
Over the past eight years, a slight increase in the prevalence rate of reported chronic joint pain has been seen. This is primarily associated with knee pain, but other joints have also seen small increases.
Participants in the NHIS survey are asked about limitations they experience in activities of daily living (ADL) because of medical conditions. In 2015, more than 82 million adults, or 36% of the population age 18 years and older, reported they have difficulty performing routine ADL without assistance because of medical conditions. An additional 6.3 million children between the ages of 1 and 17 years are reported by their parents as needing more assistance in daily activities because of a medical condition than would be expected based on their age. While more than one medical condition could be reported, and often was, 64 million adults with ADL limitations had a musculoskeletal condition, approximately one-half the persons reporting a musculoskeletal condition. This is a much higher ratio than found in any of the other major disease categories.
 [80]
[80] The prevalence rate in the population reporting limitations in ADL increases with age, and affects one in four persons older than 75 years of age, primarily due to musculoskeletal conditions. Again, females, non-Hispanic whites, and residents of the Midwest are slightly more likely to report limitations due to health conditions than other demographic groups (Reference Tables 1.5.1 PDF [11] CSV [12]; 1.5.2 PDF [81] CSV; [82] 1.5.3 PDF [83] CSV [84]; and 1.5.4 PDF [85] CSV [86])
 for Persons Due to Select Medical Conditions by Age, United States 2015 - Click on image to enlarge") [88]
[88] Spine problems with the back and neck are the most common musculoskeletal condition to cause limitations in ADL in young adults, but as the population ages, arthritis or rheumatism is a more common cause. The mean duration for limitations reported for all musculoskeletal conditions is 8 to 18 years. Although there is an increase in years of duration as the population ages, even among young adults aged 18 to 44, the duration of musculoskeletal conditions causing limitations is 8 years or more. (Reference Table 1.6.2 PDF [89] CSV [90])
 [92]
[92] Reflecting the overall prevalence of medical conditions in females, they are also more likely to report impairment in ADL than are males. This is particularly true for musculoskeletal conditions. Females account for 58% of all persons reporting they are limited in activities of daily living; they account for 59% of those reporting a musculoskeletal condition impairment. Two of three adults age 18 and older (64%) reporting arthritis as a cause for ADL limitations are female, while 59% of those reporting connective tissue problems, including fibromyalgia, as the cause of ADL limitations are female. (Reference Tables 1.5.1 PDF [11] CSV [12] and 1.6.1 PDF [93] CSV [94])
Non-Hispanic whites and non-Hispanic blacks, overall, report higher rates of limitation due to medical conditions than Hispanics and non-Hispanic other/mixed race/ethnic persons, except for limitations due to circulatory diseases. Limitations due to musculoskeletal conditions are all reported at higher rates by non-Hispanic whites than by other racial/ethnic groups. (Reference Tables 1.5.3 PDF [83] CSV [84] and 1.6.3 PDF [95] CSV [96])
Again, residents of the Midwest report slightly higher rates of limitations due to medical conditions for all musculoskeletal diseases than do residents of other geographic regions in the US. (Reference Table 1.6.4 PDF [97] CSV [98])
Activities of daily living include walking, climbing steps, standing or sitting for extended periods of time, stooping, reaching, grasping, carrying or pushing/pulling large objects, shopping, and social activities or just relaxing. The number of adults with most major health conditions who have difficulty performing these activities is quite low, representing fewer than two or three adults out of 100. The exception is adults reporting musculoskeletal conditions, for whom the overall rate for a limitation in the performance of any ADL is nearly 15 in 100 persons. For individual ADL, those with musculoskeletal conditions report limitations at two to six times the rate found for other major health conditions. (Reference Table 1.7.1 PDF [99] CSV [100])
 with Performance Limitations Due to Select Medical Conditions, United States 2015 - Click on image to enlarge") [102]
[102] Among the adult population in the work force, 38 in 1000 report they are unable to work at all due to a musculoskeletal disease, with an additional 21 reporting they can do only limited work. This is two times or greater than the rate of the second most work limiting condition, circulatory diseases. (Reference Table 1.7.2 PDF [103] CSV [104])
 [106]
[106] Respondents to the 2015 NHIS self-reported the number of bed days and lost work days they experienced in the previous 12 months due to a variety of medical conditions. A bed day is defined as one-half or more days in bed because of injury or illness in past 12 months, excluding hospitalization. A missed, or lost, work day is defined as absence from work because of illness or injury in the past 12 months, excluding maternity or family leave.
Although the exact cause of these bed and lost work days cannot be determined because some respondents reported multiple health conditions, 70% of persons reporting bed and lost work days reported having a musculoskeletal condition. This is more than twice the proportion of respondents reporting depression, the second most common medical condition listed for causing lost work days, and five or more times the proportion pf respondents reporting other major health conditions. Overall, the high proportion of workers reporting lost work days or bed days as a result of a musculoskeletal condition results in an economic burden on the economy—much higher than that reported for chronic circulatory or chronic respiratory conditions. (Reference Table 1.8.1 PDF [107] CSV [108] and Table 1.8.2 PDF [109] CSV [110])
More than one in four adults in the population (27%), a total of 54 million, reported at least one bed day in the previous 12 months because of a medical condition. More than one-half (14.7%) reported having a musculoskeletal condition, more than reported any other condition. Respondents could report multiple conditions, and bed days could be associated with more than one condition. The mean number of bed days reported with musculoskeletal conditions was 20.4, for a total of 1.1 billion bed days. While other conditions were likely the cause of a higher mean number of bed days, the share of the population reporting these conditions was much smaller.
 [112]
[112] Males and females reported a similar mean number of bed days due to musculoskeletal conditions (20 days vs 21 days), however, because more females report musculoskeletal conditions and bed days than males, the total bed days attributed to females is much greater. Adults in their middle years, age 45 to 64, report higher rates of bed days because of musculoskeletal conditions than do adults age 18 to 44 or over 65.
 [114]
[114] More than 35 million adults in the workforce with a musculoskeletal condition reported lost work days in the previous 12 months, totaling nearly 364 million days. Lost work days for persons with a musculoskeletal conditions accounted for more lost work days than any other major health condition, with workers losing an average of 10 days of work. Chronic circulatory conditions, including high blood pressure and heart conditions, accounted for 283 million lost work days, and were reported by an increasing share of the working age population.
 [116]
[116] As with bed days, females and males reported similar numbers of lost work days, but again, the number of females was higher. The youngest members of the work force, those age 18 to 44, accounted for the largest number of workers with lost work days due to a musculoskeletal condition, but they also represent the largest share of the work force population. They reported a mean of three fewer days lost than the older 45 to 64 worker population. The oldest workers, those age 65 and over, reported a mean of nearly 14 days lost, but comprised a very small share of the work force.
 [118]
[118] Musculoskeletal diagnoses accounted for 19.2%, or 235.1 million, of the 1.225 billion medical diagnoses included in hospital discharge records, emergency department and outpatient clinic visits, and physician office visits in the United States in 2013. Seven in ten of the discharges/visits were to a physician’s office, but musculoskeletal visits as a share of total healthcare visits were highest for hospital discharges (29.6%) and emergency department visits (28.9%). (Reference Table 1.9.1 PDF [119] CSV [120] and Table 1.9.2 PDF [121] CSV [122])
 [124]
[124] On average, each person in the United States received medical care for four diagnoses during 2013, or 3,874 diagnoses per a population of 1,000. Of these, 747 diagnoses were for musculoskeletal conditions, indicating that seven in ten persons had a healthcare discharge or visit related to a musculoskeletal disease. The most common musculoskeletal diagnoses are "other and unspecified disorders of the back" and "other and unspecified disorders of joints," with 141.9 and 106.8 diagnoses per 1,000 persons, respectively. Of the more specific diagnoses, disc disorders (50.4/1000), osteoarthrosis and allied disorders (49.6/1000) spondylosis and allied disorders (22.2/1000) were the most common. (Reference Table 1.9.3 PDF [125] CSV [126])
The majority of all diagnoses and musculoskeletal diagnoses are made in a physician office. However, hospital discharges and emergency department visits are seen more frequently for musculoskeletal conditions than for health care visits for all conditions overall. (Reference Table 1.9.2 PDF [121] CSV [122])
 [128]
[128] Among the major diagnostic categories of musculoskeletal diagnoses, Arthritis and Other Rheumatic Conditions (AORC) accounted for nearly half the musculoskeletal related visits at a rate of 350.8/1000. Spine and injuries each accounted for just over one in five visits (210.1/1000 and 207.7/1000, respectively). Although the remaining musculoskeletal disease diagnostic categories represent much smaller shares of visits and impact fewer persons, they remain a major cause for pain and disability. (Reference Table 1.9.6 PDF [129] CSV [130])
 [132]
[132] Musculoskeletal procedures comprised only slightly more than 1% of all medical procedures performed in hospitals, outpatient clinics, emergency departments, and physician offices in 2013. However, 62 musculoskeletal procedures were performed more than 12,000 times each. The top two procedures, together performed nearly 5.8 million times, are the injection of a therapeutic substance into a joint or ligament and into soft tissue. The third most frequently performed musculoskeletal procedure, performed nearly 800,000 times in 2013, was arthrocentesis, the removal of fluid from a joint. All three are routinely performed in a physician’s office. Joint replacement procedures ranked 4th (total knee), 7th (total hip), 16th (partial hip), and 19th (revision knee replacement), all of which are projected to increase dramatically by 2030, particularly by persons under the age of 65.1 Reduction of fractures and spinal fusion procedures rounded out the remaining top 20 procedures. These procedures are primarily performed in a hospital. (Reference Table 1.10.1 PDF [133] CSV [134])
Looking at musculoskeletal procedures by major groups (2-digit ICD-9-CM codes), 60% of procedures belong to the repair and plastic operations on joint structures (81). This group includes joint replacement and spinal fusion procedures, both among the most frequent procedures performed, as well as injections of therapeutic substance into joint or ligament, the most frequent musculoskeletal procedure performed. Operations on muscle, tendon, fascia, and bursa comprise 10% of all musculoskeletal procedures performed. This category (83) includes the second most frequent procedure, injection of locally-acting therapeutic substance into other soft tissue. (Reference Table 1.10.2 PDF [135] CSV [136])
 [138]
[138]
The annual average proportion of the US population with a musculoskeletal condition requiring medical care has increased by more than six percentage points over the past two decades and now constitutes more than 34% of the population. This is an overall rate of increase of 21%. The majority of growth in both the proportion of the population, and in the number of people with a musculoskeletal condition is in the 45 to 64-year age bracket, with persons age 65 years and older with musculoskeletal conditions also rising. (Reference Table 8.1.1 PDF [139] CSV [140])
 [142]
[142] In 2012 to 2014, the annual estimated direct and indirect cost attributable to persons with a musculoskeletal disease is $322 billion. Taking into account all costs for persons with a musculoskeletal disease including other co-morbid conditions, the cost of treating these individuals and the cost to society in the form of decreased wages is estimated to be nearly $980 billion per year. Over the last 18 years, costs associated with musculoskeletal conditions have risen from 3.44% of the GDP to 5.76%. (Reference Table 8.6.1 PDF [143] CSV [144]; Table 8.12 PDF [145] CSV [146]; and Table 8.14 PDF [147] CSV [148])
 Costs of Musculoskeletal Conditions as a Proportion of Gross Domestic Product (GDP) in 2014 $s, United States 1996-2014 - Click on image to enlarge") [150]
[150] Treatments that mitigate the long-term impacts of musculoskeletal conditions and return persons to full and active lives are needed.
The increasing prevalence of musculoskeletal conditions, along with a growing and aging population, has resulted in more than a 44% increase in total aggregate direct cost to treat persons with a musculoskeletal condition over the past decade (2002-2004 to 2012-2014), in constant 2014 dollars. For the years between 2012 and 2014, the annual average direct cost in 2014 dollars for musculoskeletal health care—both as a direct result of a musculoskeletal disease and for patients with a musculoskeletal disease in addition to other health issues—is estimated to be $980.1 billion, the equivalent of 5.76% of the national gross domestic product (GDP).
Total medical care costs are the costs for treating all of an individual’s conditions, including musculoskeletal conditions. Incremental medical care costs are that part of total medical care costs attributable solely to the musculoskeletal conditions. Incremental medical costs for musculoskeletal conditions for the years between 2012 and 2014 are estimated to be $162.4 billion, in 2014 dollars. (Reference Table 8.14 PDF [147] CSV [148], and Table 8.6.1 PDF [143] CSV [144])
Indirect costs measure disease impact in terms of lost wages due to disability or death. Indirect costs, like medical care costs, can be estimated and calculated in total for all the medical conditions an individual has, and as the increment attributable solely to musculoskeletal conditions.
Indirect cost for people age 18 to 64 with a work history add another $97.5 billion, or 0.5% of the GDP in between 2012 and 2014, to the cost for all persons with a musculoskeletal disease, either treated as a primary condition or in addition to another condition. Annual indirect costs attributable to musculoskeletal disease alone (incremental cost) account for an estimated $159.2 billion. Indirect costs attributable to musculoskeletal disease are greater than total indirect costs wage losses attributable to musculoskeletal conditions are greater than the mean difference in wages between the two groups, an indication that persons with musculoskeletal conditions work less than expected of persons their ages. (Reference Table 8.12 PDF [145] CSV [146])
The importance of musculoskeletal conditions in society necessarily increases with an aging population since the prevalence and impact increase with age. An aging population puts increased numbers of persons in the age range of greatest risk for onset and worsened severity. However, it is not only among the elderly, or persons age 65 or older, that the impacts of aging are felt. Because the prevalence of musculoskeletal conditions is substantial among those 45 to 64 years of age, the proportion of all cases of musculoskeletal disease in this age range increased by one-third over a 15-year time frame, from about 29% (21.8 million persons) in the years 1996 to 1998 to about 38% (40.7 million persons) between 2012 and 2014. During the same time periods, the proportion of cases among the elderly increased by 19%, from about 22% (16.5 million persons) in the earlier three-year period to about 26% (27.8 million persons) in the later one. (Reference Table 8.1.1 PDF CSV) Because conditions that exist among persons age 45 to 64 are likely to last for a long time, the increased proportion of cases in this age range may lead to protracted high medical care costs in the years to come.
The relative importance of this age range in costs of care is already clear. Between 1996 to 1998 and 2012 to 2014, the proportion of all medical care costs experienced by persons with musculoskeletal conditions who are between ages 45 and 64 increased by 39%, from about 30% of all such costs to 42%. The proportion of incremental musculoskeletal medical care costs among persons 45 to 64 years of age increased by an even more, 82%, rising from 28% in the 1996 to 1998 period to 51% between 2012 and 2014. (Reference Table 8.9 PDF [151] CSV [152])
The aging of the US population puts an increased proportion of the population at the ages of highest risk of the onset of musculoskeletal conditions and, among those with these conditions, at the ages of highest severity levels. The problem of aging is made more severe by the fact that many major chronic diseases are more prevalent in late middle age and among the elderly. In fact, most of the latter group has two or more chronic diseases. The impact of comorbidity is reflected in the cost data presented in this volume. Not only are the incremental costs, that is, those attributable to the musculoskeletal conditions, high among those age 45 and older, but the total medical costs they experience are also higher in these age ranges. The problems of an aging population are exacerbated by the occurrence of multiple chronic diseases.
The increased prevalence of musculoskeletal conditions associated with the aging population will necessarily place increased demands on the healthcare system. However, the growth in the healthcare workforce is not keeping pace with the growing prevalence of musculoskeletal conditions. In fact, two medical specialties focused on the care of persons with these diseases, rheumatology and geriatrics, are having a difficult time recruiting new physicians.
It is also the case, as documented in The Big Picture: Funding [153]that research funding for musculoskeletal conditions, relatively small to begin with, is not keeping up with the growing importance of this disease group. Prior research has led to dramatically improved treatments for inflammatory conditions, such as rheumatoid arthritis (principally because of the development of biological treatments) and to mechanical ones such as osteoarthritis (principally because of the improvement in total joint replacement rates). However, in order to deal with the increased numbers of patients associated with the aging population, research funding must be expanded in sheer dollars and in scope to encompass the cause, treatment, and organization of care.
The Burden of Musculoskeletal Diseases in the United States (BMUS) project was designed to provide primary data on musculoskeletal disorders related to prevalence and incidence, healthcare utilization, and burden, including economic costs, in the US as tools to support policy decision makers in the need for greater attention to be paid to musculoskeletal diseases. As BMUS moves forward, it is being asked to include a much broader picture of musculoskeletal disorders, including, but not limited to, a better description and understanding of disorders, comparison to global burden, treatment options/effectiveness/costs, quality of life, disparities in diagnosis and treatment, and the role of comorbidities. All these areas are critical to addressing the importance of recognizing and treating musculoskeletal diseases. Data to support addressing these issues must be addressed.
More than one in two persons age 18 years and older in the US population reports a chronic musculoskeletal condition. This compares to a rate of 42 and 24 persons per every 100 in the population for circulatory (including treatment for high blood pressure) and respiratory conditions, respectively.
Chronic low back pain, joint pain, and disability from arthritis comprise three of the top five most commonly reported medical conditions. The two non-musculoskeletal conditions are chronic hypertension and chronic high cholesterol. All five conditions were reported by 55 million or more persons in 2015. This compares to less than 30 million with other common conditions such as coronary or respiratory conditions. The number of persons suffering from musculoskeletal conditions is expected to continue to increase as once active individuals move into their older years.
The cost to treat the pain and disability resulting from musculoskeletal diseases is rising rapidly. The annual average direct and indirect (because of lost work) costs attributable to persons with a musculoskeletal disease were $322 billion between 2012 and 2014. Over the last 18 years, costs associated with musculoskeletal conditions have risen from 3.44% of the GDP to 5.76%.
In spite of this, research funding for musculoskeletal-related conditions remains substantially below that of other major health conditions, such as cancer and respiratory and circulatory diseases. If healthcare costs in the future are to be contained, musculoskeletal diseases must come to the forefront of medical research efforts.
135 : Sarcoidosis
170 : Malignant neoplasm of bone and articular cartilage
171 : Malignant neoplasm of connective and other soft tissue
198 : Secondary malignant neoplasm of bone and bone marrow
203 : Multiple myeloma and immunoproliferative neoplasms
213 : Benign neoplasm of bone and articular cartilage
215 : Other benign neoplasm of connective and other soft tissue
238 : Neoplasm of uncertain behavior of other and unspecified sites and tissues; Connective and other soft tissue; Bone soft tissue and skin
239.2 : Neoplasms of unspecified nature; Bone soft tissue and skin
274 : Gout; Gouty arthroplathy
710 : Diffuse diseases of connective tissue
711 : Arthropathy associated with infections
712 : Crystal arthropathies
713 : Arthropathy associated with other disorders classified elsewhere
714 : Rheumatoid arthritis and other inflammatory polyarthropathies
715 : Osteoarthrosis and allied disorders
716 : Other and unspecified arthroplasties
717 : Internal derangement of knee
718 : Other derangement of joint
719 : Other and unspecified disorders of joint
720 : Ankylosing spondylitis and other inflammatory spondylopathies
721 : Spondylosis and allied disorders
722 : Intervertebral disc disorders
723 : Other disorder of cervical region
724 : Other and unspecified disorders of back
725 : Polymyalgia rheumatica
726 : Peripheral enthesopathies and allied syndromes
727 : Synovitis and tenosynovitis
728 : Disorders of muscle, ligament, and fascia
729 : Other disorders of soft tissue
730 : Acute osteomyelitis
731 : Osteitis deformans and osteopathies associated with other disorders classified elsewhere
732 : Osteochondropathies
733 : Other disorders of bone and cartilage (Osteoporosis; pathologic fracture, cyst, necrosis of bone, malunion and nonunion of fracture)
734 : Flat foot
735 : Acquired deformities of toe
736 : Acquired deformities of forearm
737 : Curvature of spine
738 : Other acquired deformity (of musculoskeletal system), spondylolisthesis
739 : Nonallopathic lesions, not elsewhere classified
741 : Spina bifida
754 : Certain congenital musculoskeletal deformities
755 : Other congenital anomalies of limbs (Polydactyly)
756 : Other congenital musculoskeletal anomalies
805 : Fracture of vertebral column without mention of spinal cord injury
806 : Fracture of vertebral column with mention of spinal cord injury
807 : Fracture of vertebral column with mention of spinal cord injury
808 : Fracture of pelvis (Acetabulum, closed)
809 : Ill-defined fractures of bones and trunk
810 : Fracture of clavicle (closed)
811 : Fracture of scapula (closed)
812 : Fracture of humerus (Upper end, closed)
813 : Fracture of radius and ulna (Upper end, closed)
814 : Fracture of carpal bone(s) (Closed)
815 : Fracture of metacarpal bone(s) (Closed)
816 : Fracture of one or more phalanges of hand (Closed)
817 : Multiple fractures of hand bones
818 : Ill-defined fractures of upper limb
819 : Multiple fractures involving both upper limbs, and upper limb with rib(s) and sternum
820 : Fracture of neck of femur (transcervical fracture, closed)
821 : Fracture of other and unspecified parts of femur (Shaft or unspecified part, closed)
822 : Fracture of patella
823 : Fracture of tibia and fibula, upper end (closed)
824 : Fracture of ankle
825 : Fracture of one or more tarsal and metatarsal bones
826 : Fracture of one or more phalanges of foot
827 : Other, multiple, and ill-defined fractures of lower limb
829 : Fractures of unspecified bones
831 : Dislocation of shoulder
832 : Dislocation of elbow
833 : Dislocation of wrist
834 : Dislocation of finger
835 : Dislocation of hip
836 : Dislocation of knee
837 : Dislocation of ankle
838 : Dislocation of foot
839 : Other, multiple, and ill-defined dislocations
840 : Sprains and strains of shoulder and upper arm
841 : Sprains and strains of elbow and forearm
842 : Sprains and strains of wrist and hand
843 : Sprains and strains of hip and thigh
844 : Sprains and strains of knee and leg
845 : Sprains and strains of ankle and foot
846 : Sprains and strains of sacroiliac region
847 : Sprains and strains of other and unspecified parts of back
848 : Other and ill-defined sprains and strains
875 : Open wound of chest (wall)
876 : Open wound of back
877 : Open wound of buttock
879 : Open wound of other and unspecified sites (except limbs)
880 : Open wound of shoulder and upper arm
881 : Open wound of elbow, forearm, and wrist
882 : Open wound of hand except finger(s) alone
883 : Open wound of finger(s)
884 : Multiple and unspecified open wound of upper limb
885 : Traumatic amputation of thumb
886 : Traumatic amputation of other finger(s)
887 : Traumatic amputation of arm and hand (complete) (partial)
890 : Open wound of hip and thigh
891 : Open wound of knee, leg [except thigh], and ankle
892 : Open wound of foot except toe(s) alone
893 : Open wound of toe(s)
894 : Multiple and unspecified open wound of lower limb
895 : Traumatic amputation of toe(s)
896 : Traumatic amputation of foot (complete) (partial)
897 : Traumatic amputation of leg(s) (complete) (partial)
922 : Contusion of trunk
923 : Contusion of upper limb
924 : Contusion of lower limb and of other and unspecified sites
926 : Crushing injury of trunk
927 : Crushing injury of upper limb
928 : Crushing injury of lower limb
929 : Crushing injury of multiple and unspecified sites
954 : Injury to other nerve(s) of trunk, excluding shoulder and pelvic girdles
955 : Injury to peripheral nerve(s) of shoulder girdle and upper limb
956 : Injury to peripheral nerve(s) of pelvic girdle and lower limb
959 : Injury, other and unspecified (to musculoskeletal system)
996 : Complications peculiar to certain specified procedures
V43.6 : Organ or tissue replaced by other means (joint)
V54 : Other orthopaedic aftercare
V67 : Follow-up examination, following surgery
Spine disorders includes two major areas:
Low Back and Neck Pain [154] and Spinal Deformity [155].
Lumbar/low back pain and cervical/neck pain are among the most common medical conditions requiring medical care and affecting an individual’s ability to work and manage the daily activities of life. Back pain is the most common physical condition for which patients visit their doctor. In any given year, between 12% and 14% of the United States adult population age 18 and okder visit their physician with complaints of back pain. The number of physician visits has increased steadily over the years. In 2013, more than 57.1 million patients visited a physician with a complaint of back pain, compared to 50.6 million in 2010. (Reference Table 2A.5 PDF [156] CSV [157]) In addition, an unknown number of patients visit a chiropractor or physical therapist for these complaints.
A large healthcare survey is conducted annually in the United States by the National Center for Health Statistics to identify the incidence and prevalence of select health conditions. On average, back pain was reported by 33.9% of persons aged 18 years and older for the years 2013-2015. Low back pain was the most common type of back pain, affecting 28.5%; neck pain was the second most common at 15.0%. The prevalence of back pain has remained stable since 20051 and is measured in response to the question of whether the individual “had low back pain or neck pain during the past three months.” Females report back pain more frequently than males (36.6% vs. 31.0%). The prevalence of low back pain and neck pain is highest for adults aged 65 years and over, but only slightly lower for adults aged 45-64. White, non-Hispanic adults are responsible for the highest prevalence of all back pain at 36.4%. When comparing geographic regions of the US, patients located in the Midwest report back and neck pain at the highest percentage (36.6%). (Reference Table 2A.1 PDF [158] CSV [159])
 [161]
[161]  [163]
[163] Approximately 1 in 17 persons (6.0%) of the population age 18 or older report they have a health condition that precludes work. Among these adults, 25.8%, or about 4 of the 17, are unable or limited in work due to chronic back or neck problems. (Reference Table 2A.11.1 PDF [164] CSV [165])
The estimated annual direct medical cost for all persons with a back-related condition in 2014 dollars was an average of $315 billion per year across the years 2012-2014. (Reference Table 8.6.2 PDF [166] CSV [167]) This is further discussed under the Economic Burden topic in this Spine section, and in the Economic Cost topic at this site. As noted previously and elsewhere, this is not the true cost because chiropractic care, physical therapy, alternative therapy, and other care is not included in the analysis. Also, treatment cost from outpatient clinics is currently not available; hence, these data are missing or incomplete.
Back pain often originates from sources that are not readily identifiable. Many causes of back pain are likely related to degenerative changes, but the actual underlying cause of a given back pain episode is often uncertain. In reviewing administrative data for prevalence, it is important to realize that the diagnostic categories may be inaccurate because they reflect differing interpretations about the source of the back pain rather than an absolute diagnosis. This will be discussed further in later sections.
For purposes of further analysis, we decided to divide the diagnostic codes defining the burden of spine problems into three groups: back disorders, disc disorders, and back injuries. This approach allows comparison to earlier editions of the text. We are aware there may be substantial overlap, and that some of the back disorders may be related to degenerative disc changes and some of the disc disorders may have another origin. The role of disc degeneration in the cause of back pain remains uncertain. Intervertebral disc degeneration and associated facet joint osteoarthritis seem to be a natural process of aging but can alter the biomechanics and function of the spine. Studies have identified a strong genetic predisposition, but there are modifying influences including age, obesity, smoking, and genetics.
In the tables and text, we define back disorders by diagnostic ICD-9-CM Codes 720, 721, and 724. These codes include inflammatory spine conditions, spondylosis, spinal stenosis, lumbago, sciatica, backache, and disorders of the sacrum. Disc disorders include herniations, disc degeneration, and post-laminectomy syndromes (ICD-9-CM Code 722). Back injuries include fractures, dislocations, and sprains (ICD-9-CM Codes 805, 806, 839, 846, and 847). The same classifications are used for both low back pain and neck pain. Thoracic back pain, or upper and middle back pain associated with the 12 spinal bones connected to and in the same level in the body as the 12 ribs, is less common and not as well studied. Data associated with thoracic spine pain is generally included in the analysis of low back back and disc disorders and injuries.
Unfortunately, the databases do not permit diagnostic verification. Sometimes diagnoses are provided primarily for reimbursement purposes, with little emphasis on accuracy. Further, there is considerable overlap. For example, a patient with back pain of unknown origin could be given the diagnosis of lumbago, placing him or her in the back disorder category. He or she may also have disc degeneration with a diagnosis of degenerative disc disease and, therefore, be placed in the disc disorder category. Or, if his or her problem developed after a lift or twist, it could be diagnosed as a back strain, falling into the back injury category.
In the tables and graphs, total healthcare visits include hospital discharges obtained from the 2013 Healthcare Cost and Utilization Project (HCUP) National Inpatient Sample, emergency department visits obtained from the 2013 HCUP Nationwide Emergency Inpatient Sample, hospital outpatient visits obtained from the 2011 National Hospital Ambulatory Medical Care Survey Outpatients (NHAMCS-OP), and physician office visits obtained from the 2013 National Ambulatory Medical Care Survey (NAMCS).
Using the diagnostic code grouping discussed above, back disorders accounted for 82% of low back pain healthcare resource utilization in 2013. Back disorders accounted for 75% of hospitalizations. Disc disorders accounted for 16% of low back pain resource visits, and approximately 23% of hospitalizations. Emergency department visits for disc disorders were not common, comprising only 7% of all back pain-related visits. Back injuries, which include fractures, sprains, and strains, are often reported as caused by overexertion or overuse. They accounted for the remaining 12% of 2013 low back pain resource visits. Back injuries were most commonly seen in the emergency room (23%), but constituted only 8% of hospitalizations, indicating that most were manageable in an outpatient setting, and were most likely soft tissue injuries. (Reference Table 2A.2.1 PDF [168] CSV [169])
 [171]
[171] For each of the years 2013 to 2015, an annual average of nearly 29% of the US population age 18 years and older self-reported having had low back pain during the past three months. Among persons reporting low back pain, one in three (35.7%) suffered from back pain radiating into the leg. Approximately one-third of persons reporting low back pain also reported experiencing neck pain. Lower back pain is reported in higher rates by females (30.5%) than males (26.4%). The highest rates for lower back pain reported for both genders occurred in the 45-64 years age group (33.3%); there is a slight decrease in low back and neck pain complaints in ages 65 years and older (32.8%). Low back pain is most prevalently reported in the non-Hispanic white ethnic group. The Midwest region of the United States is responsible for recording the highest prevalence of low back pain. With the exception of persons 18 to 44 years, the prevalence of lower back pain with or without radiating leg pain did not vary considerably across all measured demographic categories. (Reference Table 2A.1 PDF [158] CSV [159])
As discussed previously, healthcare utilization by people with low back pain, which represents 82% of back pain healthcare visits, is only understood in part due to the lack of information about visits to chiropractors, physical therapists, and others involved in the care of back pain. Even so, the reported numbers in the databases are very high. In 2013, nearly 62 million visits to hospitals, emergency departments, outpatient clinics, and physician offices included a diagnosis of low back pain. Three in four visits were to physician offices, but more than 2.3 million patients were hospitalized and almost 10 million patients were treated for low back pain at an emergency department. (Reference Table 2A.2.1 PDF [168] CSV [169] and Table 2A.4.1 PDF [172] CSV [173])
 [175]
[175]
The prevalence of low back pain healthcare visits is greatest in the 45-64 years age group, closely followed by the 18-44 years age group. Together, the 18-64 years age group represents 72% of all low back pain healthcare visits. However, adjusting for the 2013 US Census population estimates, healthcare visits for low back pain per 100 persons is highest in the 65 years and older age group, where it is 36.1%. In reviewing the three low back diagnostic categories, the category labeled "back disorders" dominates in all age groups. Disc disorders are uncommon in the younger than 18 years age group, but increase in frequency as the population ages, and are most prevalent in the 45-64 years age group. Back injuries are more common in patients younger than age 45 years (48%), declining to 14% in those 65 years and older. (Reference Table 2A.2.2 PDF [176] CSV [177])
 [179]
[179] The average age of persons hospitalized in 2013 for low back pain was 61.8 years. This compared to an average age of 47.2 years for persons visiting an emergency department, 49.4 years for visits to outpatient departments, and 54.5 years for visits to a physician. These numbers are essentially unchanged since 2010, with the exception of the average age of persons visiting an emergency department, which increased by 4.5 years. (Reference Table 2A.2.2 PDF [176] CSV [177])
 [181]
[181] Low back pain is found more frequently among females than males, with females representing 55% of healthcare resource visits. Back disorders, in particular, are more common in females, while disc disorders and back injuries are recorded similarly between sexes. Over 8 in 10 (84.4%) female healthcare visits in 2013 for low back pain were classified as back disorders, compared to 80.4% for males. This is probably a reflection of the prevalence of spinal stenosis and degenerative spondylolisthesis in both sexes. (Reference Table 2A.2.1 PDF [168] CSV [169])
 [183]
[183] Ethnic groups show preferences in where they might go to receive healthcare for low back pain, as exemplified by the rate of visits per 100 persons per race/ethnicity in the population. Overall, three out of four (74%) patients seen at a hospital were non-Hispanic whites, totaling approximately 1.8 million visits. This is in comparison to a combined total of 380,000 inpatient visits for non-Hispanic black (10%) and Hispanic (6%) visits. In contrast, for outpatient healthcare visits, non-Hispanic black (15%) and Hispanic (13%) ethnic groups reported an increase in percentage of visits compared to the hospital setting, a total of 1.2 million visits. Non-Hispanic white (66%) patients reported 2.8 million outpatient low back pain visits. Race/ethnicity is not reported in the NEDS database on emergency department visits. (Reference Table 2A.2.3 PDF [184] CSV [185])
Total healthcare visits for low back pain reflected differences between regions regarding back injuries (7.2 million) and back and disk disorders (50.9 million; 10 million). The southern United States recorded the highest percentage of total visits for back and disc disorders (31%; 40%), while the western United States recorded the highest percentage of total visits for back injuries (31%). (Reference Table 2A.2.4 PDF [186] CSV [187])
Persons hospitalized for low back pain in 2013 spent, on average, nearly 5 days in the hospital. Persons hospitalized for low back injuries were hospitalized for the longest period, an average of 6.8 days. When comparing the total days of hospitalization for all causes with those for low back pain are similar. As a proportion of hospitalizations for all causes, back pain constitutes 7% of both discharges and of total hospital days. The length of hospital stays has remained relatively stable since 2004. (Reference Table 2A.8 PDF [188] CSV [189] and Table 2A.9 PDF [190] CSV [191])
The mean length of stay for all low back pain discharges was similar between sexes. Regarding back injuries, length of stay of males is 1.5 days longer than for females (7.6 vs 6.1 days). (Reference Table 2A.10.1 PDF [192] CSV [193])
Age is an important factor influencing length of stay. Although they constitute a small proportion of back pain hospitalizations, persons younger than 18 years have longer stays for back pain, a ratio of 1.56 days longer, when compared to the average length of stay for all causes for this age group. After the age of 18 years, the length of hospital stays for back pain tend to increase as the population ages, however, similar patterns are seen with other diagnoses. (Reference Table 2A.10.2 PDF [194] CSV [195])
When comparing length of stay for all causes with those for low back pain, non-Hispanic white patient back pain visits compose 8% of both discharges and of total hospital days, approximately twice the proportion of discharges and of total hospital days reported by all other ethnic groups. However, the average length of stay tended to be slightly longer for non-Hispanic black (5.2 days) and Hispanic (5.1) patients than for non-Hispanic white patients (4.7 days). No considerable difference is observed in length of stay among geographic regions. (Reference Table 2A.10.3 PDF [196] CSV [197] and Table 2A.10.4 PDF [198] CSV [199])
 for Lumbar/Low Back Pain by Age, United States 2013") [201]
[201] Average hospital charges are provided along with length of stay in the HCUP NIS database. On average, hospital charges for a low back pain inpatient visit were 129% that of the average inpatient visit for any cause. In 2013, an estimated $120 million in charges were assessed against the 2.3 million inpatient stays for low back pain, 9% of the estimated total $1.2 billion in hospital charges for that year. Mean charges at $80,800 are highest for lumbar back injuries and, at $46,100, lowest for lumbar back disorders. When comparing male and female differences in the proportion of low back pain inpatient visit to total inpatient visit charges, no significant differences were found. Patients age 45-64 years and 65 years and older represent 83.7% of the total expenditure for low back pain hospital charges among the population. These age groups also demonstrate the highest proportion of total charges for all causes to those for low back pain, 10% on average. (Reference Table 2A.9 PDF [190] CSV [191]; Table 2A.10.1 PDF [192] CSV [193]; and Table 2A.10.2 PDF [194] CSV [195])
 [203]
[203] Variations in hospital charges by US geographic location are observed. The South region, whhich has the largest population, records the highest total hospital charges as well as total discharges among the geographic locations. Across ethnic groups, non-Hispanic white patients account for 76.7% of total charges for hospitalized persons with a diagnosis of back pain while comprising 65.5% of the population. However, the highest mean charges are found among thoses of Hispanic ethnicity. (Reference Table 2A.10.3 PDF [196] CSV [197] and Table 2A.10.4 PDF [198] CSV [199])
Cervical/neck pain is another common reason for visiting a doctor. In 2013, 21.4 million patient visits, or 1.8% of all healthcare visits to hospitals and physician offices, were for neck pain. Three out of four (73%) of these were physician visits, while only a small number (3%) of patients with neck pain were hospitalized. (Reference Table 2A.4.1 PDF [172] CSV [173])
 [205]
[205] Cervical disorders accounted for the majority (72%) of healthcare visits for neck pain in 2013. Neck disorders are primarily treated in outpatient clinics or physician offices but are also responsible for the highest percentage of hospital discharges (65%) for neck pain. Cervical disc disorders accounted for only 16% of all neck pain healthcare visits in 2013 but were responsible for one-third of hospitalizations (32%). Neck injuries accounted for 22% of all neck pain healthcare visits. This is a much higher percentage than that reported for low back injuries. Patients with neck injuries were primarily treated in an outpatient setting and represented 46% of all emergency department visits for neck pain and approximately one out of every five hospital outpatient and physician office visits. (Reference Table 2A.3.1 PDF [206] CSV [207])
 [209]
[209]
The data on cervical/neck pain shows that hospital discharges are rare in people younger than age 18 years. When adjusted for the US 2013 Census population, estimates for hospital discharges are highest in the 45-64 years age group. The average age for persons hospitalized for neck pain was 59.8 years. Emergency department visits occurred most frequently in patients aged 18-44 years with an average age of 44.3 years. The average age of patients for hospital outpatient and physician office visits was 49.9 years and 51.9 years of age, respectively. (Reference Table 2A.3.2 PDF [210] CSV [211])
 [213]
[213] Almost four of five neck pain diagnoses (77.2%) in 2013 occurred in persons between ages of 18 and 64 years. Almost one in five patients (19.7%) were older than 65 years, and only 3.1% were younger than 18 years of age, although this group represents 24% of the US population. The diagnosis category of "cervical disorders" dominated over cervical disc disorders and cervical injury diagnoses categories among total healthcare visits for neck and cervical spine disorders in all age groups. When comparing age groups, patients younger than 18 and patients aged 18-44 years experienced a larger percentage of neck injuries relative to all neck pain visits, 33.3% and 36.4%, respectively. (Reference Table 2A.3.2 PDF [210] CSV [211])
 [215]
[215] In 2013, females accounted for 59% of the healthcare visits for neck pain overall, 59% of cervical disorder visits, and 62% of neck injury visits. Males accounted for 53% of the visits for cervical disc disorders. (Reference Table 2A.3.1 PDF [206] CSV [207])
 [217]
[217] Non-Hispanic black and Hispanic patients display differences in choice of healthcare utilization for neck pain. Non-Hispanic black patients account for 29% of all outpatient visits; 20% are treated in a hospital outpatient clinic and 9% are treated in the physician office setting. In contrast, although Hispanic patients utilize outpatient settings to a similar degree (32%), 14% receive treatment in a hospital outpatient setting and 18% receive treatment in a physician’s office. When evaluating total healthcare visits for neck pain, non-Hispanic white patients account for most of the visits (57%), followed by Hispanic and non-Hispanic black patients (14%; 8%). (Reference Table 2A.3.3 PDF [218] CSV [219])
When adjusted for the US 2013 Census population, estimates for hospital discharges for cervical disorders are similar throughout the four US regions analyzed, but were highest in the South region for emergency department visits (3% of all visits for any diagnoses) and in the West region for outpatient visits (2.7%) and physician office visits (2.3%). Overall, healthcare visits for cervical disorders are highest in the western United States, representing 2.1% of visits for any diagnoses. (Reference Table 2A.3.4 PDF [220] CSV [221])
Persons hospitalized for neck pain in 2013 spent an average of 4.6 days in the hospital. Those hospitalized for neck injuries had the longest stay, on average 7.2 days. When comparing total days of hospitalization for all causes with those for neck pain, the average length of stay is similar. Overall, hospitatl stays for neck pain constituted 2% of both discharges and total hospital days in 2013. The length of hospital stays has remained relatively stable since 2004. (Reference Table 2A.8 PDF [188] CSV [189] and Table 2A.9 PDF [190] CSV [191])
Although females are likely to have slightly shorter hospital stays for all causes of neck pain, it is only for neck injuries that a significant difference is seen: 8.0 days for males versus 6.2 days for females. (Reference Table 2A.10.1 PDF [192] CSV [193])
Age is a greater factor in length of stay than gender. Although persons younger than 18 years of age constitute a small proportion of back pain hospitalizations, they have, on average, a stay that is 1.62 times longer than the average length of stay for persons in this age group for all causes. Hospital stays for neck pain are consistent between ages 18 to 64 years at 4.2 days, increasing to 5.1 days in the 65 years and older age group. (Reference Table 2A.10.2 PDF [194] CSV [195])
Average length of stay for non-Hispanic white patients for all cervical/neck pain is 4.4 days compared with 5.2 days for non-Hispanic black, non-Hispanic other, and Hispanic patients. The length of stay for neck injuries is longer by a day or more for non-Hispanic black, non-Hispanic other, and Hispanic patients compared with non-Hispanic white patients (6.9 to ≥ 8.0) . There is no significant difference in length of stay among geographic regions. The southern region of the United States reports the highest number of discharges and total hospital days for all causes, but this region also has a larger share of the population. (Reference Table 2A.10.3 PDF [196] CSV [197] and Table 2A.10.4 PDF [198] CSV [199])
 for Cervical/Neck Pain by Age, United States 2013") [223]
[223] Average hospital charges are provided along with length of stay in the HCUP NIS database. Hospital charges are not what is actally paid, but the initial charges from the hospital, which provide a measure for comparison purposes. On average, hospital charges for a neck pain inpatient visit were 148% that of the average inpatient visit for any cause. In 2013, an estimated $36 million in charges were assessed against the 614,200 inpatient stays for neck pain, 3% of the estimated total $1.4 billion in hospital charges for that year. Mean charges of $97,400 were highest for neck injuries and, at $52,900, lowest for neck disorders. (Reference Table 2A.9 PDF [190] CSV [191])
In patients with neck pain, the 45-64 and 65 years and older age groups collectively represent 81.8% of the total hospital charges among the population. Of note, the ratio of mean charges for cervical/neck pain to all hospital charges is highest in ages 18 years and younger (3.24), decreasing as the population ages. No considerable differences are reported between males and females in relation to hospital charges. (Reference Table 2A.10.1 PDF [192] CSV [193] and Table 2A.10.2 PDF [194] CSV [195])
Hispanic patients show the largest ratio of mean hospital charges for neck pain-related visits to total hospital visits, at 1.91. This is in comparison to the ratio of 1.53 and 1.42 for non-Hispanic blacks and non-Hispanic whites, respectively. Non-Hispanic white patients account for 73.2% of total spending for neck pain visits, primarily because they compose a larger share of the total population. (Reference Table 2A.10.3 PDF [196] CSV [197])
There is only a slight variation among geographic regions with regard to the ratio of hospital charges for neck pain visits to total hospital visit charges, with the West region of the US displaying the largest ratio of 1.57 based on mean charges per visit of $81,200. The northeastern United States has the smallest ratio,1.36, indicating charges were closer to the overall US average. The Midwest region had the lowest mean charges per visit. Reference Table 2A.10.4 PDF [198] CSV [199])
 [225]
[225] As discussed on previous pages, back pain was the most common reason for healthcare visits among musculoskeletal disorders in 2013. In 2013, nearly 1 in 4 persons (24.7%) in the United States had a healthcare visit with a diagnosis of back pain, accounting for 6.4% of healthcare visits for any cause. Three out of four visits (73%) were physician office visits and the number of physician office visits for back pain continues to increase. In 1998 there were 32 million visits in 2004 nearly 45 million, and in 2013 more than 57 million. Physician office visits for back pain not only show a rapid increase in number, but also continue to include a larger share of the population. In 1998, 11.8 in 100 persons visited a physician because of back pain. In 2004, this had increased to 15.1 persons in 100. Although a slight decrease was seen through 2008, by 2013 the ratio had increased to 18.1 persons in 100. Low back pain accounted for most of the increase in visits. (Reference Table 2A.4.1 PDF [172] CSV [173] and Table 2A.5 PDF [156] CSV [157])
 [227]
[227] With respect to sex, females accounted for 58% of total back pain healthcare visits in 2013, however, the rate of total back pain visits per 100 patients was slightly less than that of males (6.4 vs. 6.5). Persons ages 45 to 64 years had the highest rate of total back pain diagnosis per 100 patient visits (9.5), but those aged 65 and older had the highest rate per 100 persons in their age group (43.7). The rate of total back pain visits per 100 patient visits was similar across all race/ethnic groups and geographic regions, with non-Hispanic whites and residents of the northeastern United States having the highest rates per 100 persons (23.2 and 29.5, respectively). (Reference Table 2A.4.1 PDF [172] CSV [173]; Table 2A.4.2 PDF [228] CSV [229]; Table 2A.4.3 PDF [230] CSV [231]; and Table 2A.4.4 PDF [232] CSV [233])
Most patients who present to a hospital emergency department with back pain are treated and routinely discharged to home from the emergency department (83.2%), with only a minority requiring admission to an inpatient unit (13.4%). These statistics are similar to all other emergency department discharges. When discharged from the hospital after a diagnosis of back pain, whether as a transfer patient from the emergency department or a direct hospital admission, routine discharges drop to about 60%, with 1 in 5 (22%-25%) discharged to another care facility and 13%-14% discharged with home health care. These numbers are somewhat higher than those found among all hospital discharges for any diagnoses. (Reference Table 2A.6 PDF [234] CSV [235])
No significant differences are observed in disposition of back pain visits to the emergency department or hospital between sexes, but females are slightly more likely to be discharged to another care facility or have home health care provided. When comparing age groups, a large majority of routine discharges are observed in patients aged 45 years or younger. The percentage of routine discharges is decreased by 10% to 82.6% for the 45 to 64 years age group, and is reduced by another 20% in the 65 years and older age group (60.6%). By age 65 and older, more than half of the discharges are to another care facility or with home health care. No meaningful differences are observed in the disposition of patients with respect to race/ethnicity. Residents of the Northeast region are the most likely to be discharged to additional care (40.5%). (Reference Table 2A.7.1 PDF [236] CSV [237]; Table 2A.7.2 PDF [238] CSV [239]; Table 2A.7.3 PDF [240] CSV [241]; and Table 2A.7.4 PDF [242] CSV [243])
 [245]
[245]
Approximately 6% of the working age population, persons age 18 years and older, report they are unable to work or limited in the type of work they can perform because of a medical condition. Among this group, 25.8% reported they are unable to work due to back or neck problems. Similar ratios of limitations related to daily living are also found. Approximately 1 in 22 persons of working age has difficulty walking without equipment due to a medical condition; 24.8% report that condition to be back or neck pain. Overall, 13.5% of working-age persons report at least one limitation with activities of daily living, which include eating, preparing food, bathing, rising from a chair, walking up steps, etc. For one in five of these persons, the cause of their limitation is back or neck pain. (Reference Table 2A.11.1 PDF [164] CSV [165])
 [247]
[247] Age groups account for major differences in limitations due chronic back or neck problems. One in three patients age 65 years and older report they have limitations in activities of daily living (ADL), with 1 in 5 (19.2%) reporting ADL due to chronic back or neck pain. Among the 17% of persons with ADL for any cause in the 45 to 64 years age group, 29.9% list the cause is due to chronic back or neck problems. Of note, in this age group, chronic back or neck pain is the cause of each type of limitation, including inablity to work at all or type of work, for approximately 1 in 3 with limitations from any cause. No considerable differences are reported between males and females. (Reference Table 2A.11.1 PDF [164] CSV [165] and Table 2A.11.2 PDF [248] CSV [249])
Although the race/ethnic group classified as non-Hispanic others represents a small proportion of the total population, they report the lowest rates of limitations in activities of daily life. Hispanic patients report fewer limitations due to any health condition (9.8%) than non-Hispanic whites (15.1%) and non-Hispanic blacks (16.1%). Among persons with limitations due to any cause, non-Hispanic whites (20.8%) and non-Hispanic black patients (19.5%) have comparatively higher percentages of limitations due to chronic back or neck problems compared with Hispanic patients (15.1%), with the exception of difficulty walking without equipment. No significant differences are seen among geographic regions in ADL. (Reference Table 2A.11.3 PDF [250] CSV [251] and Table 2A.11.4 PDF [252] CSV [253])
Self-reported bed days and work days lost due to back or neck pain have fluctuated over the past decade. Both recorded their highest totals in 2008, registering 385,000 lost work days and 671,000 bed days. Both bed days and work days lost have remained steady since 2012. (Reference Table 2A.12 PDF [254] CSV [255])
Work days lost due to spine pain or spine problems were more frequently reported by females than males during 2015 (17.4% vs. 13.5%). However, females, on average, lose one less day of work than do men (9.9 to 11.2, respectively). (Reference Table 2A.13.1 PDF [256] CSV [257])
 [259]
[259] Back pain severe enough to keep people from working in any occupation is most likely to occur in the 18 to 64 years age group, accounting for 14.8% of persons in the 18 to 44 years age group, and 16.9% of persons in the 45 to 64 years age group. This is, of course, not surprising since those are the most common years in which people work. The average number of workdays lost was 8.6 and 12.5 days for the two age groups, respectively. The oldest group of workers, age 65 years and older, report more than 16 days of work lost due to spine pain or problems, but they constitute such a small group that their impact is less than that of younger workers. (Reference Table 2A.13.2 PDF [260] CSV [261])
When comparing ethnic groups, Hispanic persons record the highest average number of work days lost due to spine pain (14.1), followed by non-Hispanic whites and non-Hispanic blacks (10.1 days; 9.9 days). No meaningful difference by share of workforce is observed in average number of work days lost due to spine pain according to geographic region, but workers in the Northeast and Midwest regions of the US lose the most days, on average (11.6 and 12.1, respectively). (Reference Table 2A.13.3 PDF [262] CSV [263] and Table 2A.13.4 PDF [264] CSV [265])
The National Health Care Interview Survey also provides information about the incidence of bed days, days in which a person was in bed for a half day or more due to injury or illness, during 2015. The average number of bed days per worker for all spine pain or problems was 7.8 days. On average, males reported taking 8.5 bed days compared to 7.3 bed days taken by females. The percent of people in the workforce reporting bed days due to spine pain or problems is higher in the 18 to 44 years and 45 to 64 years age groups (13.8% and 15.3%, respectively) than for those age 65 and over. This is likely due to the health status of older workers, who tend to be healthy if they are still in the workforce. Between these two age groups, persons 45 to 64 take approximately 3 more bed days than persons 18 to 44 (9.0 vs 6.2). Persons in the 65-year and older age group have the highest average bed days lost per worker due to spine pain or problems (14.9) however, a smaller proportion (11.8%) of this already small workforce reported having bed days from spine pain. Non-Hispanic white and non-Hispanic black persons recorded more bed days due to spine pain or problems (8.2; 8.7) than Hispanic persons (6.3). Comparing geographic regions, patients in the Midwest report the most bed days for spine pain (10.1), more than all other regions. (Reference Table 2A.13.1 PDF [256] CSV [257]; Table 2A.13.2 PDF [260] CSV [261]; Table 2A.13.3 PDF [262] CSV [263]; and Table 2A.13.4 PDF [264] CSV [265])
 [267]
[267] In total, 52.2 million adults in the US workforce spent more than 182 million days in bed in 2015 because of back pain, and during the same time period, almost 264 million work days were lost. The corresponding numbers of days in bed and work days lost in 2012 were 171 million and 291 million, respectively. Approximately one-third of the total workforce (31.9%) reported bed or lost work days due to back pain, but accounted for more than half of total bed days (54%0 and nearly half of total lost work days (47%). The 111.4 million workers not reporting back pain as the cause had 152.9 million bed days and 299.5 million lost work days in 2015. (Reference Table 2A.13.1 PDF [256] CSV [257])
 [269]
[269]  [271]
[271] While nonsurgical treatment for back pain is the treatment of choice, spine surgery becomes an option when neck and low back pain is disabling and not responding to nonoperative treatment alternatives. Further, in some cases such as certain fractures, infections, tumors, and severe neurologic deficits, surgery is the first treatment choice. As mentioned in earlier sections, the information we have with respect to surgical procedures is limited to that obtained from hospitals using the Nationwide Inpatient Sample. Unfortunately, the information is procedure-related and only indirectly patient-related.
In 2007, just under 1.2 million procedures for the eight most common spine procedures were performed on 662,400 patients in hospitals. In 2011, the number of patients had increased to 741,700 with a corresponding increase in the number of hospital procedures to 1.4 million. In 2013, the number of patients receiving the most common procedures, which added epidural injections to the earlier list of eight procedures, decreased to 692,585, while total procedures decreased slightly to 1.3 million. (Reference Table 2A.15 PDF [272] CSV [273])
 [275]
[275] The number of spinal decompression procedures performed, along with other procedures for which inpatient hospitalization is not always required, may not be reflected accurately because an increasing number of these patients are operated on in outpatient surgicenters and facilities. This can be, in part, illustrated here. In 2011, there were 369,900 diskectomies performed compared with 316,700 in 2013. Spinal fusion procedures were listed as the main hospital procedure, being performed 457,500 times in 2011 and 434,500 times in 2013. The majority of insertions of spinal devices, the third most common procedure group, likely occurred in patients with spinal fusions. Spinal decompression, which may or may not be performed in conjunction with a spinal fusion or in conjunction with a diskectomy, accounted for 12.5% of all procedures in 2011 and 11.8% in 2013. Changes in procedure codes for decompression between 2011 and 2013 may have partly been the cause of fewer reported decompression procedures. (Reference Table 2A.15 PDF [272] CSV [273])
Compared to the inpatient hospital setting, other healthcare sites offer a limited variety of spinal procedures. In the emergency department (ED) setting, epidural injections accounted for over 6,000 procedures, more than half of the 12,000 total procedures reported in the ED. The only procedures recorded in physician office visits were epidural injections, but they accounted for the majority of epidural injections in 2013 and reflect the variety of healthcare sites in which epidural injections can be administered. (Reference Table 2A.14 PDF [276] CSV [277])
 [279]
[279]
The rate of spinal fusion procedures has risen rapidly over the past several decades. Spinal fusion is performed either alone or in conjunction with decompression and/or reduction of a spinal deformity. Fusions are performed on all regions of the spine. Lumbar fusion rates and cervical fusion rates are both increasing rapidly, while thoracic fusions continue to be less frequent. Lumbar fusions remain the most common, constituting 52% of all spine fusion procedures in 2013. Spinal refusion occurs most often to the lumbar region, accounting for 65% of both refusion procedures and refusion patients. (Reference Table 2A.16.1 PDF [280] CSV [281])
 [283]
[283] Between the years 1998 and 2013, the number of spinal fusion procedures more than doubled, from 220,000 in 1998 to 445,000 in 2013. This is a 137% increase in procedures over a 16-year period. The period from 2004 to 2011 reflected an increase of 61%, but from 2011-2013 there was a 15% decrease in recorded spinal fusions performed, most likely due to a larger proportion of these procedures being performed at an outpatient site. The rate of adult patients undergoing spinal fusion has increased from 110 per 100,000 persons in 1998 to 183 per 100,000 in 2013. During the same time period, refusion rates increased by 187% and from 6 to 13 persons per 100,000. Between 1998 and 2013, the average age of patients undergoing a fusion procedure has increased from 49.0 years to 56.4 years. (Reference Table 2A.16.2 PDF [284] CSV [285])
 [287]
[287]
Although the mean length of stay for spinal fusion has decreased from 4.7 days in 1998 to 3.9 days in 2013, the mean hospital charge for these patients has increased significantly. The mean hospital charge in 1998 was $26,000 ($37,200 in 2013 dollars); while in 2013 the mean charge was $112,000. Increased use of instrumentation and biologicals (mainly bone substitutions) contribute to the higher cost. The total increase in hospital charges rose from $5.4 billion ($7.6 billion in 2013 dollars) to $48.7 billion over this 16-year period, an increase of more than 542%. Spinal refusion procedures are even more expensive, with an average charge of $129,000 in 2013, while the length of stay remained relatively constant. This, of course, does not mean that cost or reimbursement was even close to these dollar numbers. These charges are based on what hospitals set as their charges, and do not reflect the contractual agreements they have with the payer community. (Reference Table 2A.16.2 PDF [284] CSV [285])
 [289]
[289] Likely explanations for the increase in spinal fusions include advances in technology, such as the development of new diagnostic techniques and new implant devices that allow for better surgical management. In addition, there has been increased training in spinal surgery and the population has aged, presenting an increase in age-related medical problems. Further, higher expectations regarding quality of life makes patients less accepting of an ongoing back problem and more likely to look for a surgical solution.
Using the Nationwide Inpatient Sample in 2013, a broad estimate can be made of fusion procedures as it relates to admissions. In 2013, 14.6% of patients discharged with a diagnoses of back pain had a spinal fusion procedure. Males (15.4% of back pain discharges) and females (13.9%) are almost equally likely to have a fusion. Patients in the 45- to 64-year age group were slightly more likely to have a fusion procedure (19.2%) than those in the 18- to 44- years age group (15%), or in the 65- years and older age group (10.5%). Patients younger than age 18, at 24.2%, were most likely to undergo a fusion procedure when hospitalized with a diagnosis of back pain, but they constitute a very small group of patients (1.6%) among those discharged with a diagnoses of back pain. Non-Hispanic white patients hospitalized with back pain were most likely to receive a fusion (15%) when compared to non-Hispanic black (12%) and Hispanic (13%) patients. Patients in the southern United States were most likely to undergo a fusion procedure (15.7%). Patients in the western United States were second most likely to receive a spinal fusion, followed by patients in the Northeast (13.8%) and Midwest (13.3%). The length of stay was shorter if a fusion was performed than if no fusion was performed (3.9 days vs. 4.8 days), but the mean charges were more than doubled for a back pain diagnosis when a fusion was performed ($52,630 vs $110,960). (Reference Table 2A.17 PDF [290] CSV [291])
 [293]
[293]
Information on the top twenty primary diagnoses and accumulative first five diagnoses for spinal fusion procedures performed in 2013 illustrates the procedure is most frequently performed in patients with lumbar spinal stenosis with or without neurogenic claudication. Lumbar disc degeneration or cervical disc displacement account for 9.6% and 9.5% of fusion procedures, respectively. (Reference Table 2A.18 PDF [294] CSV [295])
 Diagnosis for Spinal Fusion Procedures, United States 2013") [297]
[297]
Diskectomy procedures, a surgical procedure to remove the damaged portion of a herniated disk, occurred in approximately 317,000 hosptial inpatients in 2013, with slightly more females than males undergoing the procedure. This number is likely misleading because many diskectomy procedures now occur in an outpatient setting. Of those undergoing the procedures, 35.3% had a diagnosis of either lumbar or cervical disc displacement, while 12% had a diagnosis of either lumbar or cervical disk degeneration. Approximately half of all diskectomy procedures were performed on persons in the 45 to 64 years age group, with an average age of 55.3 years. Across ethnic groups, the average age of presentation when undergoing diskectomy procedure was in the mid-50s. Non-Hispanic white patients accounted for 76% of total discharges, followed by non-Hispanic black (7.7%) and Hispanic (5.8%) patients. When comparing geographic regions, a discrepancy in charges per diskectomy was observed. The South region of the US reported the highest number of total discharges, roughly 41% of all diskectomy procedure discharges, bu this is non-unexpected given the larger share and older age of the population in the South. The Midwest ranked second in total discharges with 21%, followed by the West (20%) and Northeast (17%). (Reference Table 2A.19 PDF [298] CSV [299] and Table 2A.20 PDF [300] CSV [301])
 Diagnosis for Diskectomy Procedures, United States 2013") [303]
[303] Patients spent, on average, 3.0 days in the hospital for diskectomy procedures, a surprising number given the recent trends in discharge the same day. Although accounting for a very small number of procedures, persons younger than age 18 years had an average length of stay of 6.8 days. The mean charge for these procedures in 2013 dollars was $87,280. The western United States reported the highest charges, averaging $116,000 per procedure. This is significantly higher than the rest of the country, with the South at an averaged of just below $88,000, while the Northeast and Midwest regions were approximately $72,000. Hispanic patients averaged the highest mean charges for diskectomy procedures, estimated at $110,180. This is in comparison with a $92,730 mean charge for non-Hispanic black patients and a $86,740 mean charge for non-Hispanic white patients. (Reference Table 2A.19 PDF [298] CSV [299])
Table 2A.21 shows the diskectomy procedure trend in the United States from 1996 to 2013. It may seem surprising that the number is fairly stable given the population increase and the change in aging of the population. This is a reflection of the fact that more and more of these procedures are done in the outpatient setting and therefore not captured by the inpatient National Hospital Discharge Survey. (Reference Table 2A.21 PDF [304] CSV [305])
Persons aged 45-64 years self-report the presence of back and neck pain during a previous 3-month period in the highest numbers, at almost 27.9 million cases. Although a smaller number due to the smaller population cohort, when comparing the prevalence of all back pain, age groups 45-64 years and 65 years and older are almost identical, roughly 39% of each age group. (Reference Table 2A.1 PDF [158] CSV [159])
Healthcare visits for back disorders to doctors, emergency departments, outpatient clinics, and hospital discharges show a steady rise as the population ages up to 64 years. After that, it drops slightly. Older persons with back pain disorder are more likely to be hospitalized than are younger persons, and to stay an average of 0.5 days longer than younger persons aged 18 to 64 years. Average charges for hospital stays with a diagnosis of back pain also increase with age. While the prevalence of neck disorders is significantly lower, aging also has a large impact on the number of healthcare visits for neck pain. (Reference Table 2A.2.2 PDF [176] CSV [177] and Table 2A.10.2 PDF [194] CSV [195])
Limitations of daily living due to chronic back pain increase in prevalence as the population ages. Back pain is listed as a cause of limitations by 6.4% of persons 65 and older, compared to 2.7% of the total population. Back pain represents the cause of limitations for roughly 1 in 5 persons with limitations due to any cause for both all persons and those age 65 and older (19.7% and 19.2%, respectively). (Reference Table 2A.11.2 PDF [248] CSV [249])
Back pain is a major health concern to older people. As the population ages, back pain becomes an increasing burden on the healthcare system.
 [307]
[307] Economic burden in The Burden of Musculoskeletal Diseases (BMUS) is based on data from the AHRQ Medical Expenditure Panel Survey (MEPS). The MEPS, which began in 1996, is a set of large-scale surveys of families and individuals, their medical providers (doctors, hospitals, pharmacies, etc.), and employers across the United States. MEPS collects data on the specific health services that Americans use, how frequently they use them, the cost of these services, and how they are paid for, as well as data on the cost, scope, and breadth of health insurance held by and available to US workers. Data reported in BMUS is based on three-year averages for each sequence of years.
Between the years 1996 to 1998 and 2012 to 2014, the number of persons in the population reporting a spine condition rose from 27.4 million to 34.9 million, but the proportion of total population with a spine condition (10.1% vs 11.0%) increased only slightly over the nearly two decades. However, distribution of the population with a spine condition, by age group, showed a consistent shift upward as the population ages, reflecting the overall aging of the US population. (Reference Table 8.12 PDF [145] CSV [146])
 [309]
[309] Healthcare treatments and visits contribute to the burden of spine conditions. Ambulatory physician visits, home health care visits, and hospital discharges all rose by 34%, 46%, and 28%, respectively, between the years 1996 to 1998 and 2012 to 2014. Mean visits for these three healthcare providers and share of spine patients using them remained relatively steady, indicating the primary reason for the increase is population growth. While still accounting for a relatively small number of visits, ambulatory non-physician care visits rose from 101 million in the earlier time frame to 220 million in the most recent years, an increase of 117%, due to both an increase of spine patients using this resource and a jump in mean visits.
However, prescription medications for spine conditions show the most dramatic rise, jumping from 353 million prescription fills to 789 million between the time frames, an average increase per year of 7.3% with a total increase of 123%. This increase was due primarily to the increase in mean number of refills per person, from 12.0 to 22.6, rather than the share of persons with a spine condition obtaining prescriptions, an increased share of only 3.5%. (Reference Table 8.2.2 PDF [310] CSV [311])
 [313]
[313]
Overall, ambulatory care visits (physician office visits, non-physician visits, and home health care visits) accounted for the largest share of per person direct cost for persons with a spine condition. At an average cost of $3,220 per person between 2012 and 2014, an increase of 82% from 1996 to 1998 in 2014 dollars, ambulatory care accounted for 36% of per person direct cost between 2012 and 2014. While the share of mean per person cost for inpatient care dropped from 36% to 25% between 1996 and 1998 and 2012 and 2014, the mean cost rose from $1,823 to $2,258 in 2014 dollars, an increase of 24%. At the same time, the average per person cost for prescriptions rose from $675 to $2,263, in 2014 dollars, an increase of 235%. (Reference Table 8.4.2 PDF [314] CSV [315])
 [317]
[317] Total direct per person healthcare costs for persons with a spine condition were $9,035, an increase of 80% since 1996 to 1998 based on 2014 dollars. Incremental direct per person costs, those costs most likely attributable to a spine condition, rose from $970 to $1,615, in 2014 dollars, an increase of 66%. (Reference Table 8.6.2 PDF [166] CSV [167])
 [319]
[319] Total aggregate direct costs for all persons with a spine condition were $315.4 billion in 2012 to 2014, a rise of 129% from the $13 billion in 1996 to 1998, in 2014 dollars. Incremental aggregate direct costs increased from $26.6 billion in 1996 to 1998 to $56.4 billion in 2012 to 2014, an increase of 112%. (Reference Table 8.6.2 PDF [166] CSV [167])
 [321]
[321]
Indirect costs associated with lost wages for persons ages 18 to 64 years are not calculated for persons with a spine condition. However, back pain is often cited as the reason for bed days and lost work days by persons in the labor force. In 2015, 4.9 million persons in the prime working ages of 18 to 64 years reported they are unable or limited in work at the time due to chronic back or neck problems. (Reference Table 2A.11.2 PDF [248] CSV [249])
Also, in 2015, 14.3% of the workforce age population reported an average of 7.8 bed days in the previous 12 months, for a total of 182 million bed days, due to chronic back or neck pain. In addition, 15.4% of this same population reported an average of 10.5 lost work days in the previous year due to chronic back or neck pain, or approximately 264 million work days lost due to back pain. (Reference Table 2A.13.1 PDF [256] CSV [257])
The financial cost associated with back pain is obviously enormous and, unfortunately, rising. At the current rate of increase, back pain treatment will quickly become unsustainable. Greater understanding of the underlying causes of back pain, ability to sub-classify patients based on accurate pain generators (eg, discogenic pain, facet mediated pain, radicular pain) and what factors lead to disability (ie, biological, psychological, or social) is needed to reduce this continually increasing trend. Ideally, understanding the variability of individual sources of and contributions to back pain could direct clinicians to specific treatments that best address the diagnosis.
The cost and difficulty of back pain research is also a major challenge. The complexity of back pain diagnosis and treatment options make high quality clinical research with meaningful results very difficult to fund and complete. This requires large scale multi-center trials with well-educated research staff and patients willing to stick with randomized modes of treatment. The latter consideration is often very difficult to obtain in a system where patients want immediate results. In addition, many non-surgical, non-pharmacological providers use a multimodal approach to care rather than an isolated intervention, complicating efforts to identify which treatment is most effective.
Adding to this challenge may be the subjective nature of pain. It is often very difficult, if not impossible, to separate psychological or emotional pain that is greatly influenced by the social environment from physiologic pain caused by a specific physical source. Differentiating between the two categories will play a tremendous role in our ability to treat patients in pain. Societal perceptions about back pain have been shown to lead to catastrophization, a common cognitive distortion extensively studied in psychology that is an irrational thought or belief that something is far worse than it actually is. Studies in pain patients have found catastrophization to be a significant factor in their disability and response to treatment.
System integration of historically fringe practitioners is a challenge as we attempt to grow effective non-surgical management strategies such as acupuncture, massage, tai chi, yoga, and chiropractic. Training practitioners to provide evidence-based informed care plans and appropriate referrals for other services or emergent conditions should start early in medical training. Improved graduate and post-graduate education which includes integrating educational tracks to better understand different disciplines of care and what they can offer can create a shared common base of critical thinking. For example, Denmark provides the first year medical school education to chiropractors and physicians jointly before diverging to more specific training.
Another challenge to the future is our healthcare financial system. Treatment decisions are too often made based on financial limitation rather than best clinical practice. Clinical decisions may be limited by insurance authorizations or treatment decisions, and could be influenced by highest reimbursement. Cost-effectiveness and risk/benefit discussions for alternative options are essential to providing successful treatments and reducing costs.
Understanding why the degenerative cascade causes pain in some, yet not in others, is needed to address the burden of pain and disability and the significant economic impact low back pain treatments create on healthcare resources each year.
One of the greatest unmet needs related to back pain is the ability to clearly diagnose the source of back pain. There are so many physical and non-physical sources of back pain that patients are often treated inappropriately before they are clearly diagnosed. Thousands of dollars are often spent on diagnostic evaluations without finding a clear source of back pain, a process that needs to be broken by earlier diagnosis, earlier definitive treatment, and maintenance of the ability to continue working.
Most patients with back and neck pain are treated non-operatively, often with alternative treatments, including such treatments as acupuncture, homeopathy, and massage. We know that enormous amounts of money are spent on many of these treatments, yet no quantifiable measures of cost or effect are yet available. Furthermore, the lack of information about treatments by chiropractors, physical therapists, and other care providers results in underestimated cost estimates for treatment of low back pain. There is also a lack of information on medical procedures done in offices or surgicenters, limiting estimates of cost and effectiveness of many interventional procedures, including many surgical procedures. These gaps in knowledge should be filled to obtain accurate estimates of the impact of back and neck pain on society.
As such, there remains debate regarding the most effective treatment for low back pain. Increased recommended alternatives to non-surgical options adds credence for improved informed consent, creating conversation about benefits and risks and leading to a better shared decision making process for the patient. Though research is limited, per Zaina et al, informing the patient of anticipated outcomes of not only surgery but other options is vital. In a systematic review performed by Zaina et al, the authors evaluated the effectiveness of different types of surgery compared with different types of non-surgical intervention in the treatment of low back pain secondary to lumbar spinal stenosis (LSS).1 The authors’ analysis demonstrated no differences in pain-related disability improvement between surgical (decompression with or without fusion) and non-surgical care. However, due to the low quality of available studies, the authors were unable to confidently recommend a preferable treatment method for symptomatic LSS.
To begin addressing these needs, there has been an increase in research on the efficacy of non-surgical interventions for low back pain. Ammendolia et al investigated the safety and effectiveness of epidural injections to other treatments for symptomatic LSS.2 Due to the low overall evidence (only 4 randomized controlled trials), the authors were only able to conclude that epidural injections provide improved pain, function, and quality of life for only up to 2 weeks.
Another area of increased interest is the effect of pre- and postoperative spinopelvic parameters (the relationship of the pelvic position to the spine) on treatment outcomes. Several previous investigations have described the magnitude of parameter correction afforded by surgical and non-surgical treatment modalities. However, many of these studies have featured small sample sizes and have rarely offered level I or II evidence. As such, there exists a need for large, prospective studies that investigate the true impact of influence of spinopelvic parameters on treatment outcomes for low back pain.
Acupuncture has been utilized in the treatment of low back pain for centuries, and has recently been established as a non-operative complimentary treatment in the United States.3 A meta-analysis evaluating the use of acupuncture in the treatment of low back pain demonstrated the use of acupuncture as a complimentary, highly cost-effective treatment.4 According to the World Health Organization (WHO) cost-effectiveness threshold values, the cost of complimentary acupuncture treatment was determined to be $48,562 per disability-adjusted life year (DALY) avoided. Interestingly, in patients where comorbid depression was also alleviated at the same rate as pain, the cost was revealed to be $18,960 per DALY avoided. The authors concluded that acupuncture, as a substitute for standard care, was most cost-effective when used in patients with comorbid depression.
As noted in the previous discussion of Indirect Costs [322], back pain was the cause of close to 264 million lost work days in a 12-month period during 2014-2015. In addition, over 4%, or 1 in 25, persons in the prime working ages of 18 to 64 report they are either limited in the type or amount of work they can do or are unable to work at all due to back pain. It is clear that back pain has a substantial impact on the workforce, and that finding ways to reduce or repair causes of back pain is needed. (Reference Table 2A.11.2 PDF [164] CSV [165])
In general, there is a need for high quality clinical research in treatment of low back pain. This includes addressing the lack of evidence for best practices for non-surgical active care approaches and surgical treatment. Additionally, work-related back pain has the potential to become "chronic" back pain, often with co-morbid dependence on narcotic pain medications. This process needs to be broken by earlier diagnosis, maintenance of ability to continue working, and earlier definitive treatment.
There is a need to promote a culture of "stopping back pain before it starts" by adopting spine care procedures, such as proper posture and balance exercise regimes, by persons of all ages as a counter to back pain. In addition to BMUS, the World Spine Care and Global Spine Care Initiative are coalitions all working to find ways to reduce back pain and back pain costs.
Back Pain (Lumbar and Low Back):
Back Disorders:
Ankylosing spondylitis and other inflammatory spondylopathies: 720*
Spondylosis and allied disorders: 721.2-721.9
Other and unspecified disorders of back: 724
Disk Disorders:
Displacement of intervetebral disc: 722.10, 722.11
Schmorl's nodes: 722.30-722.39
Degeneration of intervetebral disc: 722.51, 722.52, 722.60
Intervertebral disc disorder with myelopathy: 722.72, 722.73
Postlaminectomy syndrome: 722.80, 722.82, 722.83
Other and unspecified disc disorder: 722.90, 722.92, 722.93
Back Injury:
Closed fracture of vertebra without mention of spinal cord injury: 805.20-805.80
Closed fracture of vertebra with spinal cord injury: 806.20-806.90
Closed dislocation, vertebra: 839.20-839.49
Sprains and strains of sacroiliac region: 846
Other sprains and strains of back: 847.10-749.90
Cervical (Neck) Pain:
Neck Disorders:
Cervical spondylosis: 721.00, 721.11
Disorders of cervical region: 723.00-723.90
Disk Disorders:
Displacement of cervical intervertebral disc: 722.00
Degeneration of cervical intervertebral disc: 722.40
Intervertebral disc disorder, with myelopathy: 722.71
Postlaminectomy syndrome of cervical region: 722.81
Other and unspecified disc disorders of cervical region: 722.91
Neck Injury:
Closed fracture of cervical vertebra without mention of spinal cord injury: 805
Closed fracture of cervical vertebra with spinal cord injury: 806
Closed dislocation, cervical vertebra: 839
Neck sprain: 847.00
Spine Procedures (ICD-9-CM Procedures Code)
Cervical fusion: 81.02, 81.03
Thoracic fusion: 81.04, 81.05
Lumbar fusion: 81.06-81.08
Other fusion: 81.00, 81.01
Fusion/refusion multiple vertebrae: 81.62-81.64
Spine refusion: 81.30-81.39
Spinal decompression: 03.09
Spinal diskectomy: 80.50, 80.51
ICD-9-CM to ICD-10-CM CODE CONVERSION
Direct conversions between the ICD-9-CM codes used in this analysis to ICD-10-CM codes is difficult due to the greatly expanded diagnosis codes in ICD-10-CM. For example, converting the six codes included in the Lumbar/Low Back Back Disorders group returns only six general or unspecified codes related to the spondylopathies whereas, in reality, there are five major classifications (M45, M46, M47, M48, M49) each of which is broken down into specific conditions that are further broken down by site. For example, using only the M45 and M46 codes (shown below) there are 80 new codes.
M45 Ankylosing spondylitis
M45.0 Ankylosing spondylitis of multiple sites in spine
M45.1 Ankylosing spondylitis of occipito-atlanto-axial region
M45.2 Ankylosing spondylitis of cervical region
M45.3 Ankylosing spondylitis of cervicothoracic region
M45.4 Ankylosing spondylitis of thoracic region
M45.5 Ankylosing spondylitis of thoracolumbar region
M45.6 Ankylosing spondylitis lumbar region
M45.7 Ankylosing spondylitis of lumbosacral region
M45.8 Ankylosing spondylitis sacral and sacrococcygeal region
M45.9 Ankylosing spondylitis of unspecified sites in spine
M46 Other inflammatory spondylopathies
M46.0 Spinal enthesopathy
M46.00 …… site unspecified
M46.01 …… occipito-atlanto-axial region
M46.02 …… cervical region
M46.03 …… cervicothoracic region
M46.04 …… thoracic region
M46.05 …… thoracolumbar region
M46.06 …… lumbar region
M46.07 …… lumbosacral region
M46.08 …… sacral and sacrococcygeal region
M46.09 …… multiple sites in spine
M46.1 Sacroiliitis, not elsewhere classified
M46.2 Osteomyelitis of vertebra
M46.20 …… site unspecified
M46.21 …… occipito-atlanto-axial region
M46.22 …… cervical region
M46.23 …… cervicothoracic region
M46.24 …… thoracic region
M46.25 …… thoracolumbar region
M46.26 …… lumbar region
M46.27 …… lumbosacral region
M46.28 …… sacral and sacrococcygeal region
M46.3 Infection of intervertebral disc (pyogenic)
M46.30 …… site unspecified
M46.31 …… occipito-atlanto-axial region
M46.32 …… cervical region
M46.33 …… cervicothoracic region
M46.34 …… thoracic region
M46.35 …… thoracolumbar region
M46.36 …… lumbar region
M46.37 …… lumbosacral region
M46.38 …… sacral and sacrococcygeal region
M46.39 …… multiple sites in spine
M46.4 Discitis, unspecified
M46.40 …… site unspecified
M46.41 …… occipito-atlanto-axial region
M46.42 …… cervical region
M46.43 …… cervicothoracic region
M46.44 …… thoracic region
M46.45 …… thoracolumbar region
M46.46 …… lumbar region
M46.47 …… lumbosacral region
M46.48 …… sacral and sacrococcygeal region
M46.49 …… multiple sites in spine
M46.5 Other infective spondylopathies
M46.50 …… site unspecified
M46.51 …… occipito-atlanto-axial region
M46.52 …… cervical region
M46.53 …… cervicothoracic region
M46.54 …… thoracic region
M46.55 …… thoracolumbar region
M46.56 …… lumbar region
M46.57 …… lumbosacral region
M46.58 …… sacral and sacrococcygeal region
M46.59 …… multiple sites in spine
M46.8 Other specified inflammatory spondylopathies
M46.80 …… site unspecified
M46.81 …… occipito-atlanto-axial region
M46.82 …… cervical region
M46.83 …… cervicothoracic region
M46.84 …… thoracic region
M46.85 …… thoracolumbar region
M46.86 …… lumbar region
M46.87 …… lumbosacral region
M46.88 …… sacral and sacrococcygeal region
M46.89 …… multiple sites in spine
M46.9 Unspecified inflammatory spondylopathy
M46.90 …… site unspecified
M46.91 …… occipito-atlanto-axial region
M46.92 …… cervical region
M46.93 …… cervicothoracic region
M46.94 …… thoracic region
M46.95 …… thoracolumbar region
M46.96 …… lumbar region
M46.97 …… lumbosacral region
M46.98 …… sacral and sacrococcygeal region
M46.99 …… multiple sites in spine
and so on. Future analysis for BMUS will require identification of new categories for analysis of spine low back and neck diagnoses.
Conversion of the spine procedure codes was made and can be viewed by clicking HERE [323]. Again, the number of codes is greatly expanded, with more than 650 new codes representing the 25 spine procedure codes analyzed in this Fourth Edition of The Burden Of Musculoskeletal Diseases in the United States.
A normal spine is structurally balanced for optimal flexibility and has gentle front-to-back inward and outward curves that work in harmony to keep the body’s center of gravity aligned over the hips and pelvis. The cervical spine (neck) and lumbar (lower) spine both have a lordosis, an inward or concave curve, while the thoracic (middle) spine has a kyphosis, an outward or convex curve. Together these curves form a gentle S.
Spinal deformity is caused by abnormal curvature of the spine putting it out of alignment. When the abnormal curvature is seen from the side (a front-to-back imbalance) it is called sagittal imbalance, and includes the conditions of kyphosis, lordosis, and spondylolisthesis resulting in flatback syndrome and chin-on-chest or dropped head syndrome. When seen from the back (a side-to-side imbalance) it is called scoliosis. While scoliosis can be caused by conditions such as cerebral palsy, muscular dystrophy, and a broad spectrum of conditions (acquired or secondary scoliosis), the cause of most scoliosis is unknown (idiopathic scoliosis). Spinal deformity affects individuals in every age and demographic group, but the prevalence increases with age as many causes are affected by degenerative conditions.
Spinal deformity has a significant and measurable impact on health-related quality of life, including pain, function, self-image, mental health, work status, and disability. Prevalence of disease, utilization of healthcare resources, impact of disease on health-related quality of life, and cost of care are useful tools for measuring the burden of deformity on our population and on our healthcare economy. The purpose of this chapter is to provide information on the burden of spinal deformity on patients and on our healthcare system.
Adult spinal deformity is a broad diagnostic classification that includes idiopathic scoliosis as well as de novo or degenerative curves, which often result in coronal and/or sagittal plane decompensation. Sagittal plane malalignment is an increasingly recognized cause of pain and disability.1
The prevalence of spinal deformity has been reported at a wide range depending on the type of deformity and age. Congenital scoliosis has been reported at 100 in 100,000 persons,2 with acquired deformity as high as 68,000 in 100,000 persons.3 (Reference Table 2B.1.0 PDF [324] CSV [325])
Conditions related to the spine and spinal deformity often sound similar but affect the spine in different ways. Key conditions discussed in this section include the following.
Curvature of the spine: Spine curvature can refer to two distinct conditions. The human spine normally curves, but more commonly the term "spinal curvature" refers to abnormalities from the standard spinal.
• Idiopathic: Of unknown cause. Any disease that is of uncertain or unknown origin may be termed idiopathic; usually associated with children who develop an abnormal curvature at a young age.
• Acquired: Curvature that develops over many years, usually associated with adults and older persons.
• Secondary: Curvature caused by another condition, such as osteoporosis.
Sagittal imbalance: Deformity where loss of the normal lordosis of the lumbar spine or increased kyphosis of the thoracic and thoracolumbar spine causes the torso and head to pitch forward relative to the hips and pelvis. Loss of lordosis in the lumbar spine is also known as flat back syndrome.
Scoliosis: Side-to-side abnormal curvature of the spine.
Spondylolisthesis: Forward movement of one vertebra in relationship to a vertebra below it.
Spondylosis: Degeneration of the disc spaces between the vertebrae. Spondylosis is common with aging and affects virtually everyone to some degree after the age of 60 years. When severe, it can cause local pain and decreased range of spinal motion, requiring pain and/or anti-inflammatory medications.
Stenosis: A narrowing of the open spaces within the spine, which can put pressure on the spinal cord and the nerves that travel through the spine. Spinal stenosis occurs most often in the neck and lower back.
Kyphosis: An abnormal, convex curvature of the spine, with a resultant bulge at the upper, middle or lower back.
Spinal fractures:
• Traumatic spine fractures (TF): High-energy fractures resulting from accidents, falls, and sports.
• Vertebral compression fractures (VCF): Low-energy fractures in the aging as a result of reduced bone density and strength (osteoporosis and osteopenia).
Spinal infection:
• Tuberculosis of spine: An infection that usually occurs in the lungs, but can also occur in the spine, resulting in destruction of the intervertebral disk space and adjacent vertebral bodies. It is more common in children and young adults.
• Intraspinal abscess: A collection of pus and infectious material in the spine.
• Osteomylitis: A bone infection normally caused by bacteria but sometimes by fungus. The infection can occur in any bone but typically affects the arms, legs, spine, and pelvis. The bacteria usually reach the bone from an injury or wound. It can be either acute, where symptoms of pain, swelling, and fever last only a few months, or chronic.
• Discitis: Infection exists in the small spaces between these bones (the intervertebral disc spaces), which puts pressure on the discs and causes pain. Discitis is relatively uncommon and mostly affects young children.
• Postoperative infections: Infections after surgical procedures (operations) can cause pain, poor wound healing, need for further treatment including antibiotics, longer hospital stays, and increased healthcare costs.
Complications of surgery: Common surgery complications, including excessive blood loss, pain, infection, neural injury, anesthesia effects, blood clots, and other medical complications (heart attack, stroke).
Spondylopathies: Any disease of the vertebrae or of the spinal column.
Surgical procedures: Often performed to reduce pain and deformity from spinal curvature including osteotomies ( complete or partial removal of the vertebral bodies), spinal instrumentation, and fusion.
• Spinal fusion: A surgical procedure in which two or more vertebrae are permanently joined into one solid bone with no space between them.
• Osteotomies: A surgical procedure in which a portion of the vertebral body is removed to help restore the normal alignment of the spine. The procedure is utilized to reduce the amount of kyphosis or increase lordosis.
The normal spine viewed from the side forms a gentle "S" shape. When viewed from the back, the normal spine appears straight. The naturally occurring soft curves of the spine are designed to distribute mechanical stress in the body when at rest and during movement. When the curvature is even slightly abnormal, a person may experience occasional mild or annoying discomfort. If the curve is severely abnormal, the pain is usually severe and accompanied by disability. Scoliosis occurs in both children, where it is generally idiopathic, and adults, where it is often acquired.
In 2013, there were nearly 2 million healthcare visits with a diagnosis of scoliosis, the majority of which 1.3 million were to a physician’s office. However, 166,600 hospital discharges had a scoliosis diagnosis. The number of hospital discharges with a scoliosis diagnosis has remained relatively steady for five years (2010 thru 2014) and represents approximately 56 persons in every 100,000 US population. Females accounted for three out of four (73%) of healthcare visits with a scoliosis diagnosis. (Reference Table 2B.2.0 PDF [326] CSV [327] and Table 2B.2.1 PDF [328] CSV [329])
 [331]
[331] Spinal deformity and scoliosis can be found at birth due to genetic causes, develop during childhood, or occur late in life because of degenerative disc and joint disease. Common signs of scoliosis are a prominent shoulder or shoulder blade, or chest wall asymmetry. Another sign is uneven hips, with one hip seemingly higher than the other hip. It is important not to confuse scoliosis with poor posture and to realize that scoliosis will usually not disappear with age. Despite the severity of these conditions and the impact they have on the lives of children, the prevalence of spinal deformities in children under the age of 18 years is difficult to determine because of relatively low numbers and the degree to which the condition manifests initially in pain or disability. Estimated prevalence of spinal deformity conditions has been cited in numerous studies, and ranges from 0.4 in 1,000 for infantile idiopathic scoliosis1 to 2.5 in 1,000 for adolescent idiopathic scoliosis.2 (Reference Table 2B.1.0 PDF [324] CSV [325])
There are several different types of scoliosis. The most common type of scoliosis is idiopathic, meaning the cause is unknown. Approximately 80% to 85% of scoliosis cases are idiopathic.3 Idiopathic scoliosis can occur as early as the first three years of life, which is known as infantile idiopathic scoliosis. If diagnosed between the ages of 4 to 10 years, it is known as juvenile idiopathic scoliosis, and from 10 years of age to skeletal maturity, as adolescent idiopathic scoliosis. The term “early onset scoliosis” (EOS) is also used to describe scoliosis that occurs prior to 10 years of age. Adolescent idiopathic scoliosis is the most common type.
Scoliosis, if severe enough (>25°), is usually treated with bracing if the child is growing or with surgery if the curvature is more severe (>45° to 50°). The standard radiograph measurement method for all forms of scoliosis is the Cobb angle measurement technique, measured from the end plates of the maximally tilted end vertebral bodies in a standing radiograph.4 Whether the curve is >25° or >40° to 45°, the treatment is preventative in nature, helping to avoid progression of the curve and more significant future problems that might occur if it was left untreated. Increased mortality has been reported in untreated early onset scoliosis due to respiratory conditions.5 While this preventative aspect is hugely valuable and intuitively important, its benefit is difficult to measure from a public health standpoint, especially for rare conditions of childhood such as juvenile and adolescent pediatric scoliosis.
 [333]
[333] Infantile scoliosis occurs in patients 0-3 years old and currently accounts for less than 1% of all cases of idiopathic scoliosis in the United States. Boys are affected by infantile idiopathic scoliosis at a higher rate than girls (3:2 ratio).1 Infantile scoliosis curves tend to be left-sided (75% to 90%). Past studies have indicated this rare type of scoliosis occurs more frequently in Europe than in North America.6
Treatment for patients with infantile idiopathic scoliosis is determined by anticipated or actual curve progression. Several common measurement techniques are used, with angles ≤20° generally considered at low risk for progression. In addition to measuring the Cobb angle, the rib-vertebra angle difference (RVAD) is used as a common predictor of curve progression.7 Patients with a Cobb angle of ≤25° and a RVAD of ≤20° are at a low risk for progression and should be re-evaluated every 4 to 6 months.1
Nonsurgical treatment, such as bracing or casting, is initiated if a curve progression of ≥10° occurs. Surgical treatment should be considered when nonsurgical measures, including both bracing and casting, are not successful. Surgical treatment is utilized when a curve is ≥45° and progressive in an immature child.1 Overall, surgical methods are continually evolving, with the goal of obtaining and maintaining curve correction while simultaneously preserving or encouraging spinal and trunk growth.
Surgical options currently utilized include various types of spinal fusion or hemiepiphysiodesis, a minimally invasive implant procedure to slow progression of curve growth. Additional techniques include growing-rod instrumentation (rods that expand and support the deformed spine) and vertical expandable (telescoping) prosthetic titanium rib (VEPTR) instrumentation.8 The goal of using surgical methods is to halt the progression of the curve and gain correction of the deformity, while allowing maximum growth of the spine, lungs, and thoracic cage.1 The allowance of normal lung development is one of the critical factors in recommending treatment for infantile and juvenile idiopathic scoliosis. Prevention of early mortality due to respiratory failure is a key driver of surgical treatment of early onset scoliosis.1,5
In 12% to 21% of idiopathic scoliosis cases, the diagnosis is made between 4 and 10 years of age. Between the ages of 4 and 6 years, the female-to-male ratio of juvenile idiopathic scoliosis is 1:1. However, the ratio of female to male cases rises to between 2:1 and 4:1 in children between the ages of 4 and 10 years, and to 8:1 in children who are 10 years of age or older.9 Both right and left curves are found with equal frequency for patients younger than 6 years, but rise to a 3:1 ratio of right versus left thoracic curves after the age of 6.10
Observation is the main treatment for patients with a small curve of less than 20° to 25°. Follow-up visits are recommended every 4, 6, 9, or 12 months, depending on the patient’s age, the degree of the curve, and the characteristics of the clinical deformity.9
Curves between 25° and 50° are usually treated with bracing in this age group. Bracing can be done either on a part- time or full-time basis, depending on the size of the curve as well as the age of the child. A study completed in 1982 evaluating the success of bracing reported an excellent prognosis when part-time bracing was utilized for patients with a curve of ≤35° and RVAD11 of ≤20°; however, curves ≥45° and RVAD of ≥20° had a less favorable prognosis for successful treatment with bracing.9
Overall, the curve patterns in patients with juvenile idiopathic scoliosis are similar to those with adolescent idiopathic scoliosis. Approximately 70% of patients with juvenile idiopathic scoliosis exhibit curve progression and require some form of treatment. In a study conducted in 1981, 55 of 98 patients (56%) with juvenile idiopathic scoliosis required spinal surgery. The most common and traditional surgery is posterior instrumentation and fusion.9
According to the Scoliosis Research Society (SRS), idiopathic scoliosis is diagnosed when a patient has asymmetry on forward bending combined with a curve of at least 10°.12 By this definition, the prevalence of adolescent idiopathic scoliosis in children from 11 to 18 years of age is 2% to 3%. Though the male-to-female ratio for smaller curves is about equal, larger curves seem to be more common in females. Similar results were found in a study conducted in 1985, where 29,195 children were screened for idiopathic scoliosis.2
 [335]
[335] Several studies have investigated the natural history and natural course of curve progression in adolescent idiopathic scoliosis. All report the strongest predictive factors in the development of idiopathic scoliosis are age, magnitude of curve, and gender.13,14,15,16 Girls are more likely to have adolescent idiopathic scoliosis than boys, and some studies report the onset is earlier in girls than boys. A factor highly correlated with curve progression is age at diagnosis; patients diagnosed at a younger age have a greater risk of curve progression. However, those diagnosed at a younger age seem to have a more favorable response to milder forms of treatment, which supports the practice of school screening to detect and lead to earlier diagnosis for those children who exhibit a smaller degree of curvature.
Treatment decisions for individuals with adolescent idiopathic scoliosis are made based on location, shape, pattern, and cause of the curve. The treatment choice is also a function of the patient’s future growth potential. Treatment choices include observation, bracing, and surgery. Observation is usually reserved for patients who have curves ≤25°. Bracing, which is used to stop curve progression (rather than for lasting correction of the curve), is usually used for patients who have curves ≥25° and who are still growing. Surgery is generally used for patients with curves ≥45°.
Congenital scoliosis is believed to affect approximately one child for every 1,000 live births.17 The cause is unknown in most cases, but in some cases, it is associated with various syndromes, as shown in the illustration below. Diagnosis occasionally is made during prenatal ultrasound. In cases of congenital scoliosis, additional congenital conditions, such as chest wall malformation or kidney or heart abnormalities, are often present. Treatment options for congenital scoliosis are bracing and/or surgery and are similar to treatments discussed for idiopathic scoliosis. Bracing is not as effective for congenital scoliosis as it is for idiopathic scoliosis.
 [337]
[337] Major abnormal spinal deformity occurring during infancy or early childhood poses a clinical problem because of the anticipated long growth period (at least 10 years), variable presentation and treatment methods, and the length of time that must pass before meaningful outcome results can be assessed in the small number of patients for definitive studies. Curves that result from congenital scoliosis are often not treated as easily as idiopathic curves because the deformity is in the bones rather than the soft tissue, causing the curve to be rigid.18
Scoliosis also occurs in conjunction with several congenital conditions that occur in infancy or childhood. These include muscular dystrophy, cerebral palsy, spina bifida, and spinal muscular atrophy. Scoliosis associated with these conditions is referred to as neuromuscular scoliosis. Both the likelihood and the severity of the scoliosis generally increases with the severity of the underlying condition. For example, a child with severe cerebral palsy who is unable to walk is more likely to have severe scoliosis than a child with mild cerebral palsy who can walk.
Because of the low prevalence of scoliosis in children and adolescents, it is difficult to analyze the healthcare impact on the US healthcare system from this condition. However, the impact of scoliosis over a lifetime due to pain, inability to work, and cost to the healthcare system are substantial.
In 2013, one in three (35%) healthcare visits with a diagnosis of scoliosis was for a person under the age of 18. Most visits, 93% of the 681,100, were classified as idiopathic scoliosis. The majority (93%) of all visits with a diagnosis of scoliosis by persons under age 18 were outpatient visits to either an outpatient clinic or physician office. Only 3.5% represented hospital discharges; however, this still accounted for 23,800 discharges for this often painful condition in children and adolescents. (Reference Table 2B.2.2 PDF [341] CSV [342])
 [344]
[344] In 2013, 40% of children and adolescents under the age of 18 years discharged from the hospital with a diagnosis of scoliosis had surgery. Spinal fusion was the most common surgery performed (36.1%), followed by incision/excision (24.6%), and deformity monitoring (9.6%). One in seven (15%) also had a blood transfusion. (Reference Table 2B.5.2 PDF [345] CSV [346])
 [348]
[348] Average hospital charges for patients under 18 years of age with a scoliosis diagnosis in 2013 were five times the average charge for all hospitalized patients in this age group ($113,800 versus $22,400), even though the length of stay was only about 50% longer (6.4 days versus 3.9 days). The high number of surgical procedures likely accounted for some of this variance. The length of stay and mean charges were slightly higher for those with an acquired/secondary scoliosis diagnoses than for those with an idiopathic scoliosis diagnosis. (Reference Table 2B.3.2 PDF [349] CSV [350])
 [352]
[352]  for Persons Under 18 Years of Age with a Scoliosis Diagnosis, United States 2013") [354]
[354] Young people under the age of 18 with scoliosis are four times more likely to be transferred to a long-term care facility and three times more likely to have home healthcare than peers discharged for any diagnosis although the rates are still lower than among older persons (3% and 9%, respectively). (Reference Table 2B.4.2 PDF [355] CSV [356])
Deformity of the adult spine includes patients with curvature of the spine (scoliosis) of varying degrees caused or impacted by degenerative disc and joint disease. Adult scoliosis may be the result of persistent or progressive deformity since adolescence or a new, de novo, onset of deformity resulting from degeneration or aging of the spine. Degenerative scoliosis accounts for most scoliosis cases in older populations aged 65 years and older, as reflected in the low proportion of older patients with a diagnosis of primary idiopathic scoliosis.
Degenerative scoliosis is one of the most challenging spine conditions to treat because of the variability of the condition. Generally, it is thought to originate with the degeneration of the intervertebral discs, which leads to misalignment of the vertebral column. Degenerative scoliosis, particularly in the very elderly, is often associated with other conditions, such as osteoporosis. Treatment outcomes for both nonsurgical and surgical procedures are not well documented; hence, recognition and earlier intervention are important to ward off the more complex problems of adult scoliosis. The role played by undiagnosed, mild idiopathic adolescent scoliosis on the development of degenerative scoliosis in later life is unknown.
The clinical presentation and management of adults with scoliosis is characterized by a great deal of variability. There is a poor correlation between the magnitude of deformity and the impact of scoliosis on health status, as patients with large spinal curvatures may have limited pain and disability and patients with relatively mild deformity may be severely impaired. Deformity in the sagittal plane is associated with disability more than scoliosis.1 Patients with adult scoliosis seek medical care for symptoms, including back pain, neural symptoms, and progression of deformity. It is often neural symptoms secondary to spinal stenosis that leads patients to seek treatment.
The prevalence of adult spinal deformity and scoliosis is not well established, with estimates ranging from 2.5% to 25% of the population.2,3,4,5,6,7 A 2005 study reported mild to severe adult scoliosis prevalence as high as 68% in a healthy (no known scoliosis or spine surgery) population aged 60 years and older.8 Many cases of degenerative scoliosis are undiagnosed, but elderly patients often seek care because of back and leg pain that may be caused by scoliosis and associated spinal stenosis.
According to 2010 US Census Population Estimate, there were 235,205,658 people in the United States over the age of 18 years. Prevalence of adult scoliosis cited in the literature ranges from 2.5% to 60%, depending on severity. A conservative estimate (2.5%) of the prevalence of adult scoliosis yields an incidence of a minimum of 5.88 million adults in the United States with adult scoliosis. In 2013, an estimated 1.28 million of these adults received treatment either as an inpatient or on an outpatient basis. (Reference Table 2B.2.2 PDF [341] CSV [342])
 [358]
[358] The management of adult scoliosis includes nonsurgical and surgical resources. Nonsurgical treatments of adult scoliosis utilize significant resources, and include interventions such as exercises, physical therapy, injections, pain medications, and manual manipulation.9 Data on nonsurgical treatments is not available; however, a 2010 nonrandomized study reported that two years of nonsurgical treatment in adult scoliosis patients resulted in substantial expenditures and yielded no improvement in health status.10
Operative management of scoliosis in the adult encompasses a spectrum of procedures, including decompression alone, decompression with limited fusion, and fusion of the deformity. The type of procedure performed is typically determined by the predominant symptoms. Neural symptoms in patients with smaller curves (<30 degrees) are treated with decompression alone, while patients with larger curves and neural symptoms are treated with decompression and fusion.11 Adult scoliosis associated with sagittal deformity is more commonly treated with decompression, osteotomies, and larger fusions of greater than four level (five or more vertebrae).12
In 2013, a query of the Healthcare Costs and Utilization Project (HCUP) Nationwide Inpatient Survey (NIS) resulted in approximately 142,600 hospitalizations of people age 18 and over associated with a discharge diagnosis of scoliosis (ICD-9-CM of 373). The majority of these, or 140,200 patients, were diagnosed as idiopathic scoliosis or scoliosis of unknown cause. Hospitalization with a scoliosis diagnosis was higher among the elderly, with those 65 and older accounting for nearly half (43%) among all ages. Females accounted for nearly three-quarters (73%) of all scoliosis hospitalizations. Race/ethnicity and region in the US did not show significant differences. (Reference Table 2B.2.1 PDF [328] CSV [329], Table 2B.2.2 PDF [341] CSV [342], Table 2B.2.3 PDF [359] CSV, [360] Table 2B.2.4 PDF [361] CSV [362])
In 2013, more than one-half (53.6%) of patients with a diagnosis of acquired/secondary scoliosis had a surgical procedure, but only one in five (20.7%) of those with a diagnosis of idiopathic scoliosis had surgery. The most common procedure performed on scoliosis patients was spinal fusion, with 26,600, or 16%, having this procedure. A majority of scoliosis patients with a fusion procedure (83%) had fusion of 4 or more levels. Sex of the patient was not a factor in having a procedure, but persons age 45 to 64 were most likely to have a procedure. (Reference Table 2B.5.0.1 PDF [363] CSV [364], Table 2B.5.0.2 PDF [365] CSV [366], Table 2B.5.1 PDF [367] CSV [368], Table 2B.5.2 PDF [345] CSV [346])
 [370]
[370] The cost of care for adults with scoliosis includes direct costs and indirect costs of lost wages, time away from work, cost of care providers, and opportunity costs. Estimates of the direct costs of nonsurgical care in adult scoliosis are estimated to be as high as $14,000 per year.10 The national mean cost of a hospitalization, including surgical treatment, for patients with a primary diagnosis of idiopathic scoliosis was $69,400 in 2013 for an average hospital stay of 5.3 days. The mean cost for those with an acquired or secondary scoliosis diagnosis were significantly higher at $120,400 per discharge, with an average stay of 5.9 days. The HCUP NIS database does not provide hospitalization costs associated with secondary discharge diagnoses, and does not include fees to doctors, tests, and other typical charges associated with hospitalization. Therefore, the most conservative estimate of only the hospitalization cost for adult scoliosis, both idiopathic and acquired/secondary in 2013 was an estimated $11.5 billion (166,600 hospitalizations). Charges are not necessarily actual costs paid. Mean charges for scoliosis diagnosed patients are significantly higher than for all hospital discharge patients. (Reference Table 2B.3.2 PDF [349] CSV [350])
 for Persons 18 Years of Age and Older with a Scoliosis Diagnosis, United States 2013") [372]
[372]
In 2013, slightly more than one-half (58%) of patients with a scoliosis diagnosis were discharged to home, while 70% of patients with any diagnosis had a routine discharge. Patients with a scoliosis diagnosis are more likely to be transferred to a skilled nursing or intermediate care facility (long-term care) than are patients with all diagnoses. This is particularly true for the elderly population, with 39% of persons age 65 and older with a scoliosis diagnosis moving to a long-term care facility. (Reference Table 2B.4.2 PDF [355] CSV [356])
 [374]
[374]
The real cost of the management of adult scoliosis to our healthcare system is significant, and the value of care measured by change in health status remains incompletely defined for both nonsurgical and surgical care.
Recent emphasis has been placed on sagittal plane balance and restoring normal sagittal alignment with regards to the three dimensional deformity of adult spinal deformity (ASD), and is a primary condition leading to the high prevalence (68%) of persons age 60 and over with adult spinal deformity.1,2 The impact of sagittal plane alignment on the treatment of spinal disorders is of critical importance. A failure to recognize malalignment in this plane can have significant consequences for the patient not only for pain and deformity, but also social interaction due to deficient forward gaze. A good understanding of the principles of sagittal balance is vital to achieve optimum outcomes when treating spinal disorders. Even when addressing problems in the coronal plane (front from back), an awareness of sagittal balance is necessary to avoid future complications.3
Sagittal plane deformity presents as an exaggeration or deficiency of normal lumbar lordosis (inward curving of the lumbar spine just above the buttocks) or kyphosis (exaggerated curvature of the upper (thoracic) spine). There are variations on the degree of normal curvature, still this shape allows equal distribution of forces across the spinal column. It is the disruption of this equilibrium by pathological processes or, as in most cases, ageing that results in deformity. This leads to adaptive changes in the pelvis and lower limbs. The effects of limb alignment on spinal posture are well documented. Changes in pelvic posture also affect spinal alignment.3
 [376]
[376]
A lordosis deformity is usually iatrogenic (illness or condition caused by medication or treatment), and often follows lumbar fusion, thoracolumbar fusion, and, in some cases, lumbar decompressive procedures. Nonsurgical causes include ankylosing spondylitis, degenerative changes, or adult presentation of adolescent idiopathic scoliosis. The deformity may lead to neurogenic radicular symptoms secondary to stenosis, paraspinal muscular fatigue, and low back pain. Nonoperative treatment options fail for most patients. Surgical interventions are aimed at restoring lumbar lordosis, which is typically accomplished with revision decompression, fusion, and various osteotomies.4
Kyphosis is often secondary to inflammatory, degenerative, or post- traumatic disorders, and can be caused by poor posture, slouching, osteoporosis, birth defects, or disease. They may also be secondary to infection or tumors. There is usually pain and functional disability along with concerns about self-image and social interaction due to inability to maintain a horizontal gaze. The resultant pelvic and lower limb posture is an attempt to restore normal alignment. Addressing this complex problem requires detailed expertise and awareness of the potential pitfalls surrounding its treatment.1
Increasingly positive sagittal imbalance has been shown to correlate with poor functional outcome and poor self-image along with poor psychological function. Restoring normal spinopelvic alignment is paramount to the treatment of complex spinal deformity with sagittal imbalance. Understanding of whole spinal alignment and dynamics of spinopelvic alignment is essential to restore sagittal balance while minimizing the risk of developing sagittal decompensation after surgical intervention.1,3
The goal of sagittal deformity management is to maintain the body in an energy-efficient, ergonomically favorable erect position. The larger the deviation from a balanced alignment, the more energy an individual uses to stand upright without external suport. Patients with symptomatic sagittal plane deformity often present with a sagittal balance at the periphery of this balanced alignment, leading to an increased effort of accessory musculature to maintain the head over the pelvis. This leads to fatigue and pain, especially with prolonged activity. As sagittal imbalance progresses, different compensatory mechanisms such as the pelvic retroversion, hip extension, and knee flexion are used in order to restore and maintain sagittal balance. Once a spinal deformity surpasses these compensatory mechanisms surgical intervention is often requested.5
Operative management of sagittal deformity in the adult encompasses a spectrum of procedures with fusion the most common. In 2013, a query of the Healthcare Costs and Utilization Project (HCUP) Nationwide Inpatient Survey (NIS) resulted in approximately 190,500 hospitalizations associated with a discharge diagnosis of sagittal deformity. The largest share (76%), or 144,600 patients, were diagnosed with spondylolisthesis. Hospitalization with a sagittal deformity diagnosis was higher among the elderly, accounting for more than one-half (54%) among all ages for those 65 and older. Females accounted for 69% of all sagittal deformity hospitalizations. Race/ethnicity and region in the US did not show significant differences. (Reference Table 2B.2.1 PDF [328] CSV [329], Table 2B.2.2 PDF [341] CSV [342], Table 2B.2.3 PDF [359] CSV [360], Table 2B.2.4 PDF [361] CSV [362])
 [378]
[378] In 2013, more than nearly three-fourths (72.3%) of patients with a diagnosis of sagittal deformity had a surgical procedure. A diagnosis of spondylolisthesis had the highest rate (84.6%) of surgical procedure. The most common procedure performed on sagittal deformity patients was spinal fusion, with 67.4%, having this procedure. More than one-half (56%) had fusion of less than four levels. Sex of the patient was not a factor in having a procedure, but persons age 45 to 64 were most likely to have a procedure. (Reference Table 2B.5.0.1 PDF [363] CSV [364], Table 2B.5.0.2 PDF [365] CSV [366], Table 2B.5.1 PDF [367] CSV [368], Table 2B.5.2 PDF [345] CSV [346])
 [380]
[380] Sagittal balance is an independent predictor of clinical outcomes in spinal care. Surgical treatment is challenging and jeopardized by frequent complications. Guidelines for surgical treatment are currently not based on a classification of the disease. A comprehensive classification of sagittal balance based on regional deformities and compensatory mechanisms combined in deformity patterns is proposed. Though the sagittal shape of the spine can change due to degeneration or trauma, correlations between sagittal shape parameters and pelvic incidence (PI) have been described. PI is not changed by degeneration, thus representing a permanent source of information on the original sagittal shape of the spine.6
The national mean cost of a hospitalization, including surgical treatment, for patients with a primary diagnosis of sagittal imbalance was $94,500 in 2013 for an average hospital stay of 4.3 days. The HCUP NIS database does not provide hospitalization costs associated with secondary discharge diagnoses, and does not include fees to doctors, tests, and other typical charges associated with hospitalization. Therefore, the most conservative estimate of only hospital charges for adult sagittal imbalance in 2013 was an estimated $18.0 billion (166,600 hospitalizations). Charges are not necessarily actual costs paid. Mean charges for sagittal imbalance diagnosed patients are significantly higher than for all hospital discharge patients. (Reference Table 2B.3.2 PDF [349] CSV [350])
 for Persons with a Sagittal Deformity Diagnosis, United States 2013") [382]
[382] In 2013, slightly more one-half (56%) of patients with a sagittal imbalance diagnosis were discharged to home, compared to 70% of patients with any diagnosis. Patients with a sagittal imbalance diagnosis are more likely to be transferred to a skilled nursing or intermediate care facility (long-term care) than are patients with all other diagnoses. This is particularly true for the elderly population, with 36% of persons age 65 and older with a sagittal imbalance diagnosis moving to a long-term care facility. (Reference Table 2B.4.2 PDF [355] CSV [356])
 [384]
[384] The real cost of the management of adult sagittal imbalance to our healthcare system is significant, and the value of care measured by change in health status remains incompletely defined for both nonsurgical and surgical care.
Spinal deformity can be caused by congenital conditions and due to aging wear and tear on the back. Medical conditions and poor bone quality may also contribute to spinal deformity, however, in many cases the cause remains unknown.
Several conditions known to contribute to spinal deformity were examined as cross diagnoses with spinal deformity at the time of a healthcare visit. The most frequent diagnosis with one in ten (9.3%) hospital discharges and a scoliosis diagnosis was congenital spinal disorders. Four other conditions – trauma/spinal fractures, spinal infections, spondylopathies, and complications of surgery – were found in less than 2% of scoliosis and between 2% and 4% of sagittal imbalance hospital discharge diagnoses. Looking at all healthcare resources, the cross-diagnosis of spinal deformity and a contributing cause dropped to 0.3% among scoliosis discharges and 0.2% among sagittal imbalance visits. (Reference Table 2B.6.0 PDF [385] CSV [386])
 [388]
[388] Several studies have examined the relationship between spinal deformity and contributing causes, but until identification of multiple conditions is made, no clear relationship can be established.
The burden of spinal deformity includes healthcare costs, pain management, therapy, alternative care, and lost workdays due to pain. The total cost of spinal deformity is difficult to determine because hospital charges are the only expenditures available in the databases. In addition, not all persons suffering from spinal deformity seek medical care.
In 2013, charges for 357,000 hospital discharges for spinal deformity were $29.5 billion. Spinal deformity charges accounted for 2.1% of all hospital charges in 2013, but only 1% of hospital discharges. (Reference Table 2B.3.1 PDF [389] CSV [390])
In addition to direct and indirect costs, persons afflicted with spinal deformity experience a reduced quality of life, which may include major constraints on mobility and activity for those with the most serious conditions.
While technical outcomes of surgery are well known and show obvious benefits for those with significant deformity, long-term health related outcomes have yet to be precisely documented. The lack of quality, long-term studies of sufficient size hampers our understanding of the mortality and morbidity rates for patients with congenital and idiopathic scoliosis, with and without treatment. Fifty years of follow-up studies of children and adolescents with untreated scoliosis have shown conflicting results, with some studies indicating a higher risk of mortality and respiratory compromise.1,2
Another study shows compromise only in patients with early reduced lung function and a large curvature.3 Yet another study has shown no differences in untreated childhood scoliosis and a control group.4 Several articles from the 1960s and one recent article report that low back pain does not occur more frequently in untreated scoliosis patients than in the general population4,5,6 unless the curvature is greater than 40°.7,8 It has also been shown that persons treated with surgery rather than bracing for adolescent idiopathic scoliosis have less pain at 10- to 20-year follow-up, although function remains similar.9,10 The cosmetic/self-image aspect of scoliosis is obvious and important, and often a major factor affecting the lives of individuals with this condition.
Scoliosis in the adult has an impact that is similar to other common medical conditions including osteoarthritis, coronary artery disease, and chronic obstructive pulmonary disease. Overall, the burden of scoliosis on health-related quality of life is severe relative to other common medical conditions. With the aging demographic profile of the US, the burden of adult scoliosis is increasing and has a significant impact on the health of our population, and on the cost of care for spinal disorders.
Likewise, vertebral compression fractures, which may contribute to adult degenerative scoliosis, are also a growing concern for the aging population, particularly when associated with kyphosis and/or disabling pain.
With the sagittal profile of the spine, conventional thinking has been to categorize it into different segments based on the anatomical differentiation of the vertebrae. This delineation does not take into account the true surface contour of the spine. The disadvantage of this overly simplistic categorization is that when attempting to restore what is perceived as a ‘normal thoracolumbar spine,’ a ‘one size fits all’ approach is used.1
Increased understanding of sagittal plane deformity will lead to earlier identification. As the life expectancy of the population increases along with the patients desire to lead more active lives well into advanced years, so will the demand for appropriate expertise and skill in dealing with this complex problem. Spinal osteotomies remain complicated procedures. This treatment strategy must be the subject of specific training and must be practiced by specialist surgeons for the best outcomes.1
Curvature of Spine:
Idiopathic Scoliosis: 737.30-737.32
Acquired Kyphosis and Lordosis: 737.0, 737.10, 737.12, 737.19, 737.20-737.29, 737.34, 737.39
Secondary Scoliosis, Kyphosis, and Lordosis: 737.11, 737.33, 737.40-737.43, 737.8, 737.9
Spondylolisthesis: 737.40, 756.12
Adolescent Postural Kyphosis: 737.00
Kyphosis: 737.10-737.19, 737.41
Lordosis: 737.20-737.29, 737.42
Scoliosis: 737.30-737.39, 737.40, 737.43, 737.8, 737.9
Trauma: Spinal Fractures Contributing to Deformity:
Vertebral Compression Fractures: 805.00-805.08, 805.2, 805.4, 805.6, 805.8
Traumatic Fractures: 805.10-805.18, 805.3, 805.5, 805.7, 805.9, 806.00-806.09, 806.10-806.19, 806.20-806.29,806.30-806.39, 806.4, 806.5, 806.60-806.02, 806.69, 806.70-806.72, 806.79, 806.8, 806.9
Infection/Complications Codes:
Tuberculosis of Vertical Column: 015.00 to 015.06
Tuberculosis Unspecified: 015.90 to 015.96
Intracranial and Intraspinal Abscess (Epidural abscess): 324.1, 324.9
Acute Osteomyelitis: 730.00, 730.08, 730.09
Chronic Osteomyelitis: 730.10, 730.18, 730.19
Discitis: 722.90 to 722.93
Complications of Surgery: 996.2, 996.59, 996.63, 996.72
Spondylopathies:
Ankylosing Spondylitis: 720.00
Spinal Enthesopathy: 720.1
Sacroiliitis, not elsewhere classified: 720.2
Other Inflammatory Spondylopathies: 720.81, 820.89
Unspecified Inflammatory Spondylopathy: 720.9
Cervical Spondylosis with Myelopathy: 721.1
Thoracic or Lumbar Spondylosis with Myelopathy: 721.4
Spondylosis with Myelopathy, Thoracic Region: 721.41
Spondylosis with Myelopathy, Lumbar Region: 721.42
Intervertebral Disc Disorder with Myelopathy: 722.70 to 722.73
Spinal Stenosis in Cervical Region: 723.00
Cervicalgia: 723.1
Cervicocranial Syndrome: 723.2
Cervicobrachial Syndrome (diffuse): 723.3
Brachial Neuritis or Radiculitis NOS: 723.4
Torticollis, Unspecified: 723.5
Panniculitis Specified as Affecting Neck: 723.6
Ossification of Posterior Longitudinal Ligament in Cervical Region: 723.7
Spinal Deformity Procedures:
Decompression: 0309, 8050, 8051
Cervical Fusion: 8102, 8103
Thoracic/Dorsal or Dorsolumbar Fusion: 8104, 8105
Lumbar and Lumbosacral Fusion: 8106, 8107, 8108
Other Fusion: 8100, 8101
Cervical Refusion: 8132, 8133
Thoracic, Dorsal or Dorsolumbar Refusion: 8134, 8135
Lumbar and Lumbosacral Refusion: 8136, 8137, 8138
Other Refusion: 8130, 8131, 8139
Fusion/Refusion of Multiple Vertebrae: 8162, 8163, 8164
Instrumentation/Insertion of Spinal Device: 8451, 8452, 8459
Vertebraplasty: 8165
Kyphoplasty [Percutaneous Vertebral Augmentation]: 8166 Decompression: 0309
Diskectomy: 8050, 8051
Epidural injection: 8192, 8396, 8397
Arthritis is a term that is used for a diverse group of painful conditions affecting the joints and surrounding structures. Arthritis is among the leading conditions causing work limitations.1 Using the National Health Interview Survey (NHIS) for 2013-2015, the estimated number of adults with doctor-diagnosed arthritis (DDA), on average, was 54.4 million,2 and is projected to reach 78.4 million, or 26% of the adult population, by 2040.3 The estimated number of adults, on average, with arthritis-attributable activity limitation (AAAL) was 23.7 million,2 projected to reach 34.6 million, or 11.4% of all adults, in 2040.3 Estimating the prevalence and burden of the various disorders that comprise arthritis and other rheumatic conditions (AORC) is important to understanding the current and growing impact of these disorders on the health care and public health systems. Equally important is identifying the gaps in our understanding of these measures and targeting potential interventions.
 [392]
[392] Arthritis is a general term that specifies inflammation in a joint although the term is sometimes used more broadly to include conditions where evidence of inflammation may be limited. Arthritis is usually associated with symptoms of joint pain and can result in activity limitation. Therefore, the following pages will reflect arthritis and other related conditions in two approaches.
First, we use the categorization developed over the years by the National Arthritis Data Workgroup and the Arthritis Program at the Centers for Disease Control and Prevention (CDC). This approach to AORC, presented in Segment 1, focuses on nine of the most common forms of arthritis plus an all other category (click HERE [393] to view the AORC categorization) and is terminology familiar to the medical and research communities. For self-report survey data, a related definition of DDA is also used. This approach largely uses the self-reported DDA definition and the AORC definition, and frequently compares the estimates for the 10 AORC subtypes to overall AORC.
The second approach, presented in Segment 2, categorizes arthritis into terminology often used with patient populations to explain their joint pain or joint disease and provides a summary and additional depth on the most familiar arthritic conditions. Using the same base data tables, analysis in this approach focuses on arthritis disorders as a share of all healthcare disorders. Included at the end of this approach is a discussion of joint pain common to all arthritis disorders, and trends in joint replacement.
An overview of the main topics within each segment is shown below. To jump to the two segments, click on the title below.
Segment 1: Arthritis and Other Rheumatic Conditions (AORC) [394]
1 Prevalence of Arthritic Conditions
2 Healthcare Utilization
3 Burden of AORC
4 Economic Burden of AORC
5 Impact of Aging
6 Key Challenges to Future
7 Unmet Needs
8 AORC ICD-9-CM Diagnosis Codes
Segment 2: Joint Disease: Arthritis in Patient Populations [395]
1 Osteoarthritis
2 Inflammatory Arthritis
A Rheumatoid Arthritis
B Spondylarthropathies
C Mixed Connective Tissue Disorders
3 Gout
4 Joint Infection
5 Fibromyalgia
6 Juvenile Arthritis
7 Joint Pain and Joint Replacement
8 Disparities
9 Key Challenges to Future
10 Unmet Needs
11 Estimated ICD-9-CM & ICD-10-CM Crosswalk Codes
Disclaimer: The findings and conclusions in this chapter are those of the authors and do not necessarily represent the official position of the Centers for Disease Control and Prevention.
Arthritis and other rheumatic conditions (AORC) comprise over 100 diseases. What most of them have in common is that they cause pain, aching, stiffness or swelling in or around a joint.
Definitions
Defining AORC to assess the burden in a population requires considering both what is important to measure and what data sources are available, such as population surveys and administrative data. Complicating any definition is the 100+ conditions that comprise what is generally thought of as “arthritis.” Furthermore, population measures need to be relatively simple and perhaps different from definitions used in clinical practice, where there is the luxury of having a medical history, physical examination, and laboratory and radiographic data. The Centers for Diseases Control and Prevention (CDC) Arthritis Program has worked with other organizations to develop case definitions, based on the best available expertise, that allow many measures of population burden to be addressed in a consistent way.1
For self-reported population surveys, doctor-diagnosed arthritis (DDA) is defined as a “yes” answer to the question “Have you EVER been told by a doctor or other health professional that you have some form of arthritis, rheumatoid arthritis, gout, lupus, or fibromyalgia?” This measure aims to capture most of the major categories of arthritis and is considered valid for surveillance purposes of estimating population prevalence.2 For data sources using International Classification of Diseases, Ninth Revision, Clinical Modification (ICD-9-CM) codes, arthritis and other rheumatic conditions (AORC) has been defined by the National Arthritis Data Workgroup using those codes, and further divided into ten more specific subcategories defined in Arthritis and Joint Pain Codes. Both definitions were designed to exclude or minimize other major categories of musculoskeletal disease, such as osteoporosis and generic chronic back pain, even though some chronic back pain is due to arthritis. DDA is likely better for estimating what is happening in the population at large because arthritis may not be mentioned or recorded at healthcare system encounters that are typically more focused on other conditions (e.g., diabetes, heart disease). However, even with the latter limitation, AORC is likely better for estimating what is happening in the healthcare system.
A recent review of relevant data sources considers the strengths and limitations of each of the different case definitions. Using DDA criteria, four databases defined prevalence within 3 percentage points, while using ICD-9-CM criteria they had a 5 percentage point spread. This study highlights the difficulty of applying a single number for estimating prevalence of AORC and the need to consider the purpose, design, measurement methods, and statistical precision of the data source being used.3
While AORC occurs in children, it is difficult to acquire population data on them, so most of the estimates presented in this report are for adults unless otherwise noted.
In the general population, prevalence is better estimated by DDA than AORC. For the years 2013-2015, DDA affected an unadjusted average of 54.4 million adults, or 23 in 100 adults.1 Estimates show the typical distribution of higher prevalence among females and older adults, and lower prevalence among Hispanics and Asians. Absolute estimates show that most of these adults (59%, or 32.2 million) are of working age (younger than age 65).1 (Reference Table 3A.1.1 PDF [397] CSV [398])
 [400]
[400]
Specific types of AORC
Clinical data are required to provide some measure of validity for estimating the prevalence of specific types of arthritis because many people are not sure what type of arthritis they have. Data from the National Arthritis Data Workgroup provided 2005 national prevalence estimates for some of the ten specific types of arthritis used in later tables.2,3 Respondents could have reported more than one type.
Osteoarthritis: Osteoarthritis (OA) is the most common type of arthritis, characterized by progressive damage to cartilage and other joint tissues. Joint injury is a risk factor for OA, but most cases occur without a specific history of injury. Obesity is a risk factor for knee OA, and to a lesser extent for hip and hand OA. Clinical OA was estimated to affect 26.9 million in 20053 and over 30 million for 2008-2011.4 The joints most affected with radiographic OA and symptomatic OA were hands, knees, and hips.3
Rheumatoid arthritis: Rheumatoid arthritis (RA) is the prototypical inflammatory arthritis. It is a chronic autoimmune disease that causes pain, aching, stiffness, and swelling in multiple joints, especially the hands, in a symmetrical fashion. In 2005, RA was estimated to affect 1.3 million adults.2
Gout and other crystal arthropathies: Gout is a recurrent inflammatory arthritis that occurs when excess uric acid collects in the body. Gout has been recognized for centuries and often affects the big toe. In 2005, an estimated 6.1 million adults reported having gout at some time, with 3.0 million affected in the past year.3 More recent studies of self-reported gout and hospitalizations show the prevalence of gout increasing in the last two decades.5,6
Joint pain/effusion/other unspecified joint disorders: Joint pain can result from several causes, including inflammation, degeneration, crystal deposition, infection, and trauma. Joint pain is often accompanied by swelling and effusion. A joint effusion is the presence of increased intra-articular fluid within the synovial compartment of a joint. Determining the cause of joint pain is primary to treatment.
Spondylarthropathies: Spondylarthropathies (or spondylarthritides) are a family of diseases that includes ankylosing spondylitis, reactive arthritis, psoriatic arthritis, enteropathic arthritis (associated with ulcerative colitis or Crohn’s disease), juvenile spondylarthritis, and undifferentiated spondylarthritis. In 2005, spondylarthropathies affected an estimated 639,000 to 2.4 million adults ages 25 and older.2
Fibromyalgia: Fibromyalgia (FM) is a syndrome of widespread pain and tenderness. The diagnosis is difficult to make, so relevant prevalence data are hard to come by. In 2005, FM was estimated to affect around 5 million adults.3 A more recent estimate by the National Fibromyalgia Association puts the estimate at 10 million people in the US, with 75%-90% of the affected adult women. However, due to the difficulty in diagnosing fibromyalgia and the potential for including other causes of pain, this estimate should be used with caution.7
Diffuse connective tissue diseases include the next four diseases.
Systemic lupus erythematosus: Systemic lupus erythematosus (SLE) is the prototypical autoimmune disease in which the body’s immune system can attack many body systems, especially the skin, kidneys, and joints. In 2005, definite and suspected SLE was conservatively estimated to affect 322,000.2 Population-based registries have provided more recent estimates for various racial/ethnic groups.8,9,10
Systemic Sclerosis: Systemic sclerosis (SSc), or scleroderma, is an autoimmune disease that primarily affects the skin, but can affect any organ system. In 2005, SSc affected an estimated 49,000 adults.2
Primary Sjögren’s Syndrome: Primary Sjögren’s Syndrome (SS) is a syndrome of dry eyes, dry mouth, and arthritis. Secondary SS can occur in association with other rheumatologic diseases such as rheumatoid arthritis and lupus. Prevalence data are very limited. In 2005, an estimated 0.4 to 3.1 million adults had SS.2
Polymyalgia rheumatica and giant cell (temporal) arteritis: Polymyalgia rheumatica (PMR) is a syndrome of sudden aching and stiffness in older adults that responds to treatment with anti-inflammatory medications (e.g., corticosteroids). Giant cell arteritis (GCA), which often occurs with PMR, is a type of vasculitis that affects medium-size arteries and results in headache, vision loss, and other symptoms. In 2005, PMR was estimated to affect 711,000 adults;3 a more recent analysis from the same data source found that the incidence of PMR had increased slightly with mortality not unlike the general population,11 suggesting that prevalence may have increased slightly as well. In 2005, GCA was estimated to affect 228,000 adults.4
Carpal tunnel syndrome: Carpal tunnel syndrome (CTS) occurs when the median nerve becomes compressed at the wrist and causes numbness, pain, or weakness in part of the hand. Thickened tendons and other rheumatic conditions are a common cause. General population prevalence has been reported between 1% and 5%.12
Soft tissue disorders (excluding back): These are a variety of problems of the tendons, bursa, muscle, ligaments, and fascia that cause pain and dysfunction. Prevalence of soft tissue disorders is difficult to determine due to the variety of conditions included.
Other specific rheumatic conditions: These are other conditions that the National Arthritis Data Workgrop considered to be rheumatic conditions.
Juvenile arthritis: Arthritis and other rheumatic conditions are relatively uncommon in children, although they can be particularly severe when they do occur. One estimate using significant pediatric arthritis and other rheumatologic conditions (SPARC) codes put the average annual prevalence at 103,000 children for the years 2001-2004 for the combined codes for rheumatoid arthritis and other inflammatory polyarthropathies, allergic purpura, arthropathy associated with infections, other and unspecified arthropathies, polyarteritis nodosa and allied conditions, and rarer inflammatory conditions.The prevalence for all SPARC codes, including synovitis and myalgia, was 294,000.13 A more in-depth discussion can be found in the Juvenile Arthritis (click HERE [401] to open new page) section later in this document.
AORC prevalence continues to increase in the aging US population, with related increases in healthcare utilization. The increase in total ambulatory care visits, together with the increasing number of joint replacements and related hospitalizations, both impact healthcare utilization. The AORC case definition is more appropriate to use within the healthcare system, which is based on health condition codes. However, the AORC case definition will miss adults with mild arthritis that is not mentioned at the visit, or for whom arthritis may not be a priority when multiple conditions are present. For estimates in the following discussions, AORC condition codes, found in ICD-9-CM Codes [403] section are used.
In 2013, AORC-related diagnoses were listed in 105.7 million healthcare visits and represented more than 10% of all healthcare visits. Hospitalizations accounted for 6% of AORC visits, while ambulatory care accounted for 94% (77% physician office, 6% outpatient, and 11% emergency department). (Reference Table 3A.3.0.1 PDF [404] CSV [405])
 [407]
[407] When looking at how the ten subtypes of AORC affect the four types of healthcare utilization below, remember that the estimates are not mutually exclusive due to the potential for multiple diagnoses in a single visit. (Reference Table 3A.3.0.2 PDF [408] CSV [409]; Table 3A3.0.3 PDF [410] CSV [411]; Table 3A.3.0.4 PDF [412] CSV [413]; and Table 3A.3.0.5 PDF [414] CSV [415])
Hospitalizations
The Healthcare Cost and Utility Project (HCUP) 2013 Nationwide Inpatient Sample (NIS) estimates that 6.4 million hospitalizations were associated with a diagnosis of AORC, or 21.4% of all hospitalizations that year. AORC was the presenting or first-listed diagnosis for only 1% of all hospitalizations, suggesting the role of AORC is more of an important comorbidity or contributor to other conditions which are the reason for the hospitalization. Nearly one-half of the 6.4 million AORC hospitalizations were associated with osteoarthritis (46%), while joint pain/effusion/other unspecified joint disorders, gout, and soft tissue disorders were each listed in more than 10% of hospitalizations. Multiple AORC diagnoses are coded in 17% of hospitalizations with an AORC diagnosis. Osteosteoarthritisrthritis is the least likely to have another AORC diagnosis, while carpal tunnel syndrome is most likely to include multiple diagnoses. (Reference Table 3A.3.0.1 PDF [404] CSV [405] and Table 3A.3.0.2 PDF [408] CSV [409])
AORC-associated hospitalizations by sex, race/ethnicity, and geographic region resembled those for all 2013 hospitalizations; however, they differed in age, skewing toward the 65 & older age group (59.1% vs. 41.7%). (Reference Table 3A.3.1.0.1 PDF [416] CSV [417]; Table 3A.3.1.0.2 PDF [418] CSV [419]; Table 3A.3.1.0.3 PDF [420] CSV [421]; Table 3A.3.1.0.4 PDF [422] CSV [423])
Hospitalizations for specific types of AORC differed by demographic variables. Women comprised 59% of total AORC hospitalizations, but much more for hospitalizations with rheumatoid arthritis (75%), fibromyalgia (89%), and diffuse connective tissue disease (87%). Men comprised 41% of total AORC hospitalizations, but much more for hospitalizations with gout (67%) and soft tissue disorders (52%). (Reference Table 3A.3.1.0.1 PDF [416] CSV [417])
 [425]
[425] Those younger than age 65 comprised 41% of total AORC hospitalizations, but much more for hospitalizations with fibromyalgia (68%), diffuse connective tissues disease (67%), and carpal tunnel syndrome (61%). (Reference Table 3A.3.1.0.2 PDF [418] CSV [419])
 [427]
[427] Non-Hispanic blacks comprised 12% of total AORC hospitalizations, but much more for hospitalizations with gout (18%) and diffuse connective tissue disease (24%). (Reference Table 3A.3.1.0.3 PDF [420] CSV [421])
Hospitalizations for specific types of AORC did not differ much by geographic region. (Reference Table 3A.3.1.0.4 PDF [422] CSV [423])
The mean LOS for AORC-associated hospitalizations in 2013 was slightly greater than that for all hospitalizations (4.9 vs 4.7 days); differences by demographic groups were greater for AORC hospitalizations (than all hospitalizations) for women (4.8 vs 4.4 days), those 18 to 44 years (5.0 vs. 3.6 days), non-Hispanic blacks (5.6 vs 4.4 days), Hispanics (5.3 vs. 3.6 days), and those in the western geographic region (4.8 vs. 4.3 days). Among the 10 specific types of AORC the mean LOS was strikingly longer for those with soft tissue disorders and other specified rheumatic conditions both overall (6.5 and 6.5 vs. 4.9 days) and by every demographic subgroup. (Reference Table 3A.3.1.1.1 PDF [428] CSV [429]; Table 3A.3.1.1.2 PDF [430] CSV [431]; Table 3A.3.1.1.3 PDF [432] CSV [433]; Table 3A.3.1.1.4 PDF [434] CSV [435])
 [437]
[437]
Hospital charges are based on individual record discharges. The fees included may vary from patient to patient, but generally include hospital room, supplies, medications, laboratory fees, and care staff, such as nurses. They generally do not include professional fees (doctors) and non-covered charges. Emergency charges incurred prior to admission to the hospital may be included in total charges. It is important to note that charges are not necessarily the actual amount paid by Medicare, insurers, or patients. However, they are the only medical expenditure cost available in the major databases based on ICD-9-CM diagnostic codes and provide an overall picture for comparison purposes. Because multiple diagnoses are often made with an admission, actual charges related to a specific AORC may be much smaller. This is true of cost estimates provided in the Economic Burden [438] section also.
Mean hospital charges for AORC-associated hospitalizations generally paralleled, but were consistently higher than charges for all hospitalizations, both overall (+$5,900) and for all demographic subgroups. Higher mean charges among demographic subgroups were most striking for women (+$8,200), persons 18-44 years (+$18,800), non-Hispanic whites (+$9,900), non-Hispanic blacks (+$10,900), Hispanics (+$33,700), other non-Hispanics (+$10,700), and those in the South (+$9,500) and West (+$16,100).
 [440]
[440] Total charges for AORC-associated hospitalizations were $310.9 billion in 2013, comprising 24% of all hospital charges for the year. This percentage was relatively consistent for all sex and age groups except those 18 to 44 years, where it was only 11%. Among racial/ethnic groups, AORC total charges were 19% for non-Hispanic others, while they were 30% among non-Hispanic whites. AORC-associated hospitalization total charges were 29% of all hospitalizations in the Midwest in 2013.
Among the 10 AORC subgroups, hospitalizations with osteoarthritis accounted for $138.4 billion, or 45% of total charges for AORC-associated hospitalizations, while hospitalizations with joint pain/effusion/other, gout, and soft tissue disorders accounted for 16%, 13%, and 13% respectively). (Reference Table 3A.3.1.1.1 PDF [428] CSV [429]; Table 3A.3.1.1.2 PDF [430] CSV [431]; Table 3A.3.1.1.3 PDF [432] CSV [433]; Table 3A.3.1.1.4 PDF [434] CSV [435])
Discharge from the hospital to long-term care, which includes skilled nursing facilities, intermediate care, and other similar facilities, or to home health care occurred more frequently among AORC-associated hospitalizations than among all hospitalizations (44% vs 29%). This was true regardless of sex, age, race/ethnicity, or region of residence. By demographic characteristics, the highest proportion of discharge to long-term care or home health care was found among females (48%), age 65 and over (55%), and residents of the Northeast region (52%).
Among the 10 AORC subgroups there were no striking differences in discharge to long-term care or home health care compared with all AORC hospitalizations. Discharge to home was more frequent, and resembled all hospitalizations (66%), among those with carpal tunnel syndrome (68%), fibromyalgia (67%), diffuse connective tissue disease (64%), and spondylarthropathies (59%). (Reference Table 3A.3.1.3.1 PDF [441] CSV [442]; Table 3A.3.1.3.2 PDF [443] CSV [444]; Table 3A.3.1.3.3 PDF [445] CSV [446];Table 3A.3.1.3.4 PDF [447] CSV [448])
 [450]
[450]
Ambulatory Care Visits
From the 2013 surveys on ambulatory care, there were an estimated 99.3 million ambulatory care visits associated with a diagnosis of AORC, more than 10% of all ambulatory care visits that year, for a rate of 40.1/100 adults in the general population. An AORC-related condition was listed as the presenting (first) diagnosis for between 2.8% and 5.4% of all ambulatory care visits, depending on the healthcare site visited. Physicians’ offices accounted for 82% of all ambulatory AORC visits, vastly exceeding emergency department (12%) or outpatient (7%) sites. (see Table 3A.3.0.1 PDF [404] CSV [405]) As with hospital discharges, multiple AORC diagnoses were given in 15% to 20% of patient ambulatory visits. (Reference Table 3A.3.0.3 PDF [410] CSV [411]; Table 3A.3.0.4 PDF [412] CSV [413]; and Table 3A.3.0.5 PDF [414] CSV [415])
In 2013, AORC-associated ambulatory care visits resembled all 2013 ambulatory care visits by sex, race/ethnicity, and geographic region; they differed in age, being lower in the 18 to 44-year age group (21% vs. 32%) and higher in the 45 to 64-year age group (44% vs. 36%) and the 65 and older age group (34% vs. 32%). (Reference Table 3A.3.2.0.1 PDF [451] CSV [452]; Reference Table 3A.3.2.0.2 PDF [453] CSV [454]; Table 3A.3.2.0.3 PDF [455] CSV [456]; Table 3A.3.2.0.4 PDF [457] CSV [458]) (Note: Detailed data by type of ambulatory setting shown in Tables 3A.3.2.1.x, 3A.3.2.2.x(.1 to .4), and 3A.3.2.3.x, and can be accessed from the “Tables” tab in the upper right corner.)
Among the 10 AORC subgroups, 2 in 5 of the 99.3 million total ambulatory visits (41%) were associated with joint pain/effusion/other unspecified joint disorders or “other specified rheumatic conditions”; osteosteoarthritisrthritis and soft tissue disorders were the most common specific condition (~20% each). (Reference Table 3A.3.2.0.1 PDF [451] CSV [452])
 [460]
[460] AORC-associated ambulatory care visits for specific types of AORC differed by demographic variables. Women comprised 62% of all AORC-associated ambulatory care visits; their proportion was much higher for fibromyalgia (79%) and diffuse connective tissue disease (90%), but much lower for gout and other crystal arthropathies (27%). Men comprised 39% of all AORC-associated ambulatory care visits; their proportion was much higher for gout (72%). (Reference Table 3A3.2.0.1 PDF [451] CSV [452])
 [462]
[462] The 18 to 44-year old group comprised 21% of all AORC-associated ambulatory care visits; their proportion was a bit higher for diffuse connective tissue disease (31%), fibromyalgia (27%), and carpal tunnel syndrome (26%). Those aged 45 to 64 years comprised 44% of all AORC –associated ambulatory care visits; this proportion was similar for most specific types of AORC. Those aged 65 and older comprised 34% of all AORC-associated ambulatory care visits; their proportion was much higher for osteoarthritis (51%) and gout (50%), and much lower for fibromyalgia (20%). (Reference Table 3A.3.2.0.2 PDF [453] CSV [454])
 [464]
[464] Non-Hispanic whites (65% of the US population) comprised 73% of all AORC-associated ambulatory care visits, but only 59% of those for gout. Comparisons for other race/ethnic groups, as well as geographic regions were difficult to determine due to small sample sizes and unreliable data. (Reference Table 3A.3.2.0.3 PDF [410] CSV [411]; Table 3A.3.0.4 PDF [412] CSV [413])
 [466]
[466]
Some 81 million AORC-related ambulatory care visits were physician office visits (PHYS); these accounted for 82% of all ambulatory care visits. An AORC-related condition was listed as the presenting (first) diagnosis for 5.4% of all PHYS visits. (Reference Table 3A.3.0.1 PDF [404] CSV [405])
Overall, 2013 AORC-related PHYS visits resembled those for all 2013 PHYS visits by sex, race/ethnicity, and geographic region; they differed in age, being lower in the 18 to 44-year age group (20% vs. 29%), higher in the 45 to 64-year age group (46% vs. 37%), and similar in the 65 and older age group (34%).
Among the 10 AORC subgroups, nearly 2 in 5 of the 81 million AORC-related PHYS visits (37%) were associated with joint pain/effusion/other unspecified joint disorders; osteoarthritis and soft tissue disorders were about 21% each. (Reference Table 3A.3.2.1.1 PDF [467] CSV [468])
AORC-related PHYS visits for specific types of AORC differed by demographic variables. Women comprised 61% of all AORC-associated PHYS visits; their proportion was much higher for rheumatoid arthritis (77%) and diffuse connective tissue disease (90%). Men comprised 39% of all AORC-associated PHYS visits; their proportion was much higher for gout (71%). (Reference Table 3A.3.2.1.1 PDF [467] CSV [468])
Persons aged 18 to 44 comprised 20% of all AORC-associated PHYS visits; their proportion was higher for diffuse connective tissue disease (29%) and soft tissue disorders (26%), while lower for osteoarthritis (7%) and rheumatoid arthritis (13%). Those aged 45 to 64 comprised 46% of all AORC–associated PHYS visits; their proportion pf PHYS visits was higher for fibromyalgia (55%) and carpal tunnel syndrome (50%). Those aged 65 and older comprised 34% of all AORC-associated PHYS visits; their proportion was much higher for osteoarthritis (51%) (Reference Table 3A.3.2.1.2 PDF [469] CSV [470]).
Non-Hispanic whites comprised 74% of all AORC-associated PHYS visits; their proportion was higher for rheumatoid arthritis (80%), spondylarthropathies (79%), and lower for gout (65%) and carpal tunnel syndrome (68%). Comparisons for other race/ethnic groups were difficult to determine. (Reference Table 3A.3.2.1.3 PDF [471] CSV [472])
There was little difference by geographic region. (Reference Table 3A.3.2.1.4 PDF [473] CSV [474]).
Some 6.5 million AORC-related ambulatory care visits were to outpatient (OP) clinics; these accounted for 7% of all ambulatory care visits. An AORC-related condition was listed as the presenting (first) diagnosis for 4.4% of all OP visits. (Reference Table 3A.3.0.1 PDF CSV)2013 AORC-related OP visits resembled those for all 2013 OP visits by sex, race/ethnicity, and geographic region; they differed in age, being lower in the 18 to 44-year age group (25% vs. 38%), and higher in the 45 to 64-year age group (49% vs. 39%) and the 65 and older age group (27% vs. 23%) (Reference Table 3A.3.2.2.1 PDF [475] CSV [476]).
Among the 10 AORC subgroups, more than 2 in 3 of the 6.5 million AORC-related OP visits (69%) were associated with joint pain/effusion/other unspecified joint disorders and osteoarthritis; soft tissue disorders and rheumatoid arthritis accounted for about 12% each. (Reference Table 3A.3.2.2.2 PDF [477] CSV [478])
AORC-related OP visits for specific types of AORC differed by demographic variables. Women comprised 69% of all AORC-associated OP visits; their proportion was much higher for rheumatoid arthritis (83%) and diffuse connective tissue disease (88%). Men comprised 31% of all AORC-associated OP visits; their proportion was much higher for gout (81%) and osteoarthritis (67%) (Reference Table 3A.3.2.2.1 PDF [475] CSV [476]).
Persons aged 18 to 44 comprised 25% of all AORC-associated OP visits; their proportion was higher for diffuse connective tissue disease (38%) and carpal tunnel syndrome (38%). Those aged 45 to 64 comprised 49% of all AORC-associated OP visits; their proportion was higher for rheumatoid arthritis (63%). Those aged 65 and older comprised 27% of all AORC-associated OP visits; their proportion was much higher for osteoarthritis (40%) (Reference Table 3A.3.2.2.2 PDF [477] CSV [478]).
Non-Hispanic whites comprised 58% of all AORC-associated OP visits; their proportion was higher for spondylarthropathies (71%) and fibromyalgia (70%). Comparisons for other race/ethnic groups were difficult to determine. (Reference Table 3A.3.2.2.3 PDF [479] CSV [480])
There was little difference by geographic region. (Reference Table 3A.3.2.2.4 PDF [481] CSV [482])
Emergency department (ED) visits for AORC-related diagnoses, totaling 11.7 million, accounted for 12% of all ambulatory care visits in 2013 and 11% of all emergency department visits. An AORC-related condition was listed as the presenting (first) diagnosis for 2.8% of all ED care visits. (Reference Table 3A.3.0.1 PDF [404] CSV [405])
2013 AORC-related ED visits resembled those for all 2013 ED visits by sex and geographic area; they differed in age, being lower in the 18 to 44-year age group (29% vs. 49%) and higher in the 45 to 64-year age group (34% vs. 29%) and the 65 and older age group (37% vs. 23%). (Reference Table 3A.3.2.3.2 PDF [483] CSV [484])
Among the 10 AORC subgroups, 3 in 5 of the 11.7 million AORC-related ED visits were associated with joint pain/effusion/other unspecified joint disorders and osteoarthritis; soft tissue disorders and fibromyalgia accounted for 13% and 12%, respectively. (Reference Table 3A.3.0.1 PDF [404] CSV [405])
AORC-related ED visits for specific types of AORC differed by demographic variables. Women comprised 61% of all AORC-associated ED visits; their proportion was much higher for rheumatoid arthritis (77%), fibromyalgia (79%) and diffuse connective tissue disease (90%). Men comprised 39% of all AORC-associated ED visits; their proportion was much higher for gout (69%). (Reference Table 3A.3.2.3.1 PDF [485] CSV [486])
Persons aged 18 to 44 comprised 29% of all AORC-associated ED visits; their proportion was higher for diffuse connective tissue disease (40%), fibromyalgia (43%), and carpal tunnel syndrome (51%). Those aged 45 to 64 comprised 34% of all AORC-associated ED visits; this proportion was similar for most specific types of AORC. Those aged 65 and older comprised 37% of all AORC-associated ED visits; their proportion was much higher for osteoarthritis (66%), rheumatoid arthritis (49%), gout (56%), spondylarthropathies (50%), and other specified rheumatic conditions (49%). (Reference Table 3A.3.2.3.2 PDF [483] CSV [484])
Race/ethnicity was not a defined variable in the NEDS database. There was little difference by geographic region. (Reference Table 3A.3.2.3.4 PDF [487] CSV [488])
Disease burden can be measured in many ways. This is particularly important for AORC, which has a modest effect on conveniently measured outcomes like mortality, but a much larger impact on less conveniently measured outcomes important to functionality for most people. Such outcomes include effects on work, health-related quality of life, independence, and ability to keep doing valued life activities. Three of these burdens, along with adverse life style factors that are associated with arthritis, are addressed in the estimates below.
Bed Days and Lost Work Days
Bed days are defined as spending one-half or more days in bed due to injury or illness, excluding hospitalization. Data are averaged over three years for the NHIS to achieve larger, more powerful sample sizes. For the years 2013-2015, the proportion who had bed days among adults with arthritis was higher than that for adults with any medical condition (45% vs. 41%). The 24.6 million adults with doctor-diagnosed arthritis and any bed days, 10% of the adult population, had an annual average of nearly 25 days spent in bed in the previous 12 months. This is far higher than the annual average of 14.5 bed days for the 41% of adults with bed days for any medical condition. Multiplying the 24.6 million adults by the mean bed days for arthritis resulted in 607 million bed days overall, or 55% of the 1.1 trillion bed days among adults reporting any medical condition. (Reference Table 3A.4.1.1 PDF [489] CSV [490])
Among adults with arthritis, females had a higher proportion than males of bed days (48% vs 41%) and a slightly higher mean number of days (25.6 vs. 23.1 days). Females with arthritis accounted for 65% of total bed days in 2013-2015. (Reference Table 3A.4.1.1 PDF [489] CSV [490])
Bed days are reported by a higher proportion of younger than by older adults with arthritis. Adults with arthritis had a higher proportion with bed days than adults reporting any medical condition in each age group: persons aged 18 to 44 years (59% vs. 46%), aged 45 to 64 years (50% vs. 41%), and aged 65 and older (35% vs. 31%). This was also true for the average number of bed days: 18 to 44 years (20.1 vs 9.3 days), 45 to 64 years (26.4 vs. 17.3 days), and 65 and older years (24.7 vs. 22.0 days). (Reference Table 3A.4.1.2 PDF [491] CSV [492])
Among racial/ethnic groups, those with arthritis had similar proportions reporting bed days (range 43%-47%) and a similar average number of bed days (range 21.4-25.6). (Reference Table 3A.4.1.3 PDF [493] CSV [494])
In the different geographic regions, those with arthritis had similar proportions with bed days (range 43%-47%) and a similar average number of bed days (range 22.4-27.2). (Reference Table 3A.4.1.4 PDF [495] CSV [496])
 [498]
[498]
Persons in the workforce are defined as adults having worked at a job in the past 12 months. In the 2013-2015 NHIS sample, 81% of those age 18 to 44 held a job (56% of workforce), 74% of persons aged 45 to 64 years held a job (38% of workforce), and 20% of persons aged 65 and older were still working, comprising just under 6% of the workforce. Among the persons aged 65 and older, 83% were age 74 and younger. By sex, 73% of males reported being in the workforce, while 62% of females worked in the past 12 months. Males represented 52% of the workforce.
Lost work days for persons in the workforce are defined as absence from work due to illness or injury in the past 12 months, excluding maternity or family leave. For the years 2013-2015, the proportion of persons who had lost work days among adults with arthritis was lower than that for adults with any medical condition (23% vs. 30%). Among adults with doctor-diagnosed arthritis, 12.6 million in the workforce reported an average of 14.3 work days lost in the past 12 months, nearly 5 days more than the 9.4 work days reported by adults with any medical condition. This resulted in 180.9 million total lost work days among adults with arthritis who are in the workforce, or 34% of the 533.2 million work days lost among adults reporting any medical condition.
Among adults with arthritis, females and males in the workforce had similar proportions with lost work days (23%-24%) and similar mean number of lost work days (14.2-14.4). Females accounted for 57% of total arthritis-attributed lost work days per year in 2013-2013 due to the higher number of females with arthritis. (Reference Table 3A.4.1.1 PDF [489] CSV [490])
Compared with older adults, younger adults with arthritis or any medical condition had a higher proportion of lost workdays. Adults with arthritis had a higher proportion of lost work days than adults reporting any medical condition for persons aged 18 to 44 years (47% vs. 42%), but proportions were similar for the older age groups. Although, overall, the proportion of persons with DDA reporting lost work days was slightly less than was reported for any medical condition, the average number of lost work days was higher among adults with arthritis than adults with any medical condition: 18 to 44 years (13.4 vs 8.2 days), 45 to 64 years (14.6 vs. 10.8 days), and 65 and older (15.3 vs. 12.6 days). Adults aged 45 to 64 accounted for 62% of total arthritis-related lost work days even though they only comprised 38% of the workforce and 47% of those with any medical cause. (Reference Table 3A.4.1.2 PDF [491] CSV [492])
 [500]
[500]
Activity Limitations
Activity limitations are included in the National Health Interview Survey in both the family database and the adult database, with slightly different response codes. Respondents are asked first if they need help performing a variety of activities of daily living (ADL), such as personal care, bathing, eating, getting in/out of chair, and walking. They are also asked if they are “limited in the kind or amount of work” they can perform. If a limitation of any type has a “yes” response, respondents are shown a list of 34 possible medical conditions and asked to identify those that cause the limitation. Multiple causes may be identified. This section uses the adult database and focuses on cases where arthritis is identified as a cause of limitations. The variable AAAL, defined in the introduction to this arthritis section, is based on a single question in the NHIS1 and produces somewhat different numbers than this more inclusive definition of activity limitations.
Limitations in any activities of daily living (ADLs) include seven components. Musculoskeletal-related ADLs include only the three limitations related to movement and action commonly associated with musculoskeletal diseases and are 1) “needing help with routine needs,” 2) ”needing help with personal care,” and 3) “having difficulty walking without equipment.” Other ADLs are related to memory, vision, hearing, and other limitations.
Of the 35.6 million adults with limitations in any ADL, 23% (8.0 million) named arthritis as a cause; the proportion jumped to 29% for those with a limitation in musculoskeletal-related ADLs. One-third (33%, 4.5 million of 13.9 million) of adults with difficulty walking identified arthritis as a cause. More than 1 in 4 attributed their need for help with routine needs (2.8 million) or personal care (1.5 million) to arthritis. (Reference Table 3A.4.2.1 PDF [501] CSV [502])
These numbers demonstrate the large impact of arthritis on adults with limitations in any ADL or in musculoskeletal related ADLs. The effect was much stronger among females than males (Reference Table 3A.4.2.1 PDF [501] CSV [502]) and among older adults. (Reference Table 3A.4.2.2 PDF [503] CSV [504])
Little difference was found between adults by race/ethnicity except for slightly higher proportion of non-Hispanic blacks attributing limitations to arthritis. (Reference Table 3A.4.2.3 PDF [505] CSV [506]). Geographic region in the US does not seem to be a factor. (Reference Table 3A.4.2.4 PDF [507] CSV [508])
Work limitations are defined here as those unable to work now due to health or limited in kind or amount of work (i.e., “unable to work” or “limited in work”). Of the 28.1 million adults with work limitations per year in 2013-2015, arthritis attributable work limitations (AAWL) affected on average 23% (6.4 million). Among those with any medical condition limiting work, 23% attributed their inability to work now to arthritis, while 22% limited in kind or amount of work did so. Higher percentages of females and older workers identified arthritis as a cause for work limitations. There was little difference seen by race/ethnicity or geographical region. (Reference Table 3A.4.2.1 PDF [501] CSV [502]; Table 3A.4.2.2 PDF [503] CSV [504]; Table 3A.4.2.3 PDF [505] CSV [506]; and Table 3A.4.2.4 PDF [507] CSV [508]).
 [510]
[510]
 [512]
[512] Quality of Life and Lifestyle Factors
Among persons with DDA, compared with those without DDA, Health-Related Quality of Life (HRQoL) is worse on several scales. When assessed by self-reported health status, 27% of those with DDA reported fair/poor health compared to 12% of those without DDA. The DDA group also reported a higher mean number of days in the past month with poor physical health (6.6 vs 2.5 days), poor mental health (5.4 vs 2.8 days), or days with limitations in usual activities (4.3 vs 1.4 days).2 Using the same “unhealthy days” measures, an analysis of 2014 Humana Medicare Advantage members found that those with arthritis had more total unhealthy days, by 2.2 days per year, than those without arthritis, and that comorbid arthritis associated with hypertension, diabetes, chronic obstructive pulmonary disease, and congestive heart failure resulted in significant increases in both physically and mentally unhealthy days.3
The prevalence of DDA and of AAAL is much higher among those with the adverse lifestyle factors of obesity, insufficient or no physical activity, and fair/poor self-rated health.4 (Reference Table 3A.4.3 PDF [513] CSV [514])
The Economic Cost [519] section of this report uses the Medical Expenditures Panel Survey (MEPS), a standard source for cost of illness estimates, to estimate the total direct and indirect costs of musculoskeletal conditions and selected categories of musculoskeletal conditions, as well as the incremental direct and indirect costs specifically attributable to the selected category. Total costs are all costs for a patient regardless of the condition responsible; incremental costs are those costs attributed to a specified condition. A quick review of all economic terms used can be found by clicking HERE [520].
There are several important points to remember here. First, for arthritis and other rheumatic conditions, MEPS requires the use of selected 3-digit ICD-9-CM codes, using the 3- and 4-digit NADW AORC ICD-9-CM codes [521] to create a similar category called “arthritis and joint pain.” This approach has been used for a number of years and provides a comparative estimate of the costs of AORC. Additionally, costs estimates are per person and reported as mean per person costs. To arrive at the estimated aggregate cost, the mean per person cost is multiplied by the number of people affected, resulting in a total cost for conditions in the United States.
MEPS provides estimates of actual medical “expenditures,” meaning money changing hands, rather than medical “charges,” which are based on what is originally billed but rarely paid in full. Thus, the term direct costs, as used here, reflects actual medical expenditures. Indirect costs are those associated with lost wages. Aggregate costs for both direct and indirect costs are the sum of per-person costs across all individuals with the condition.
All-cause costs include medical expenditures or lost wages for persons with musculoskeletal disease, regardless of whether those costs are due to the musculoskeletal disease or another medical condition. Incremental costs are those estimated as attributable to musculoskeletal disease.
Direct Costs
Annual all-cause direct costs, in 2014 dollars, for arthritis and joint pain increased from a per person mean of $6,642 in the years 1996-1998 to $9,554 in 2012-2014. Incremental direct costs for arthritis and joint pain increased from a per person mean of $679 in the years 1996-1998 to a mean of $1,352 in 2012-2014, in 2014 dollars. The change in total mean costs was 44%, while incremental mean costs doubled. Incremental arthritis and joint pain costs showed a decline in 2012-2014 annual average costs compared to the previous five periods. (Reference Table 8.4.3 PDF [522] CSV [523]; Table 8.5.3 PDF [524] CSV [525])
 [527]
[527] Mean per person direct costs include ambulatory care, inpatient care, prescriptions, and other healthcare costs. In 2012-2014, ambulatory care accounted for about a third of per person direct costs, with inpatient care and prescriptions each accounting for approximately one-quarter (28% and 25%, respectively) of total cost. Over the past 18 years, prescription costs have seen the greatest change, rising nearly 140% per person in that time. Both inpatient and other healthcare costs remained steady at 9% and 11% increase, respectively. Ambulatory care increased by 59% over the same time period. (Reference Table 8.4.3 PDF [522] CSV [523])
 [529]
[529] Annual all-cause aggregate medical costs for persons with a diagnosis of arthritis and joint pain in the US increased from $192.4 billion in 1996-1998 to $626.8 billion, in 2014 dollars, for the years 2012-2014. Aggregate annual direct costs specifically attributed to arthritis and joint pain (incremental costs) in the US increased from $19.7 billion in 1996-1998 to $88.7 billion for the years 2012-2014, in 2014 dollars. While the increase over the 18-year period for total aggregate costs was more than 225%, the increase for incremental aggregate costs was greater than 350%, despite the recent decline in aggregate incremental costs. (Reference Table 8.6.3 PDF [530] CSV [531])
 [533]
[533] Annual per-person all-cause direct costs for arthritis and joint pain are highest for people age 65 and older, females, non-Hispanic whites, and residents of the Northeast region. Lower education and marital staus (divorced-widowed-separated) are also factors in higher cost. Public only insurance (Medicaid/Medicare) show the highest per person costs, in part because they serve a large share of the elderly population. (Reference Table 8.15.3 PDF [534] CSV [535])
Mean and aggregate total and incremental direct and indirect costs for osteoarthritis [536], rheumatoid arthritis [537], gout [538], and connective tissue disease [539], using the annual average for years 2008-2014 MEPS data, are calculated and shown in their respective sections.
Indirect Costs
“Indirect costs” as used in this report reflect estimates of earnings losses for persons with a work history who are unable to work due to a medical condition. They do not reflect supplemental measures, such as reduced productivity, worker replacement, or early retirement due to medical conditions.
Indirect costs are not estimated for the broad category of arthritis and joint pain.
Because many types of arthritis have a higher prevalence among older adults, we expect that the current aging of the population will increase the prevalence and impact of AORC unless new interventions are implemented within the near future. The projections of arthritis prevalence and AAAL take into account age and sex, but do not take into account potentially important factors such as the obesity epidemic and the increasing frequency of joint injuries.1 The age-adjusted percentage of AAAL among adults with arthritis increased 19% between 2002-2004 and 2013-2015.2 Previous costs of arthritis have been driven by age-related increases in prevalence,3 so future costs of arthritis are likely to be driven higher by the same age-related increase in prevalence, but also from the increasing frequency of surgical interventions.
Several data limitations exist for monitoring AORC burden in the future. First, on October 1, 2015, ICD-10-CM was required for use in clinical records; it was previously in use for death records. The current National Arthritis Data Workgroup definition of AORC uses ICD-9-CM codes. Due to significant changes in conceptualizing the new codes, a direct translation cannot be made. This means a new definition of AORC or some similar concept will be needed for analyses using ICD-based data in the future. CDC is working with ICD-10-CM translation experts and selected stakeholders to propose a draft standard ICD-10-CM based definition, which will be shared with the larger arthritis community to reach agreement on a new definition.
Second, there is a need for data on more specific conditions, for example rheumatoid arthritis, systemic lupus erythematosus, and psoriatic arthritis, to help drive clinical (eg, treatment, quality of care) and public health (eg, self-management education, safe physical activity) efforts that allow for better incidence estimates in order to better understand risk. Electronic health records may prove helpful in creating valid measures. There is also a lack of data on patient reported outcome measures (PROMs) on pain and function in electronic health records and administrative databases. These outcome measures are important to assessing the impact/burden of rheumatic and musculoskeletal diseases.
Arthritis and other rheumatic conditions are not addressed with the same priority as many other chronic conditions, perhaps because such priorities are driven more by easily available measures of mortality rather than by more challenging measures such as quality of life, disability, and impact on work. However, there is a growing policy interest in the role of multiple chronic conditions in health and health costs,1 and AORC plays a major role from this perspective for at least three reasons. First, those with priority chronic conditions are highly affected by AORC, with about half of adults with heart disease or diabetes and about a third of adults with obesity affected by DDA.2,3,4 Second, arthritis is very common condition among individuals with two or more chronic conditions, regardless of the conditions considered.5 Third, those with arthritis as one of their multiple chronic conditions fare much worse on important life domains such as social participation restriction, serious psychological distress, and work limitations.6
There are widespread and consistent professional recommendations for most types of AORC that involve increasing self-management of the disease through education, physical activity, and achieving a healthy weight, but little progress is being made.1 Such behavioral interventions offer evidence-based improvements to patients without the side effects seen with medications and other interventions. While most clinical settings are not set up to help patients achieve these recommendations effectively, increasing clinical/community linkages may offer a better approach. To see if provider referrals to community resources is a better solution, approaches such as the 1.2.3 Approach to Provider Outreach [542] and Spread the Word: Marketing Self-Management Education Through Ambassador Outreach [543] are being pilot tested in communities.
The Healthy People [544] project started with the 1979 Surgeon General’s report, Healthy People: The Surgeon General’s Report on Health Promotion and Disease Prevention. The current version of Healthy People 2020 [545] has set nine arthritis objectives for the nation to achieve by 2020, but only limited progress has occurred with the current level of investments in interventions. Currently, four new developmental objectives are included in the Arthritis, Osteoporosis, and Chronic Back Conditions [546] topic area as part of a larger effort to insure that chronic pain, regardless of the original cause, is included in Healthy People 2020.
There is a need for more conveniently measured outcomes that are important to most people. Such outcomes include effects on work, activities, health-related quality of life, independence, and ability to keep doing valued life activities.
Research funding to develop and evaluate more effective clinical and public health interventions is relatively modest, given that arthritis is the most common cause of disability and is a large and growing problem, affecting 54.4 million adults now,2 and a projected 78 million by 2040.3 This is especially frustrating because even the evidence-based interventions we have now are not reaching the people who would benefit from them. Implementation research to translate effective interventions to clinical practice and/or community settings is needed.
Although most adults with doctor-diagnosed arthritis are younger than age 65 and in their working years, the effect of their arthritis on employment and work, and the effect of reasonable workplace accommodations, have not been explored in depth. There is a need for the development and demonstration of web-based or app-based interventions for education, physical activity and achieving a healthy weight. This is an urgent issue right now and will continue to be an urgent issue as an aging workforce keeps working beyond age 65, as is anticipated.
As noted above, the use of ICD-9-CM codes for clinical and public health purposes ended with the healthcare system shift to the ICD-10-CM codes on October 1, 2015. This means the national surveys analyzed here that use ICD codes will shift to ICD-10CM as well. Standard definitions of generic and specific types of AORC need to be developed for clinical and public health researchers using the new ICD-10-CM codes; otherwise, investments in research will not be comparable and will be unable to build on each other.
Codes used in this analysis of AORC are based on the "National Arthritis Data Workgroup ICD-9-CM diagnostic codes for arthritis and other rheumatic conditions." Centers for Disease Control and Prevention, Arthritis Program, National Arthritis Data Workgroup.1
Osteoarthritis and allied disorders
715-Osteoarthritis and allied disorders
Rheumatoid arthritis
714-Rheumatoid arthritis and other inflammatory polyarthropathies
Gout and other crystal arthropathies
274-Gout
712-Crystal arthropathies
Joint pain, effusion and other unspecified joint disorders
716.1, .3-.6-.9-Other unspecified arthropathies
719.0, .4-.9-Other and unspecified joint disorders
Spondylarthropathies
720-AS/inflammatory spondylopathies
721-Spondylosis and allied disorders
99.3-Reiter’s Disease
696.0-Psoriatic arthopathy
Fibromyalgia
729.1-Myalgia and myositis unspecified
Diffuse connective tissue disease
710-Diffuse connective tissue disease [excl 710.0-.2]
710.2-Sicca syndrome (also called Sjögren's syndrome)
710.1-Systemic sclerosis (SSC, scleroderma)
710.0-Systemic lupus erythematosus (SLE)
Carpal tunnel syndrome
354.0-Carpal tunnel syndrome
Soft tissue disorders (excluding back)
726-Peripheral enthesopathies and allied disorders
727-Other disorders of synovium/tendon/bursa
728.0-.3, .6–.9-Disorders of muscle/ligament/fascia
729.0-Rheumatism, unspecified and fibrositis
729.4-Fascitis, unspecified
Other specified rheumatic conditions
95.6-Syphilis of muscle
95.7-Syphilis of synovium/tendon/bursa
98.5-Gonococcal infection of joint
136.1-Behcet’s syndrome
277.2-Other disorders purine/pyrimidine metabolism
287.0-Allergic purpura
344.6-Cauda equina syndrome
353.0-Brachial plexus/thoracic outlet lesions
355.5-Tarsal tunnel syndrome
357.1-Polyneuropathy in collagen vascular disease
390-Rheumatic fever w/o heart disease
391-Rheumatic fever w/heart disease
437.4-Cerebral arteritis
443.0-Raynaud’s syndrome
446-Polyarteritis nodosa and allied conditions [excl 446.5]
447.6-Arteritis, unspecified
711-Arthritis associated with infections
713-Arthropathy associated w/disorders classified elsewhere
716.0, .2, .8-Specified arthropathies
719.2, .3-Specified joint disorders
725-Polymyalgia rheumatica
Arthritis is an umbrella term that refers to joint pain or joint disease and encompasses more than 100 conditions. While there is no single accepted classification system for arthritis conditions, in general they are grouped as follows.
• Osteoarthritis [536]
• Inflammatory arthritis [549]
o Rheumatoid arthritis [537]
o Spondyloarthropathies [550]
o Connective tissue disease (eg, SLE, lupus) [539]
• Gout [538]
• Joint infection [551]
• Fibromyalgia [552]
• Juvenile arthritis [401]
• Joint pain/Joint replacement [553]
Osteoarthritis (OA) is widely recognized as the most common form of arthritis, and a major cause of pain and disability among US adults. Estimates of prevalence vary depending on how OA is defined: radiographic, symptomatic radiographic, or symptomatic only (self-reported presence of pain, aching, or stiffness). Radiographic OA is reported at higher prevalence levels than symptomatic, but symptomatic OA is more often cited from the self-reported databases.
From 2008 to 2014, 32.5 million US adults, or one in seven persons (14%), reported osteoarthritis and allied disorders, including joint pain with other specified or unspecified arthropathy, (herein called “osteoarthritis”) annually. Per previous research on the definition of osteoarthritis in the Medical Expenditure Panel Survey (MEPS),1 OA was defined as the presence of ICD-9-CM code 715 or a self-reported diagnosis of arthritis excluding rheumatoid arthritis and presence of ICD-9-CM 716 or ICD-9-CM 719. (Reference Table 8.13 PDF [554] CSV [555])
Across socio-demographic and health status characteristics, the following five groups represented the largest number of adults with OA by demographic classification: non-Hispanic whites (25.3 million), middle age (45-64 years) (14.8 million) or older adults (≥ 65 years) (13.8 million), those with private insurance (18.8 million), and those who were married/had a partner (17.8 million). (Reference Table 8.22 PDF [556] CSV [557])
 [559]
[559] However, total numbers do not reflect the share of the population group with OA. For example, females represent about 51% of the adult population in any given year, but comprise 78% of adults with OA. An even more disproportionate share of 18% of the population age 65 and older have OA (43%). This compares to 46% with osteoarthritis in the 34% of the population age 45 to 64 years. Non-Hispanic whites still have the highest share by race/ethnicity, comprising 65% of the population but 78% of those with OA, while Hispanics have the lowest (15% of population to 7% of adults with OA). Geographic region is not a major factor for OA, although the Midwest has a higher proportion of cases than it represents in the US population.
 [561]
[561] Share of the total OA population, however, does not give the whole picture. Since OA is closely linked to age, race/ethnicity and geographical regions with younger population segments will exhibit a lower overall share of OA patients. Both non-Hispanic black and Hispanic populations have a higher share of adults age 45 and older reporting OA than is found among non-Hispanic white adults. Hence, while non-Hispanic white adults represent the largest group of adults with OA, other race/ethnic groups have higher rates of OA. This same pattern can be seen in geographic regions, where the West has a younger population but higher rate of OA in the 65 and older population than is found in other regions. (Reference Table T3A.1.1.a PDF [562] CSV [563])
 [565]
[565]
Joint Involvement in Osteoarthritis
Most OA diagnoses in both a hospital and outpatient setting do not specify the bodily site for which a healthcare visit is made. However, among those that are diagnosed with a specific site, the knee is the most common, followed by the hip. The knee accounts for about one-third (31%) of OA visits in all settings and is the only site identified in the data that meets reliability standards in all outpatient settings. Osteoarthritis in the hip accounts for 14% of hospital discharges, and 6% of physician office visits. (Reference Table 3C.1.0 PDF [566] CSV [567])
Healthcare Utilization
Osteoarthritis was diagnosed in 23.7 million healthcare visits in 2013, or 2.4% of all healthcare visits for any cause (Reference Table 3A.3.0.1 PDF [404] CSV [405]). It accounted for 10% of all hospitalizations and 2% of ambulatory visits.
Nearly 3 million hospital stays in 2013 had an OA diagnosis and it was the leading cause (46%) of hospitalization among all arthritis diagnoses. Osteoarthritis accounted for 45% of total hospital charges for arthritis diagnoses (cost charged but not necessarily paid), presumably in part because OA is the principal diagnosis associated with hip and knee joint replacements. Fewer than half (43%) of patients with an OA diagnosis were discharged to home or self-care, the lowest share of all arthritis diagnosed hospitalized patients. This is probably due to discharges to assisted living facilities or skilled nursing homes for rehabilitation following the hip or knee joint replacement. (Reference Table 3A.3.0.1 PDF [404] CSV [405]; Table 3A.3.1.1.1 PDF [428] CSV [429]; Table 3A.3.1.3.1 PDF [441] CSV [442]; and Table 3A.5.3 PDF [568]CSV [569])
 [571]
[571] Females hospitalized with OA outnumber males two to one, while two in three patients were age 65 and older and hospitalized at a rate of 4.5 in 100. Non-Hispanic whites had the highest rate of hospitalization for OA (1.4 in 100 persons), while Hispanics had the lowest rate (0.4/100). Residents of the Midwest region were also more likely to be hospitalized with a diagnosis of OA (1.5/100), while those living in the West were least likely (0.9/100). Regional differences are a product of age to some degree, with the mean age of the Northeast and Midwest about 4 years older than the West. (Reference Table 3A.3.1.0.1 PDF [416] CSV [417]; Table 3A.3.1.0.2 PDF [418] CSV [419]; Table 3A.3.1.0.3 PDF [420] CSV [421]; and Table 3A.3.1.0.4 PDF [422] CSV [423])
Osteoarthritis was diagnosed in 20.8 million outpatient visits in 2013 and accounted for one in five (21%) ambulatory care visits with any arthritis diagnosis. This was a rate of 1 in 12 (8.4%) outpatient visits for any diagnoses including an OA diagnosis. Visits per 100 were higher among females, adults 45 years and older, and non-Hispanic whites and blacks. Residents in the South had the lowest rate of outpatient visits for OA. (Reference Table 3A.3.2.0.1 PDF [451] CSV [452]; Table 3A.3.2.0.2 PDF [453] CSV [454]; Table 3A.3.2.0.3 PDF [455] CSV [456]; Table 3A.3.2.0.4 PDF [457] CSV [458])
Economic Burden
Combining direct and indirect costs for OA and allied disorders, average annual all-cause costs for the years 2008-2014 were $486.4 billion. Total incremental costs (direct and indirect costs directly associated with osteoarthritis) were $136.8 billion. (Reference Table 8.13 PDF [554] CSV [555])
Among all adults with osteoarthritis, annual all-cause per person direct costs were $11,502. Those reporting limitations had the highest all-cause per person direct costs: any limitation in work, housework, or school activities ($17,136) or any limitation in IADLs, ADLs, functioning, work, housework, school, vision or hearing ($14,146).
 [573]
[573]
 [575]
[575] Annual total all-cause direct costs were $373.2 billion. The five socio-demographic groups with the highest total all-cause direct costs were: non-Hispanic whites ($300.7 billion); those with any limitation in IADLs, ADLs, functioning, work, housework, school, vision or hearing ($298.5 billion); any limitation in work, housework, or school activities ($213.0 billion); any private insurance ($216.5 billion); or who were married/had a partner ($200.4 billion).
Osteoarthritis incremental direct medical costs totaled $65.5 billion annually; average per person OA incremental costs were $2,018. (Reference Table 8.13 PDF [554] CSV [555], and Table 8.22 PDF [556] CSV [557])
Some 16.7 million adults of working age (18-64 years) with a work history had OA. The ratio of persons in the labor force without osteoarthritis (90%) is higher than for those with OA (69%), resulting in earnings losses due to OA.
On average, for the years 2008-2014, those without OA earned $6,783 more than those with OA, which represented a total of $113.2 billion in all-cause earnings losses for all U.S. adults with OA. Earnings losses attributable to OA were $71.3 billion; per person osteoarthritis-attributable earnings losses were $4,274. (Reference Table 8.13 PDF [554] CSV [555])
Lifetime cost attributed to knee OA in 2013 were $140,300. More than one-half (54%) of knee OA patients underwent total knee arthroplasty (TKA) an average of 13 years after diagnosis. The largest proportion of knee OA-related direct medical costs for those meeting TKA eligibility criteria was attributable to primary TKA.2
Inflammatory arthritis is a group of diseases characterized by inflammation of the synovial membrane in the joints and, often, other tissues throughout the body. Some forms of inflammatory arthritis are autoimmune diseases, conditions in which the body’s immune system attacks healthy tissue, also known as systemic autoimmune rheumatic diseases (SARD). Examples of SARDs that cause inflammatory arthritis include rheumatoid arthritis (RA), systemic lupus erythematosus (SLE), Sjögren’s syndrome (SjS), systemic sclerosis (SSc), polymyositis (PM), and dermatomyositis (DM). Other types of inflammatory arthritis include axial spondyloarthritis (formerly called ankylosing spondylitis) and psoriatic arthritis, along with gout which is also considered a metabolic arthritis and discussed under it's own heading.
As a group, inflammatory arthritic diseases are characterized by joint pain, swelling, warmth, and tenderness in joints, and can cause deformity and loss of function of affected joints. Since these diseases are systemic, they may be associated with involvement of other tissues or organs including the skin, eye and bowel. In addition, in these diseases, blood tests provide evidence of inflammation and some conditions are useful markers that assess disease likelihood. Inflammatory arthritis conditions are sometimes difficult to diagnose and distinguish; all patients suspected of having an inflammatory arthritis should be referred to a rheumatologist for evaluation and management. Arthritis occurring in children and adolescents is referred to as juvenile idiopathic arthritis (formerly juvenile rheumatoid arthritis) and is discussed in the Juvenile Arthritis [401] heading.
Only the most common inflammatory arthritides will be discussed below. A listing of the many types of inflammatory arthritis and related conditions can be seen by clicking HERE [576].
Rheumatoid arthritis (RA) is a systemic autoimmune disease that produces inflammatory arthritis (stiff, painful, swollen joints, usually symmetrical). Rheumatoid arthritis is a form of polyarthritis and involves many joints, both large and small; it can also affect the cervical spine. Over time, RA can affect other organs (eg, eyes, lungs) and can lead to increased risk of cardiovascular disease.1
Rheumatoid arthritis is a chronic condition and, while it may occur acutely in some patients, onset is usually gradual. It can take months before a patient seeks medical attention, usually when joint pain (arthralgia) progresses to swelling and tenderness of the joint. As a systemic disease, RA is associated with symptoms such as fatigue, weight loss, and depression. In RA, inflammation of the joint can lead to erosion or damage of cartilage and bone and eventual deformity. The patient with RA characteristically produces autoantibodies called rheumatoid factors and anti-CCP. Anti-CCP (cyclic citrullinated peptide) antibodies are directed to proteins that have a modified amino acid called citrulline. These antibodies occur in approximately 70-80% of patients and are important for diagnosis and early recognition.
Rheumatoid arthritis was historically categorized based on the American Rheumatism Association Functional Class and Anatomic Stage, both proposed by Dr. Otto Steinbrocker in 1949. The former was updated by the American College of Rheumatology (ACR) in 19922 as follows:
Class I: Patient able to perform usual activities of daily living (self-care [dressing, feeding, bathing, grooming, and toileting], vocational [work, school, or homemaking] and avocational [recreational and/or leisure])
Class II: Able to perform usual self-care and vocational activities, but limited in avocational activities
Class III: Able to perform usual self-care activities but limited in vocational and avocational activities
Class IV: Limited in ability to perform usual self-care, vocational and avocational activities.
The revised classes were validated in a study of 325 patients using the Health Assessment Questionnaire (HAQ): mean HAQ disability index scores were Class I = 0.33, Class II = 1.02, Class III = 1.70 and Class IV = 2.67.
It is currently the usual practice to consider staging RA based on duration of signs and symptoms and the presence of autoantibodies and radiographic erosions. Hence, as currently defined by the ACR, RA is classified as follows:
Early RA = Signs and symptoms of < 6 months duration
Established RA = Signs and symptoms of ≥ 6 months duration or meeting the 1987 classification criteria
Seropositivity = presence of either rheumatoid factor (RF) or anti-citrullinated peptide antibodies (ACPA). Presence of erosions on radiographs of the hands/wrists.
In addition, one considers the level of disease activity at the time of the patient’s visit to inform treatment decisions. Several reliable and valid instruments are available for this purpose; most useful are the Disease Activity Score 28 [577] using either the erythrocyte sedimentation rate or the C-reactive protein marker, the Simplified Disease Activity Index [578], or the Clinical Disease Activity Index [579]. The latter does not require obtaining any laboratory tests to measure acute phase reactants. The ACR has published recommendations for the management of RA based on the above parameters, especially disease duration and disease activity.3
Although there is no cure for RA, early identification and treatment is important since current therapy can lead to significant improvement and reduce the likelihood for joint damage and progression to deformity. Therapy for RA involves a large group of medications that decrease inflammation and modify the course of disease. These agents are called DMARDS (disease modifying antirheumatic drugs) and have led to important improvement in overall outlook.
Prevalence of Rheumatoid Arthritis
As noted earlier in this report, clinical data are required to provide validity for estimating the prevalence of specific types of arthritis because the exact type of AORC causing pain and swelling is often unclear from observation. Prevalence of RA in the US is estimated to be between 1.3 and 1.5 million persons,4,5,6 roughly 0.50% of the adult population. Prevalence varies by sex, affecting 0.29%-0.31% of males and 0.73%-0.78% of females.6Also note that prevalence varies by age with highest ratios in older adults aged 65 years and older and lower ratios in declining 10-year age groups. The estimated prevalence of RA in the US population age 60 years and older is 2%.7
Healthcare Utilization
Rheumatoid arthritis effects overall health but may not be identified as the condition for which a patient is hospitalized. The NIS includes a separate variable identifying comorbidities of patients. Analyzing this variable, RA was identified as a comorbidity in 821,100 hospital discharges, or 2.7% of all hospital discharges, in 2013. However, when discharges were analyzed using the ICD9-CM codes, RA was diagnosed in only 512,600 discharges, or 1.7% of discharges for any diagnoses. Comorbidity designations are not made for all inpatients. Overall, 61% of discharges with RA diagnosed as a comorbidity also had an admitting diagnosis of RA, leaving two in five (39%) diagnosed with RA as a comorbidity but hospitalized for another cause. Common other forms of arthritis and associated diseases with RA as a comorbid condition include lupus (SLE) and fibromyalgia. (Reference graphs G3C.2.1.1 and G3C.2.1.2)
 [581]
[581]
 [583]
[583]
As previously noted, RA was diagnosed in slightly more than one-half million hospitalizations in 2013, representing 1.7% of discharges for any diagnoses. This is compared with the general prevalence rate of approximately 0.5%. Mean length of hospital stay and mean hospital charges were slightly higher than for all hospital discharges (106% and 109%, respectively). Nearly half (45%) of discharges with an RA diagnoses were dischared to additional care (short-term or home health), compared with 33% for all diagnoses discharges. (Reference Table 3A.3.1.0.1 PDF [416] CSV [417]; Table 3A.3.1.1.1 PDF [428] CSV [429]; Table 3A.3.1.3.1 PDF [441] CSV [442])
 [585]
[585] Rheumatoid arthritis was the first diagnoses recorded in 1.4% of total hip replacements and 0.3% of total knee replacements in 2013. (Reference Table 3A.5.3 PDF [568] CSV [569])
For RA, females outnumbered males three to one. Most RA hospitalizations occurred in those aged 65 years and older at a rate of 0.7 adults in 100 for this age group. No differences in rates were found by race/ethnic or regional group. (Table 3A.3.1.0.1 PDF [416] CSV [417]; Table 3A.3.1.0.2 PDF [418] CSV [419]; Table 3A.3.1.0.3 PDF [420] CSV [421]; Table 3A.3.1.0.4 PDF [422] CSV [423])
Rheumatoid arthritis was diagnosed in 6.4 million ambulatory visits and accounted for 0.7% of ambulatory care visits with an arthritis diagnosis, compared with the 0.5% prevalence rate in the US population. An RA diagnosis was made in 0.6% of physician office visits and ER visits; 0.8% of outpatient visits had a RA diagnosis. (Reference Table 3A.3.2.0.1 PDF [451] CSV [452]; Reference Table 3A.3.2.1.1 PDF [467] CSV [468]; Table 3A.3.2.2.1 PDF [475] CSV [476]; and Table 3A.3.2.3.1 PDF [485] CSV [486])
The distribution of ambulatory care visits by select demographic characteristics, when compared to all ambulatory visits for RA, was highest among females, and lowest among those younger than age 44 and among Black non-Hispanic and Hispanic racial/ethnic groups. (Reference Table 3A.3.2.0.1 PDF [451] CSV [452]; Table 3A.3.2.0.2 PDF [453] CSV [454]; Table 3A.3.2.0.3 PDF [455] CSV [456]; Table 3A.3.2.0.4 PDF [457] CSV [458])
 [587]
[587]
Economic Burden
Estimates were calculated from 2008-2012 Medical Expenditures Panel Survey (MEPS) data; analysis was limited to those years because the ICD-9-CM code for RA was suppressed in the 2013 and 2014 MEPS data. MEPS respondents were classified as having RA if they met the following criteria: had a record with ICD-9-CM code 714, self-reported having ever been diagnosed with RA, and had at least five prescriptions or ambulatory care visits for RA. In the 2008–2012 period, each year, an estimated 1.7 million adults (0.8% of US adult population) had RA. Although slightly higher than the 1.3 million to 1.5 million previously cited by other sources, the numbers provide a similar rate of RA in the adult population.
Combining direct and indirect costs for RA, total average costs annually for the years 2008-2014 were $46 billion, with incremental costs, those costs directly associated with RA, of $21.6 billion. (Reference Table 8.13 PDF [554] CSV [555])
Annual average per person all-cause (diagnosis of RA along with other health condition diagnoses) medical expenditures for RA were $19,040. Across selected characteristics, the five groups with the highest all-cause per person costs were those who were college graduates ($25,526); had any limitation in work, housework, or school activities ($25,220); lived in the Northeast ($24,038); Hispanics ($22,871), and those with any limitation in IADLS, ADLs, functioning, work, housework, school, vision or hearing ($21,858). Lowest per person costs were among the uninsured ($8,674) and across the remaining subgroups, average per person costs were at least $14,387.
Total all-cause medical expenditures were $32.9 billion. Total costs include ambulatory care, inpatient care, prescriptions filled, and residual costs (ER, home health, medical devices).
 [589]
[589]
 [591]
[591] For incremental medical expenditures (expenditures directly attributed to RA), mean per person expenditures for RA averaged $7,957 for the years 2008-2012. Aggregate medical expenditures (combined cost for all persons) in the United States for RA averaged $13.8 billion in each of the years of 2008-2012. (Reference Table 8.13 PDF [554] CSV [555] and Table 8.23 PDF [592] CSV [593])
The ratio of persons in the labor force without RA is higher than for those with RA in the general population, resulting in earnings losses due to RA. Among the estimated 900,746 working age adults (18-64 years) with a work history and RA, 56.1% had worked during the year compared with 87.9% of those without RA. Each year, those with RA earned, on average, $14,542 less than those without RA, which among all adults with RA totaled $13.1 billion.
For incremental medical expenditures, mean per person earnings losses attributed to RA averaged $8,748 per year in 2008-2012. Aggregate earnings losses for the United States due to RA averaged $7.9 billion in each of the years of 2008-2012. (Reference Table 8.13 PDF [554] CSV [555] and Table 8.23 PDF [592] CSV [593])
 [595]
[595] The cost of treating RA can be high. Older treatments of NSAIDS (aspirin, ibuprofen, naproxen, and celecoxib) and analgesics (acetaminophen, morphine, oxycodone) are readily available and inexpensive. However, many who suffer from RA cannot tolerate these drugs or they do not suppress the pain. A second level of drugs, the DMARDs (disease-modifying antirheumatic drugs) designed to reduce symptoms and damage, have become more affordable than previously, but still cost between $1,500 and $2,000 annually.
The newest level of drugs, the biologics, remain very expensive. Biologics are genetically engineered proteins originating from human genes targeting specific parts of the immune system that fuel inflammation. The first biologic, etanercept (Enbrel), was approved in 1998, and was used to treat RA. Actual cost estimates have a wide range, an average $18,000 to $100,000 annually, depending on the type of biologic used.8,9,10,11 In addition, because most are administered through an IV or injection administered by a healthcare professional, there are additional costs. Higher medication costs have been found to be associated with age and comorbidities.12
Spondyloarthropathy (SpA) refers to a family of inflammatory arthropathies that primarily affect the vertebral column. This group differs from other types of arthritis, especially rheumatoid arthritis, in that, rather than primarily affecting the synovial lining tissue in the joints, it involves the connective tissue where the tendons and ligaments attach to bone (entheses). Furthermore, patients with these disorders usually have negative tests for both rheumatoid factor and antibodies to citrullinated peptides (autoantibodies seen in the majority of patients with RA), often have radiographic involvement of the sacroiliac joints, and may have ocular inflammation (i.e., acute iritis or uveitis). Symptoms are often termed inflammatory back pain which is gradual in onset, worse in the morning and improves with activity. Inflammation can also affect the large joints of the lower extremities, including the knees and ankles. In the spondyloarthropathies, sacroiliac joints can fuse, and new bone can form between vertebrae. This leads to ankylosing and can cause deformity of the spine. In some patients, the spine can become rigid.
Among the conditions included in the SpA family, axial spondyloarthritis (formerly known as ankylosing spondylitis [AS]) is the most common and refers to inflammation of the spine or one or more adjacent structures of the vertebrae. Axial spondyloarthritis causes inflammation of the tissues in the spine and the root joints (shoulders and hips) and may be associated with peripheral arthritis. Over time, patients can undergo fusion of the vertebrae, limiting movement. Axial spondyloarthritis has a hereditary component and runs in families. It affects males more than females and can occur at any age. Patients with SpA frequently have a genetic marker called HLA B27. Since HLA B27 occurs commonly in the otherwise healthy population (approximately 8% of the US), it is not used as a specific diagnostic marker. HLA B27 is less common in African Americans.
In addition to AS, the more common diseases in the (SpA) family are:
• Reactive arthritis (formerly known as Reiter’s syndrome), a reaction to an infection in another part of the body;
• Psoriatic arthritis, which can occur in people with the skin disease psoriasis; and
• Enteropathic arthritis/spondylitis, a form of chronic inflammatory arthritis associated with inflammatory bowel diseases such as ulcerative colitis and Crohn’s disease. Enteropathic arthritis may be designated as axial (low back pain due to ankylosing spondylitis) or peripheral (joint involvement).
While some patients with psoriatic arthritis have a spondyloarthritis, in others, the involvement is primarily in peripheral joints. Psoriatic arthritis can resemble RA, but tests for rheumatoid factor and anti-CCP will be negative.
Prevalence of Spondylarthropathies
The prevalence of SpA in the US is difficult to determine as the diseases affect ethnic groups differently. Estimates of prevalence for SpA are 0.01%-2.5%.1,2 Current estimates of prevalence of the more common diseases are:
• Ankylosing spondylitis, 0.2%-1.7%1,2,3,4
o Axial SpA, 0.9%-1.4%2,3,4,5,6
o Advanced AS, 0.52%-0.55%2
• Psoriatic arthritis, 0.1%-0.4%1
• Reactive arthritis, no estimate found
• Enteropathic peripheral arthritis, 0.065%1
• Enteropathic axial arthritis, 0.05%-0.25%.1
Healthcare Utilization
Spondyloarthropathy was diagnosed in about one-half million hospitalizations in 2013, representing 1.6% of hospital discharges for all diagnoses, a higher proportion than prevalence in the population (1.6% of discharges vs 1.0%). No differences were found by sex, race/ethnicity, or geographic region, but age was a factor in the rate of hospitalizations for SpA. (Table 3A.3.1.0.1 PDF [416] CSV [417]; Table 3A.3.1.0.2 PDF [418] CSV [419]; Table 3A.3.1.0.3 PDF [420] CSV [421]; Table 3A.3.1.0.4 PDF [422] CSV [423])
Among those with a diagnosis of SpA, hospital discharge rates showed higher mean charges ($60,000 per SpA discharge versus $43,000 for any diagnoses) for a similar mean length of stay (4.6 days versus 4.7 days). Discharges from the hospital to additional care (short-term or home health) was slightly higher for persons with a diagnois of SpA (40%) than for all diagnoses discharges (31%). (Reference Table 3A.3.1.1.1 PDF [428] CSV [429]; Table 3A.3.1.3.1 PDF [441] CSV [442])
 [599]
[599]
Spondylarthropathies accounted for 0.7% of all diagnoses ambulatory care visits. Males were slightly more likely (0.8%) to receive ambulatory health care for SpA than females, along with those age 45 to 64 years (1.0%) and those living in the South (0.9%). (Reference Table 3A.3.2.0.1 PDF [451] CSV [452]; Table 3A.3.2.0.2 PDF [453] CSV [454]; Table 3A.3.2.0.3 PDF [455] CSV [456]; Table 3A.3.2.0.4 PDF [457] CSV [458])
 [601]
[601]
Economic Burden
Economic burden was not calculated by the BMUS project for spondyloarthropathies due to sample sizes. One study cited mean annual direct medical costs for AS of $6,500.7
Several published studies have explored the medication cost of biologics. For AS, biologic cost ranged from $1,200 to $24,200; for PSA ranged $14,200 to $32,000.7,8,9
Connective tissue disorders (CTDs) are part of the systemic autoimmune rheumatic diseases (SARD) grouping of disorders and include systemic lupus erythematosus (SLE or lupus), systemic sclerosis (SSc or scleroderma), inflammatory myositis (polymyositis and dermatomyositis), and Sjögren syndrome (SjS). They are characterized by a heterogeneous group of immune-mediated inflammatory signs and symptoms affecting multiple organ systems, including the joints.
Prevalence of Connective Tissue Disorders
The prevalence of syndromes in the CTD family are difficult to identify, and vary depending on the study duration, classification criteria, and the country in which the study was undertaken. Current estimates are based on special populations and primarily use several CDC-funded state registries. Connective tissue disorders affect all ages, but incidence is higher among women than men by a factor of at least 4:1, with estimates as high as 12:1 for SLE.1,2 Lupus generally begins during women’s children bearing years and can lead to serious kidney involvement among other complications.
The highest prevalence is for SjS, ranging between 0.5% and 3% of a given demographic population.1 Estimates of overall prevalence range from 400,000 to 3.1 million US adults.3
Recent national estimates of prevalence and incidence of SLE in the US are not available, but it is relatively uncommon. Using older meta-analysis studies, prevalence of SLE is estimated between 15 and 50 per 100,000 individuals.1 The Lupus Foundation of America estimates a total of 1.5 million Americans have some form of lupus, with an incidence of 16,000 new cases per year.4
The prevalence of SSc, also known as scleroderma, is much lower and has been reported with an incidence of 20 per one million new cases per year and a prevalence of 240 per million US adults, based on a limited US population studies published in 2003.5,6 A more recent update did not find this estimate to be changed.7
Overall prevalence and incidence of CTD is not reported in the literature, as classification criteria are not defined.1 However, the economic analysis for this report places prevalence at 0.27% for the years 2008 thru 2014. (Reference Table 8.20 PDF [606] CSV [607])
Healthcare Utilization
Connective tissue disorders represented 1% of hospital discharges and total charges for all diagnoses hospital stays in 2013. Because of the very low incidence of CTD syndromes, the prevalence is estimated at 0.3 percent or less, with use of healthcare resources much higher than the incidence ratio. Although the share of hospital discharges is higher than the share of all ambulatory visits, the rate of hospital discharges per 100 adults is much lower than the rate of ambulatory visits. Mean length of hospital stay and mean hospital charges are slightly higher than the means for all diagnoses, but patients are generally discharged to home self-care. (Reference Table 3A.3.1.0.1 PDF [416] CSV [417]; Table 3A.3.2.0.1 PDF [451] CSV [452]; Table 3A.3.1.1.1 PDF [428] CSV [429]; Table 3A.3.1.3.1 PDF [441] CSV [442])
 [609]
[609] Hospitalizations for CTDs occurred primarily in females, those age 45-64 years, and non-Hispanic blacks compared to all diagnoses discharges. (Table 3A.3.1.0.1 PDF [416] CSV [417]; Table 3A.3.1.0.2 PDF [418] CSV [419]; Table 3A.3.1.0.3 PDF [420] CSV [421]; Table 3A.3.1.0.4 PDF [610] CSV [423])
 [612]
[612]
Connective tissue disorders accounted for 0.4% of all diagnoses for ambulatory care visits. The distribution of ambulatory care visits by select demographic characteristics, when compared to all ambulatory visits for CTDs, was highest among females and non-Hispanic blacks, and lowest among those aged 65 years and older and those living in the Midwest. Females accounted for nearly all ambulatory CTD visits. (Reference Table 3A.3.2.0.1 PDF [451] CSV [452]; Table 3A.3.2.0.2 PDF [453] CSV [454]; Table 3A.3.2.0.3 PDF [455] CSV [456]; Table 3A.3.2.0.4 PDF [613] CSV [458])
 [615]
[615]
Data from the MEPS, used exclusively in the economic analysis of this report, show higher levels of healthcare visits than the NIS and NAMCS. In particular, the number of ambulatory physician visits is much higher in the MEPS than in the NAMCS. Differences in how conditions are classified and data coded account for some of this, as does the inclusion of ambulatory visits in settings outside a physician’s office (eg, ER or outpatient clinic).
Based on the MEPS, most individuals with a CTD (93%) incurred one or more ambulatory physician visits; among all of those with CTD, the total number of ambulatory physician visits was 9.3 million visits (average visits per person=11.2) annually. Approximately two-thirds (67.9%) of those with CTDs had at least one non-physician care visit, which include physical therapists and alternative care. The average number of non-physician visits per person was 8.5, for a total of 7.0 million non-physician visits nationally. One in five (20.7%) individuals with a CTD were hospitalized and there were 300,000 hospitalizations among all people with CTDs, with an average of 0.4 hospitalizations per person. The percentage with home health care visits was lower (14.4%) than for the other types of visits. However, those with a CTD had an average of 17.1 home health care visits per year for a total of 14.2 million visits nationally. Furthermore, those who did have a home health visit had very high home health visit utilization, with an average of 119 visits annually (data not shown). Finally, almost all individuals with a a CTD filled a prescription medication (95.8%); the total number of prescription fills each year was 39.5 million, based on average prescription fills among all of those with CTD of 47.7 fills. (Reference Table 8.20 PDF [606] CSV [607])
Economic Burden
From 2008-2014, an estimated 800,000 individuals (0.27%) in the US population had a CTD annually. Across all age groups, middle age adults (45-64 years) represented the largest percentage of those with a CTD (52% or 430,000), followed by younger adults (18-44 years) (26% or 219,000 individuals), older adults (≥ 65 years) (21% or 173,000) and children (18 years) (1% or 8,000 individuals). These numbers translate into prevalence rates shown in the graph below. (Reference Table 8.19 PDF [616] CSV [617]; Table 8.21 PDF [618] CSV [619])
 [621]
[621] Females comprised the majority of those with a CTD (767,000); at least 400,000 individuals in the following groups had a CTD: those with any limitation in IADLS, ADLs, functioning, work, housework, school, vision, or hearing (597,000); non-Hispanic Whites (542,000); those with any private insurance (503,000); and those with any limitation in work, housework, or school activities (453,000). (Reference Table 8.21 PDF [618] CSV [619])
Among all individuals with a CTD, ambulatory care represented 32% of all direct costs, followed by inpatient care (28%), prescriptions (25%), and residual costs (15%). The distribution across service category varied substantially across socio-demographic and health status characteristics suggesting very different treatment and utilization patterns across these groups. For example, there were regional differences: among those in the Northeast, ambulatory care, inpatient care, prescriptions, and other costs represented 40%, 11%, 21%, and 28%, respectively whereas in the Midwest, these categories represented 25%, 24%, 44%, and 7% of all costs, respectively.
Among all individuals with a CTD, all-cause annual per person costs were $19,702. The five groups with the highest all-cause per person costs were those who were college graduates ($30,471), had public health insurance only ($29,579), lived in the Northeast ($27,349), had never married ($27,026), or reported any limitation in work, housework, or school activities ($27,024).
The five groups with the lowest all-cause per person costs were those with no health insurance ($5,631), lived in the Midwest ($11,821), were Non-Hispanic black ($14,564), had a high school education but no college education ($14,617), or were married/had a partner ($14,735). (Reference Table 8.21 PDF [618] CSV [619])
 [623]
[623]
 [625]
[625]
Indirect costs (earnings losses) were not calculated for CTDs due to small numbers of cases.
Gout is caused by a buildup in the body of uric acid, in the form of monosodium urate crystals that the body cannot rid itself of quickly. This condition is characterized by hyperuricemia, referring to an elevation in the serum level of uric acid. It is not fully understood why some people with hyperuricemia develop gout and others do not. Gout is characterized by recurrent attacks of painful, red, tender, warm, and swollen joints, which generally affects only one joint at a time, often the large toe. It is more common in men, but also affects women after menopause. Repeated flares of gout can lead to chronic gouty arthritis, with involvement of multiple joints and the development of subcutaneous nodules, called tophi. While gout can be an intermittent condition, it can also lead to severe chronic arthritis and joint damage and deformity. Gout occurs frequently in patients with what is termed the metabolic syndrome and affects patients who also have diabetes, hypertension, and obesity.
Other crystal arthropathies can be caused by deposits of calcium pyrophosphate dihydrate (CPPD) crystals in the joints and have symptoms similar to gout. CPPD deposition disease is less common than gout, although radiographic chondrocalcinosis is common in older adults.
Prevalence of Gout
Prevalence estimates of gout vary for the US from 1% - 4%, depending on the data source and time frame. In 2005, an estimated 6.1 million adults reported having gout at some time, with 3.0 million affected each year.1 Estimates from the MEPS analyzed for the economic data section reported 3.1 million US adults had gout annually for the years 2008-2012, an annual prevalence rate of 1.3%.(Reference Table 8.13 PDF [554] CSV [555] and Table 8.24 PDF [629] CSV [630]) Additional studies report a higher prevalence of 3.9%, or 8.3 million adults in 2007-2008, using the NHANES as the basis of estimates.2,3,4 Another NHANES study from 2007-2010 reported a prevalence of 3.8%.5 Overall, it is believed the prevalence of gout is rising, with obesity and hypertension cited as contributors.2,4 A study of hospitalization trends using the NIS from 1993-2011 supported this, showing hospitalizations with a diagnosis of rheumatoid arthritis declining over the study period while diagnosis of gout was reported as increasing.6
Prevalence of gout is higher in males than in females, 5.9% to 2.0%, respectively,4 or at a ratio of 3-4:1. The incidence of gout increases with age, and was shown in the MEPS to be higher in the following select socio-demographic groups: non-Hispanic whites (2.3 of 3.1 million); married/had a partner (1.9 million); any private insurance (2.0 million); those with any limitation in IADLs, ADLs, functioning, work, housework, school, vision, or hearing (1.7 million). (Reference Table 8.24 PDF [629] CSV [630]).
Healthcare Utilization
More than 850,000 hospitalizations in 2013 had a diagnosis of gout, representing 2.9% of hospitals visits for any diagnoses, and accounting for 3.3% of all hospital charges billed. Gout is diagnosed along with joint pain and soft tissue disorders when multiple diagnoses are made (7% and 3.5% cross-diagnosis, respectively). At discharge, patients diagnosed with gout are more likely to be transferred to short-term or home health care than those with any diagnoses (45% vs 31%). (Reference Table 3A.3.1.0.1 PDF [416] CSV [417]; Table 3A.3.0.2 PDF [408] CSV [409]; Table 3A.3.1.1.1 PDF [428] CSV [429]; Table 3A.3.1.3.1 PDF [441] CSV [442])
 [632]
[632]
Gout diagnoses were made in only 0.5% of ambulatory care visits for any diagnosis, accounting for 5.3 million ambulatory visits. Ambulatory visits were made more frequently by males (72%), those aged 65 years and older (50%), non-Hispanic whites (59%), and by those living in the Northeast (rate of 2.8/100 persons versus 2.1/100 for all regions). (Reference Table 3A.3.2.0.1 PDF [451] CSV [452]; Table 3A.3.2.0.2 PDF [453] CSV [454]; Table 3A.3.2.0.3 PDF [455] CSV [456]; and Table 3A.3.2.0.4 PDF [457] CSV [458])
 [634]
[634]
Economic Burden
Estimates for gout, defined as ICD-9-CM 274, were generated from 2008-2012 MEPS data; analysis was limited to those years because the ICD-9-CM code for gout was suppressed in 2013 and 2014 MEPS data. Combining direct and indirect costs for gout, total average costs annually for the years 2008-2012 were $26 billion. Incremental costs could not be calculated due to a small sample size. (Reference Table 8.13 PDF [554] CSV [555])
Among all adults with gout, all-cause per person direct costs were $11,936. Those with any limitation in work, housework, or school activities had the highest all-cause per person direct costs ($16,843) whereas those age 18-44 years had the lowest ($5,934). Total all-cause direct costs were $36.6 million. Direct costs attributable to gout were not reported because the relative standard errors for the estimates was greater than 30%. (Reference Table 8.13 PDF [554] CSV [555] and Table 8.24 PDF [629] CSV [630])
The percentage working during the year among adults age 18-64 years was similar for those with (85%) and without gout (88%). Per person, those with gout earned $6,810 more than those without gout; thus, overall, those with gout had negative earnings losses (aggregate of -10.0 billion). Like direct costs, earnings losses attributable to gout were not reported because the estimates were unreliable, with a relative standard error greater than 30%. (Reference Table 8.13 PDF [554] CSV [555]).
 [636]
[636]
Arthritis from joint infection, known by the umbrella term as septic arthritis, can occur from an infection anywhere in the body traveling through the bloodstream. It can also occur from a penetrating injury that delivers germs directly to a joint. An infected joint is usually very tender, swollen, and painful. When caught early and treated with antibiotics it can be cleared of the joint infection. Surgical drainage of the infected joint is often necessary which can be performed arthroscopically. In some cases, the arthritis becomes chronic. Knees are most commonly affected, but septic arthritis also can affect hips, shoulders, and other joints. Often, an infected joint has been affected by another form of arthritis. Gonococcal septic arthritis, transmitted from gonorrhea bacterium, a sexually transmitted disease, can occur in otherwise healthy individuals. Lyme disease is another form of arthritis associated with infection and occurs in certain areas of the country.
The incidence of septic arthritis in industrialized countries, including the US, is estimated at six (2-10) per 100,000 population per year. In persons with underlying joint disease or prosthetic joints, incidence increases to 6-30 per 100,000 per year. The most susceptible populations are young children and the elderly.1 Infection can occur in a prosthetic joint and be a source of chronic pain. Biologics, while shown to work well for RA and other inflammatory arthritis pain, have also been associated with statistically significant higher rates of serious infections as they are designed to weaken the immune system. Serious infections included opportunistic infections as well as bacterial infections in most studies.2 These side effects of increased risk for septic arthritis are recognized and published in numerous sources.
Septic arthritis is included in the “other specific rheumatic conditions” in the AORC discussion.
Fibromyalgia does not fit within the main arthritis classifications but is considered a chronic pain condition. The primary symptoms are widespread pain throughout the body and fatigue. Recent revisions to diagnosis now focus on four criteria.1
1) Generalized pain, defined as pain in at least 4 of 5 regions is present.
2) Symptoms have been present at a similar level for at least 3 months.
3) Widespread pain index (WPI) ≥7 and symptom severity scale (SSS) score ≥5 OR WPI of 4-6 and SSS score ≥9.
4) A diagnosis of fibromyalgia is valid irrespective of other diagnoses. A diagnosis of fibromyalgia does not exclude the presence of other clinically important illnesses.
The cause of fibromyalgia is not known, but current theories include a higher sensitivity to pain. Fibromyalgia can occur by itself, although it can also accompany another form of arthritis such as rheumatoid arthritis or spondyloarthritis.
Prevalence of Fibromyalgia
Estimates of fibromyalgia range from 4 million (2% of the adult population)2 to 10 million (5% of adult population).3 Fibromyalgia is most prevalent in females, with up to 90% of incident cases females. It is also more common among older members of the population.
Healthcare Utilization
Just under one-half million (442,000) hospitalizations in 2013 had a diagnosis of fibromyalgia, representing 1.5% of hospital visits for any diagnoses, and accounting for 1.4% of all hospital charges billed. Females accounted for 89% of the hospitalizations, with those age 45 to 64 accounting for nearly half (48%) of the discharges. Fibromyalgia is diagnosed along with connective tissue disease (11.1%), joint pain (8.2%), and rheumatoid arthritis (7.1%) when multiple diagnoses are made. Hospital stays are similar to discharges for any diagnoses in length of stay and mean charges. Discharge to home is most common. (Reference Table 3A.3.1.0.1 PDF [416] CSV [417]; Table 3A.3.1.0.2 PDF [418] CSV [419]; Table 3A.3.0.2 PDF [408] CSV [409]; Table 3A.3.1.1.1 PDF [428] CSV [429]; Table 3A.3.1.3.1 PDF [441] CSV [442])
Fibromyalgia diagnoses were made in 0.8% of all ambulatory care visits for any diagnosis, accounting for 7.7 million ambulatory visits. Ambulatory visits were made more frequently by females (79%), those aged 45-64 years (52%), non-Hispanic whites (74%), and by those living in the Northeast region (rate of 3.8/100 persons versus 3.1/100 for all regions). (Reference Table 3A.3.2.0.1 PDF [451] CSV [452]; Table 3A.3.2.0.2 PDF [453] CSV [454]; Table 3A.3.2.0.3 PDF [455] CSV [456]; and Table 3A.3.2.0.4 PDF [457] CSV [458])
 [640]
[640]
Economic Burden
Economic costs were not calculated for fibromyalgia.
Juvenile arthritis (JA) is an umbrella term used to describe a number of autoimmune and inflammatory conditions that can develop in children. It is the most common rheumatic disease of childhood, particularly in the Western world, with children of European descent reporting higher incidence rates.1,2
The most common form of JA is Juvenile Idiopathic Arthritis (JIA) (formally called juvenile rheumatoid arthritis (JRA) or Juvenile Chronic Arthritis (JCA)). JIA is diagnosed in a child <16 years of age with at least six weeks of persistent arthritis. There are seven distinct subtypes, each having a different presentation and association to autoimmunity and genetics.3 Subtypes also differ in typical age of onset. Certain subtypes are associated with an increased risk of inflammatory eye disease (uveitis).
Understanding the differences in the various forms of JIA, their causes, and methods to better diagnose and treat these conditions in children is important to future treatment and prevention. Among all subtypes, 40% to 45% of children with JIA still have active disease after 10 years.4
Prevalence Of Juvenile Arthritis
Due to the various forms of JA, estimates of prevalence and incidence are difficult to ascertain. Overall estimates are that 294,000 children in the United States have arthritis or another rheumatic disease.5
In 2006, the CDC Arthritis Program finalized a case definition for ongoing surveillance of significant pediatric arthritis and other rheumatologic conditions (SPARC [643]) using the current ICD-9-CM diagnostically based data systems. In response to the variations in conditions that some felt should be included, but were not, CDC generated estimates for conditions that were not included in the case definition but were felt by some should have been.
Healthcare Utilization
Using the SPARC definitions, analysis of the recent national healthcare database focusing on children, the Healthcare Cost and Utility Project (HCUP) KID, showed 104,400 children age 17 and younger were discharged from a hospital with any diagnosis of SPARC in 2012. Of those, 15,600, or 15%, had an admitting diagnosis of SPARC. Slightly more females than males were hospitalized; children age 6 and younger were more likely to be hospitalized with an admitting diagnosis of SPARC than older children, accounting for 40% of admissions.
Only a small number of children (3.8%) discharged with any diagnosis of SPARC had a diagnosis of juvenile arthritis. Females accounted for 72% of discharges with a diagnosis of JIA, with 62% of the discharges for children age 13 to 17 years.
Average hospital stays of eight days were found for any diagnosis of SPARC. The very youngest children, babies under age one, had much longer stays and higher mean hospital charges. Children with a diagnosis of JIA had hospital stays of a mean of 4.6 days, with subsequently lower mean charges.
Total hospital charges associated with any diagnoses of SPARC in the population younger than age 20 were $8.3 billion in 2012. (Reference Table 3B.1 PDF [644] CSV [645])
 [647]
[647] Emergency rooms saw 515,600 patients ages 0 to 17 with any diagnoses of SPARC in 2013. Among these patients, 6,900 had a primary diagnosis of JIA. Visits did not show major differences by sex or age.
Due to smaller sample sizes in the currently available databases for physician office visits and outpatient clinics, outpatient visits for a diagnosis of SPARC in the juvenile population are difficult to quantify. In 2013, physician visits for treatment of JA numbered 1.2 million. As with ED visits, major differences by sex or age were not seen. Due to small sample sizes, the number of visits with a diagnosis of JIA was unreliable.
Outpatient clinics saw 305,100 patients in 2011, the most recent year for outpatient data available. Patterns for distribution reflected that of other treatment sites. Due to small sample sizes, the number of visits with a diagnosis of JIA was unreliable.
From these data, an estimated 2.03 million outpatient visits for any diagnoses of SPARC occurred in the 0 to 17 years age population in 2013. (Reference Table 3B.1 PDF [644] CSV [645])
 [649]
[649]
ICD-9-CM Codes for SPARC
In 2006, the CDC Arthritis Program finalized a case definition for ongoing surveillance of significant pediatric arthritis and other rheumatologic conditions (SPARC) using the current ICD-9-CM diagnostically-based data systems.
099.3 - Reactive arthritis
136.1 - Behcet's syndrome
274 - Gout
277.3 - Amyloidosis (includes Familial Mediterranean Fever)
287.0 - Allergic purpura / Henoch Schonlein purpura
390 - Rheumatic fever without heart involvement
391 - Rheumatic fever with heart involvement
437.4 - Cerebral arteritis
443.0 - Raynaud's syndrome
446 - Polyarteritis nodosa and allied conditions
447.6 - Arteritis, unspecified
695.2 - Erythema nodosum
696.0 - Psoriatic arthropathy
701.0 - Linear scleroderma / Circumscribed scleroderma / Morphea
710 - Diffuse diseases of connective tissue
711 - Arthropathy associated with infections
712 - Crystal arthropathies
713 - Arthropathy associated with other disorders classified elsewhere
714 - Rheumatoid arthritis and other inflammatory polyarthropathies
715 - Osteoarthritis and allied disorders
716 - Other and unspecified arthropathies
719.2 - Villonodular synovitis
719.3 - Palindromic rheumatism
720 - Ankylosing spondylitis and other inflammatory spondylopathies
727.0 - Tenosynovitis
729.0 - Rheumatism, unspecified and fibrositis
729.1 - Myalgia and myositis, unspecified
Joint pain is a major symptom of arthritis and non-arthritis conditions and a primary reason for seeing a medical care provider. Self-report surveys ask about joint pain but do not distinguish the cause of joint pain, which may be from arthritis, injuries, or degeneration of bone surfaces.
In 2013-2015, chronic joint pain was self-reported in the National Health Interview Survey (NHIS) by 78.9 million adults, among which 40.2 million also reported doctor-diagnosed arthritis (DDA) and 29.1 million reported activity limitations due to arthritis (AAAL). Because the latter two groups are not mutually exclusive, 30.4 million, or about 13% of the total population, have chronic joint pain but no DDA or AAAL. (Reference Table 3A.2.0 PDF [652] CSV [653])
The most common site of chronic joint pain reported by adults with DDA is the knee, reported by nearly 1 in 2 adults. Pain in the shoulder, finger, and/or hip is reported at each site by more than 1 in 4 adults with DDA. While 40% of people with DDA report joint pain in only one site, more than 20% report pain in four or more sites. (Reference Table 3A.2.1.1 PDF [654] CSV [655] and Table 3A.2.1.5 PDF [656] CSV [657])
Among adults with DDA, joint pain occurs in females more frequently than males, and in middle age more frequently than younger or older ages. Joint pain was similar by race/ethnicity and region. (Reference Table 3A.2.1.1 PDF [654] CSV [655]; Table 3A.2.1.2 PDF [658] CSV [659]; Table 3A2.1.3; PDF [660] CSV [661]; and Table 3A.2.1.4 PDF [662] CSV [663])
 [665]
[665]
Joint Replacement
While in some sense, the need for a joint replacement represents failure of measures to prevent the occurrence or progression of joint problems, for those with the severe pain or poor function of end-stage joint problems, it can offer a life-altering “cure.” Joint replacements represent one of the fastest growing procedures in the US. Joint replacement procedures for hips and knees are most common, but replacements have been expanding to other joint sites in recent years.
Estimates presented come from the Healthcare Cost and Utility Project (HCUP) Nationwide Inpatient Sample (NIS). In previous editions of BMUS, estimates from the National Hospital Discharge Survey (NHDS) were also presented and are found in two tables showing trends on mean age of joint replacement patients and average length of hospital stay. The NHDS is no longer produced and not otherwise used here.
In 2013, an estimated 1.3 million inpatient joint replacement procedures were performed. Joint replacement procedures comprised about 3.6% of all inpatient procedures. More joint replacements were performed on women than men (60% vs 40%), and 95% of the procedures were performed on knees or hips. (Reference Table 3A.5.1.1 PDF [666] CSV [667])
 [669]
[669] In 2013, nearly 723,000 knee replacement procedures were performed in the U.S., comprising 56% of all joint replacement procedures. Over 90% were total knee replacements, but 8% were revision knee replacements, which occur when the original replacement fails or becomes infected. Three in five knee replacements (62%) occurred in females. More than one-half (57%) of knee replacement procedures were performed on those aged 65 years and older, but a substantial proportion (41%) were performed on persons aged 45 to 64 years. The majority (77%) of knee replacements were performed on non-Hispanic whites, with a proportion more than twice that of other racial/ethnic groups. The ratio of knee replacements to total population is higher in the Midwest region (27.2% of replacements vs. 21.4% of population) than other regions, with the Northeast having the lowest ratio of procedures (16.9% vs. 17.7%). (Reference Table 3A.5.1.1 PDF [666] CSV [667]; Table 3A.5.1.2 PDF [670] CSV [671]; Table 3A.5.1.3 PDF [672] CSV [673]; and Table 3A.5.1.4 PDF [674] CSV [675])
Trends in knee replacement procedures from 1992 to 2013 show steady increases in both total and revision knee replacements. Over the 22-year period, knee replacement procedures more than tripled, with the ratio of revisions to total remaining constant at 8% to 10%. (Reference Table 3A.5.2 PDF [676] CSV [677]).
 [679]
[679] The principal or first diagnosis associated with total knee replacement is osteoarthritis, accounting for 98% of all replacements in 2013. (Reference Table 3A.5.3 PDF [568] CSV [569]).
The 22-year mean age from 1992 to 2013 was nearly 68 years for total knee replacements, and about half a year younger for revision knee replacements. The mean age for both procedures shows a slow decline over time. (Reference Table 3A.5.4 PDF [680] CSV [681])
The average inpatient length of stay for total knee replacements has shown a remarkable decline of about 67% from a mean of nearly 8.9 days in 1992 to a mean of 3.4 days in 2013. (Reference Table 3A.5.5 PDF [682] CSV [683]).
 [685]
[685] Despite shorter hospital stays, the mean hospital charges from 1998 through 2013 showed a steady increase for all knee replacements, with revision knee replacement being more expensive than total knee replacement. Total hospitalization charges for both types of knee replacements have increased by five times over (in constant 2013 dollars) from $8.4 billion in 1998 to $41.7 billion in 2013. (Reference Table 3A.5.6 PDF [686] CSV [687])
 [689]
[689] Most adults (72%) with knee replacements are discharged to either short- or long-term care or home health care, likely due to the short hospital stay. Among persons aged 65 and older, a slightly higher proportion are discharged to either short- or long-term care or home health care (77%). (Reference Table 3A.5.7 PDF [690] CSV [691])
An estimated 493,700 hip replacement procedures were performed in 2013, comprising 39% of all joint replacement procedures. A majority, about 58%, occurred in females. Total hip replacements occurred three times as frequently as partial hip replacements, and both are far more common than revision hip replacement. A very small number of procedures, about 3,700 in 2013, were hip resurfacing, an alternative to replacement, particularly for young, active males. Females have more hip replacement procedures than males, particularly partial replacements. Hip replacements were more common among adults aged 65 years and older (61%), with most of the rest occurring among adults aged 45 to 64 years. Hip replacements by race/ethnicity paralleled that for all joint replacements, as did hip replacements by geographic region. (Reference Table 3A.5.1.1 PDF [666] CSV [667]; Table 3A.5.1.2 PDF [670] CSV [671]; Table 3A.5.1.3 PDF [672] CSV [673]; and Table 3A.5.1.4 PDF [674] CSV [675])
Trends in hip replacement procedures from 1992 to 2013 show total hip replacements increasing in number by 150%, while the number of partial replacements remained relatively stable. The ratio of revision hip to total hip replacements was about 20% from 1992 to 2002, but has consistently been around 17% since then, and dropped to 15% in 2013. (Reference Table 3A.5.2 PDF [676] CSV [677])
 [693]
[693] The principal or first listed diagnosis associated with total hip replacements was osteoarthritis (87%). The primary diagnosis for partial hip replacements was fractures (94%). (Reference Table 3A.5.3 PDF [568] CSV [569])
The 22-year mean age was about 66 years for total hip replacements and 77 years for partial hip replacements, reflecting the different underlying diagnoses. Mean ages for both procedures show a slight decline over the time period, reflecting the younger age at which joint replacements are now considered. However, in 2013, the mean age for partial hip replacements jumped to 80. (Reference Table 3A.5.4 PDF [680] CSV [681])
The mean length of stay for total hip replacements (3.0 days in 2013) showed the same remarkable decline as that for knee replacements--about 67% from 1992 through 2013. The mean lenth- of-stays for partial and revision replacements are longer, with about a 50% decline over the 22-year period. (Reference Table 3A.5.5 PDF [682] CSV [683])
 [695]
[695] Despite shorter hospital stays, mean hospital charges from 1998 through 2013 steadily increased for all hip replacements even when compared in constant 2013 dollars. Revision hip replacements are the most expensive, while total hip replacements are the least expensive. Total hospital charges for all hip replacements have tripled (in constant 2013 dollars) from $9.25 billion in 1998 to $30.7 billion in 2013, led by charges for total hip replacements. (Reference Table 3A.5.6 PDF [686] CSV [687])
 [697]
[697]
Shoulder replacement procedures accounted for an estimated 45,000 procedures in 2013, comprising about 4% of all joint replacement procedures. At the same time, an estimated 19,000 other joint replacement procedures were performed for other joints in the upper and lower extremities, and the spine. More than with hip and knee replacements, these other joint replacement procedures occurred somewhat equally between females and males, and were more evenly divided between those aged 44 to 64 and those aged 65 years and older, except for shoulder replacements. Race/ethnicity and geographic regions resembled the distribution of all joint replacements. (Reference Table 3A.5.1.1 PDF [666] CSV [667]; Table 3A.5.1.2 PDF [670] CSV [671]; Table 3A.5.1.3 PDF [672] CSV [673]; and Table 3A.5.1.4 PDF [674] CSV [675])
 [699]
[699] A recent study released by the CDC Arthritis Workgroup1 reported state-level arthritis prevalence estimates for the first time. Using the 2015 Behavioral Risk Factor Surveillance System (BRFSS) self-reported doctor-diagnosed data, age-adjusted for comparison across states, the median prevalence among adults across the 50 states and District of Columbia was 23.0%. State prevalence ranged from 17.2% in Hawaii to 33.6% in West Virginia. When viewed by states in the four regions used in this report, 75% of states in the South had an age-adjusted prevalence rate above that of the national rate of 23.0%. This compares to 40% in the Northeast, 42% in the Midwest, and 31% in the West. Furthermore, five states in the South (West Virginia, Alabama, Tennessee, Kentucky, and Arkansas) and two in the Midwest (Michigan and Missouri) had a majority of counties with an arthritis prevalence rate in the highest quartile (31.2%-42.7%). A summary of state age-adjusted doctor-diagnosed arthritis prevalence rates can be found by clicking HERE [700].
The study also looked at doctor-diagnosed arthritis prevalence among adults with three comorbid conditions. At 44.5%, prevalence of arthritis was highest among those with coronary heart disease. This was followed by adults with diabetes (37.3%) and obesity (30.9%).
Leisure-time physical inactivity was also analyzed, and the median age-standardized percentage of inactive adults with arthritis was 35.0%. States in the western region tended to have the lowest prevalence of leisure-time physical inactivity with arthritis, while states in Appalachia and along the Ohio and Mississippi Rivers had the highest percentage of leisure-time physical inactivity, following the overall state prevalence rates for arthritis.
Findings from this study showed that estimated prevalence of arthritis varies by geographic area, with correlation to comorbid conditions and negative health-related characteristics. While direct causation cannot be made and further study is needed to understand why these geographic differences occur, the authors have postulated that known risk factors for arthritis such as comorbid conditions, occupation, socioeconomic status, and negative health-related characteristics may contribute. Access to medical care and medications may also be factors.
The full study of arthritis prevalence by state can be found at https://www.cdc.gov/arthritis/data_statistics/state-data-current.htm [701].
The CDC has also produced estimates of arthritis prevalence by race/ethnicity2 based on the NHIS 2013-2015 data. The lowest prevalence rate was found among non-Hispanic Asians (11.8%), with non-Hispanic multi-racial adults having the highest rate (25.2%). Among adults with arthritis, non-Hispanic Asians also reported the lowest prevalence of arthritis-attributable activity limitations (37.6%), while American Indian/Alaska Natives reported the highest prevalence of limitations (51.5%).
 [703]
[703]
While medical professionals in many specialities and with a range of credentials treat patients with arthritis, those specializing in rheumatology are often at the frontline. A recently published workforce study by the American College of Rheumatology highlighted significant disparities in access to care within geographic regions of the US. Their findings showed access to care (defined as the ratio of adult rheumatology physicians to adult population) to be easiest in the Northeast (26,677 ratio) and most difficult in the Southern states (66,163 in the Southwest and 60,087 in the Southeast). This compares to a national average of rheumatologists per population of 41,658.3 Comparing this finding to the number of hospitalization and ambulatory healthcare visits, the highest number of visits, or need for care, was in the South. Furthermore, the study cited above reported the highest arthritis prevalence in the South.
In addition to regional differences, access to care based on population size is also the norm, as patients in areas with less than 50,000 population often must travel 200 or more miles to see a rheumatologist. The ratio of pediatric rheumatologists is much higher (229,442 children/physician), and it is estimated that only one-quarter of those aged 18 or younger with juvenile arthritis are currently able to see a rheumatologist.3
There are many challenges to the management of patients with arthritis that need to be addressed in the future, including, but not limited to, access to specialty care for timely and accurate diagnosis, appropriate use of non-pharmacologic modailities and pharmacotherapy, including targeted small molecule and newer biologic disease modifying anti-rheumatic drugs (DMARDs), adherence to pharmacotherapy, and addressing comorbid medical conditions in patients with various forms of arthritis.
The American College of Rheumatology (ACR) conducted a workforce study in 2015 and noted that the demand for care of patients with arthritis would continue to increase with the aging of the US population.1 Major areas that were identified include the role of primary care providers in the diagnosis and management of common forms of arthritis (eg, osteoarthritis, fibromyalgia, gout) and strategies to improve options for access to rheumatologist specialty care for patients with rheumatoid arthritis, psoriatic arthritis, spondyloarthritides, and systemic autoimmune rheumatic diseases. Training of more mid-level providers (ie, nurse practitioners and physician assistants) and more health professionals (eg, nurses, physical therapists, and occupational therapists) in the care of patients with rheumatic and musculoskeletal diseases would work to address some of this demand.
In addition to issues regarding workforce, there are potential barriers to care including insurance coverage, high co-pays, and limits on number for visits for rehabilitation services such as physical therapy and occupational therapy. Adding to the cost of non-pharmacologic and pharmacologic interventions, especially newer biologic DMARDS, and pharmacy benefit reimbursement plans, are barriers due to high co-pays and prior authorization required for newer pharmacologic interventions.
Funding of clinical trials to provide best evidence of the efficacy of treatment modalities, including non-pharmacologic interventions is needed. It is extremely important that evidence-based treatments be translated into clinical practice through the use of evidence-based recommendations published by nationally recognized professional societies. Such recommendations exist for the management of most forms of arthritis including, but not limited to, gout, osteoarthritis, rheumatoid arthritis, axial spondyloarthritis (formerly known as ankylosing spondylitis), psoriatic arthritis, and fibromyalgia. These recommendations include the use of both non-pharmacologic and pharmacologic modalities; it is felt to be important to emphasize the role of the former approaches particularly for osteoarthritis and fibromyalgia.
Virtually all forms of arthritis and systemic autoimmune rheumatic diseases are chronic conditions and effective treatments require patient participation, whether that is taking medications regularly (eg, urate-lowering therapy for gout) or making lifestyle changes such as adhering to dietary changes, a lifelong pattern of physical activity, or using cognitive behavioral therapy or mind-body techniques.
Patients with various forms of arthritis have an increased risk for cardiovascular comorbidities including coronary artery disease. While control of systemic inflammation appears to be important in ameliorating this risk, it is important for practitioners to focus on reducing other factors that contribute to increased cardiovascular disease risk including overweight and obesity, lack of physical activity, smoking, hypertension, hyperlipidemia, and poorly controlled type 2 diabetes mellitus. Depression also has been recognized as contributing to persistent pain, reduced physical function, and impaired quality of life in patients with various forms of arthritis. There is an ongoing need for care coordination between the rheumatology specialist and the primary care provider, particularly in patients who require co-management.
Meeting current and future needs will require a wealth of data currently not available or accessible. In the broad scope of musculoskeletal diseases, data currently either not available or inaccessible to BMUS analysts include treatment cost/benefits, medical workforce, geographic data at detail levels (due to small sample sizes), and outcomes.
In addition, many of the requests for additional data and analysis are beyond the scope of the current BMUS project due to staff size, staff expertise, and funding.
Major unmet needs for patients with arthritis include new, effective interventions for the safe treatment of chronic pain, improving insurance coverage for effective evidence-based, non-pharmacologic interventions, as well as newer, targeted small molecules, biologic DMARDs, and the development and approval of Disease Modifying Osteoarthritis Drugs (DMOADs) to slow or prevent progression of osteoarthritis.
Additionally, there is an ongoing need for research funding to understand the pathophysiology of the various forms of arthritis with the goal of estabilishing effective strategies for primary prevention, determining the appropriate timing for surgical intervention and the role of pre- and post-operative exercise programs to maximize functional recovery after surgical interventions, and understanding the underlying reasons for the observed sex/gender and race/ethnicity disparities in most forms of arthritis and systemic autoimmune rheumatic diseases.
Meeting future patient care needs will require increasing the workforce size of medical professionals. The 2015 Workforce Study by the American College of Rheumatology reported an excess demand for adult rheumatology care givers over current workforce projections of nearly 3200 professionals by 2030 and an excess demand of nearly 200 professionals in pediatric rheumatology.1 Other specialists in the care of arthritis likely show similar workforce demands.
The use of ICD-9-CM codes for clinical and public health purposes ended with the implementation of ICD-10-CM codes effective October 1, 2015. Standard definitions of generic and specific types of arthritis need to be developed for clinical and public health researchers using the new ICD-10-CM codes.
The crosswalk presented HERE [706] is for informational purposes only and should be carefully reviewed before used in future analysis.
Osteoporosis is a chronic musculoskeletal condition characterized by reductions in bone mass and quality accompanied by microarchitectural changes that lead to reduced bone strength. Reductions in bone mass, quality and strength increase the risk for fragility fractures. The primary diagnostic test for osteoporosis is measurement of bone mineral density (BMD) using dual energy X-ray absorptiometry (DXA). DXA testing provides an estimate of areal BMD in g/cm2,1 and the estimate is converted into a T-score by comparing it to the distribution of BMD levels of young adults. Using thresholds developed by the World Health Organization, osteoporosis is defined as a T-score ≤ -2.5. T-scores between -2.5 and -1.0 identify individuals with low bone mass (osteopenia) and T-scores ≥ -1.0 represent normal bone mass.2 It should be noted that older persons who sustain a hip fracture and/or a vertebral (spine) fracture are considered to have osteoporosis even in the absence of undergoing BMD measurement.
In the United States, the national prevalence of osteoporosis based on BMD data comes from the National Health and Nutrition Examination Survey (NHANES) [708]. NHANES is conducted by the National Center for Health Statistics, Centers for Disease Control and Prevention (CDC), to assess the health and nutrition status of a representative sample of the noninstitutionalized US population. Participant interviews are conducted in their homes to assess a variety of health states. They receive standardized physical measurements, including BMD measurements via DXA, in mobile examination centers that are moved around the nation. In 2017, the most recent national estimates of the prevalence of osteoporosis based on femoral neck and lumbar spine BMD data were released using NHANES data from the 2005–2006 through the 2013-2014 cycles (NHANES data is collected in 2-year cycles).1 In addition to reporting the prevalence estimates overall and by sex, this report expanded by race and ethnicity results to include non-Hispanic Asians.
Using the 2005-2006 thru 2013-2014 data, the average overall prevalence of osteoporosis in US adults aged 50 and over was 11.0%, or roughly 12 million adults, when using either the femoral neck or lumbar spine T-score. The prevalence was significantly higher in women (16.5%) than men (5.1%). The overall prevalence of low bone mass was 44.5%, representing ~45 million adults. The prevalence of low bone mass was higher in women (52.6%) than in men (35.6%).1 (Reference Table 4A.1.1 PDF [709] CSV [710])
 [712]
[712]
Among women, non-Hispanic Asians over the age of 50 years had the highest prevalence of osteoporosis (40.0%), followed by Hispanic women (20.5%), non-Hispanic white women (17.0%), and non-Hispanic black women (8.2%). Among men, non-Hispanic Asian men had the highest age-adjusted prevalence of osteoporosis (7.5%), followed by non-Hispanic whites (6.0%), Hispanics (5.9%), and non-Hispanic black men (1.9%). Hispanic (57.0%) and non-Hispanic white (54.6%) women had the highest age-adjusted prevalence of low bone mass, followed by non-Hispanic Asian (47.0%) and non-Hispanic black (40.4%) women. Asian (47.7%) and Hispanic (38.1%) men had the highest age-adjusted prevalence of low bone mass, followed by non-Hispanic white (37.3%) and non-Hispanic black (25.7%) men.1 (Reference Table 4A.1.2 PDF [713] CSV [714])
 [716]
[716]
The Hispanic population includes populations based on country of origin, including persons of Cuban, Mexican, Puerto Rican, South or Central American, or other Spanish culture or origin regardless of race. Previous studies have shown different fracture rates between Mexican, Cuban, and Puerto Rican American men and women,2 and it is likely that the prevalence of osteoporosis and low bone mass are different between Hispanic ethnic subgroups. A recent analysis utilizing data from the Boston Puerto Rican Osteoporosis Study (BPROS) compared the prevalence of osteoporosis and low bone mass by race/ethnic distribution in the US population as reported in the 2005-2010 NHANES to that of the prevalence estimates in their age and sex cohorts.3 They found that Mexican American women had the highest prevalence of osteoporosis at the femoral neck or spine (16%), followed by Puerto Rican women (10.7%), non-Hispanic white women (10.1%), and then non-Hispanic black women (3.8%). However, among men, Puerto Rican men had the highest prevalence of osteoporosis (8.6%), followed by Mexican American men (3.9%), non-Hispanic white men (2.3%), and non-Hispanic black men (1.3%), highlighting the burden of bone health in multiple Hispanic communities. The heterogeneity in osteoporosis prevalence observed by Hispanic origin likely applies to Asian groups as well, as indicated by age-standardized hip fracture incidence rates by country of origin. These data showed that women from Taiwan had higher hip fracture incidence rates than women from China.4 (Reference Table 4A.1.3 PDF [717] CSV [718])
 [720]
[720]
 [722]
[722] In addition to BMD testing, osteoporosis can be clinically diagnosed in individuals who have had a fragility fracture, irrespective of BMD, particularly if that fracture occurs at the hip or spine.1
There is no single national database that captures all hip and clinical spine fractures and estimates how many additional people have fractures without BMD-defined osteoporosis. One of the most comprehensive databases for evaluation of the total number of hospitalized fractures is the Agency for Healthcare Research and Quality’s (AHRQ) Nationwide Inpatient Sample (NIS) [723]. The NIS includes more than 8 million inpatient hospitalizations each year from all payers in the United States.
We evaluated the 2013-2014 NIS sample to estimate the number of discharges for fragility fractures, defined as a fracture of the hip, spine, pelvis, femur, humerus or wrist. Among US adults aged 50 and above, there were a total of 19.5 million hospital discharges, of which 540,600 (2.8%) were for fragility fractures. The distribution of these fractures by fracture type, sex, and age can be seen below. As expected, the prevalence of fractures is higher in women than in men, with fragility fractures representing 3.7% of the total hospital discharges in 2013-2014 in women, compared to only 1.8% in men. Likewise, the prevalence of fracture increased with age, with persons age 80 and over representing only 11% of the 50+ population, but accounting for 25% of fractures. (Reference Table 4A.2.1 PDF [724] CSV [725] and Table 4A.2.2 PDF [726] CSV [727])
 [729]
[729] We also evaluated the distribution of fragility fractures by race and ethnicity. Overall non-Hispanic white individuals had the highest number of hospital discharges associated with fragility fractures, particularly at the hip and the spine. Hispanic individuals had a larger number of discharges for fragility fractures other than hip and femur than the non-Hispanic black and the other race and ethnic groups. However, when compared to the proportion of the over 50 population in the US by race/ethnicity group, non-Hispanic whites, with a ratio of 1.1 (fractures to population) accounted for the highest incidence of all fractures. Non-Hispanic blacks had the lowest ratio (0.4), followed by Hispanics (0.6), and non-Hispanic others (0.7). (Reference Table 4A.2.3 PDF [730] CSV [731])
 [733]
[733] Relying on hospitalized fractures underestimates the true prevalence of all fragility fractures in the United States. For example, wrist fractures do not require hospital treatment and approximately two-thirds of all vertebral fractures are not clinically diagnosed.2 This is evident in our data. The 2012-2014 NIS dataset reports over 500,000 hospital discharges for fractures. Annually, there are about 1.5-2 million fractures in the US,3, thus, relying on the inpatient database alone clearly underestimates fracture prevalence. The data previously shown also portrays a low number of hospital discharges observed for fracture sites like wrist and spine, which are more frequently observed fracture sites. Again, as previously mentioned, these fracture types do not always require an inpatient hospital stay.
To account for the fracture prevalence underestimation using inpatient data, particularly for wrist fractures, we also utilized the HCUP National Emergency Department Sample (NEDS) [734] to evaluate fragility fractures. The NEDS produces national estimates about ED visits across the country, regardless of whether they result in a hospital admission.4 The 2013-2014 NEDS data included a total of 46.7 million ED visits for all causes, with a primary diagnosis of a fragility fracture in 935,700 (0.9%) of the visits. Again, more visits related to fragility fractures were recorded for women (1.2%) than in men (0.5%). Likewise, the proportion of the total visits for fragility fractures increased from 1.1% to 5.9% hospital discharges age 50-59 years to age 80 years and older, and 0.9% to 4.3% emergency visits for the same age brackets. (Reference Table 4A.2.2 PDF [726] CSV [727])
The figure below shows the distribution of the fragility fractures by fracture type overall, by sex, and by age. Unlike the hospital discharge data, there are more emergency department visits for fragility fractures of the wrist and humerus. Although overall there is an increase in ED visits for fragility fractures by age, the pattern is not consistent for all types of fractures. This may be due to changes in fracture risk and severity by age. The NEDS data does not routinely collect information on race/and ethnicity, so we were unable to evaluate the distribution of the fractures by race and ethnicity.
 [736]
[736] Given the clear difference in distribution of hospital discharges and ED visits for fragility fractures such as wrist fractures, the use of multiple data sources to estimate fracture incidence and prevalence in the US seems optimal. However, there are still situations where some fractures are identified via imaging and not treated (e.g. spine fractures), treated in a physician’s office, or are not the primary diagnosis of an ED or inpatient visit but are still a cause of admission. Algorithms can capture these and other situations to identify fragility fractures in administrative claims data, particularly for fragility fractures related to osteoporosis (hip, pelvis, femur, tibia/fibula or ankle, radius/ulna, humerus or scapula, clavicle, and clinical vertebral). Such an algorithm has been validated against medical records in the Medicare patient population and has been shown to have high positive predictive values overall and by each of their definitions.5
The 2015 incidence of the six major osteoporosis fractures in the Medicare 5% Sample can be found in the Figure below. A total of 465,820 fractures were identified, with 75% of the fractures occurring in women. As observed in the NIS data, hip and spine fractures were the most predominant fracture types, with incidences of 100.0 and 105.9 per 1,000 beneficiaries in women and 41.3 and 42.7 per 1000 in men with a fracture diagnosis, respectively. (Reference Table 4A.2.6 PDF [737] CSV [738])
 [740]
[740]
Using the 5% Medicare inpatient claims database, it was reported that the decline in hip fractures observed in women had plateaued since 2012.6 We also evaluated the trends in hip fracture in the 2010-2014 NIS data. We observed that from 2010 to 2014, there was a 3.5% and 1.4% increase in the number of hip and femur fracture discharges, respectively. All other fracture sites had decreases ranging from 12% to 22%. When evaluating the difference between 2012 and 2014, the inflection point observed in the previously cited paper,6 there were 5.4% and 7.5% increases in hip and femur fractures, respectively. The decline in other fractures ranged from 0.1% to 11%. However, overall, fragility fracture discharges remained within a relatively small range for each of the primary fractures over the five-year period. (Reference Table 4A.2.7 PDF [741] CSV [742])
 [744]
[744] We also evaluated trends in hip fracture using Medicare data among women in the 5% sample and all women with postmenopausal osteoporosis (PMO). Women with PMO were identified if they had an osteoporosis diagnosis code, were taking osteoporosis medications, and/or sustained a major osteoporotic fracture.7 Similar to previous reports, we observed a plateau in the incidence of hip fractures in the most recent years of Medicare data available. In the 5% sample, more generalizable to all female Medicare beneficiaries, we observed a 3.1% increase in the age-standardized incidence rate from 2010 to 2015; however, the confidence intervals for these incidence rates overlapped, suggesting no significant difference between the two rates [8.05 (7.87, 8.24) vs. 8.30 (8.09, 8.52)]. The incidence rate from the last four years, 2012 to 2015, showed a slight increase, but again, this difference was not significant [8.42 (8.22, 8.61) vs. 8.30 (8.09,8.52)], indicating a relatively stable hip fracture incidence rate during this time window.
However, in the PMO cohort, a cohort potentially at higher risk for fragility fractures, we observed an increase in the incidence rate of hip fracture over time. From 2010 to 2015, the hip fracture incidence increased by 9.1%, slowing down from 2012 to 2015, to a hip fracture incidence increase of 4.2%. Each of these increases was statistically significant, as the confidence intervals did not overlap during these time windows. This increase in the hip fracture incidence could be due to the osteoporosis “treatment gap,” which will be discussed later in the chapter. (Reference Table 4A.2.8 PDF [745] CSV [746])
 [748]
[748]
Osteoporosis and fractures are associated with increases in healthcare utilization, including hospitalization stays, physician office visits, and pharmacy use. We used NIS data to evaluate a variety of healthcare utilization characteristics by fracture site and a variety of demographic characteristics.
In 2014, the mean (standard deviation (SD)) length of stay (LOS) for all fragility fractures is 5.3 (0.87) days. The LOS was the highest for femur fractures (6.1 days) and the lowest for wrist fractures (3.6 days). When evaluating by sex, men tended to have longer LOS than women for all fracture sites. (Reference Table 4A.3.1 PDF [750] CSV [751])
 [753]
[753] Overall, it appeared that younger individuals had slightly longer LOS than older individuals. This was most apparent for pelvic and femur fractures in comparison to the other fracture sites. The longer LOS could be due to traumatic nature of these types of fracture in younger individuals; however, the level of trauma could not be determined from these data. (Reference Table 4A.3.1 PDF [750] CSV [751])
 [755]
[755] Lastly, LOS was significantly longer in non-Hispanic black persons with fractures at all fracture sites compared to the other race and ethnic groups. (Reference Table 4A.3.3 PDF [756] CSV [757])
 [759]
[759]
Hospital charges are based on standard hospital cost for patient stays and procedures and provide a comparison between groups. They are not indicative of actual cost paid by insurance companies and patients. Charges are associated with individual hospital stays with a fracture diagnosis and do not include additional costs associated with the same fracture for any readmission, physician care, or long-term care required.
Overall, in 2014, fragility fractures were associated with nearly $60,000 in mean hospital charges. The highest charges were associated with femur fractures ($75,000), whereas the lowest charges were associated with pelvic fractures ($39,700). Charges were higher in men with fractures than women. (Reference Table 4A.3.1 PDF [750] CSV [751])
 [761]
[761] Charges decreased as age increased for all fracture types. The reason for lower hospital charges among the eldest patients is not fully understood but is possibly due to shorter stays, particularly for spine, pelvic and femur fractures, among those age 80 and over where transfer rates to short/long term care is higher. Elderly patients also may not have surgery for fixation. (Reference Table 4A.3.1 PDF [750] CSV [751])
 [763]
[763] Overall and by fracture site, Hispanics had the highest hospital charges, followed by non-Hispanic blacks and people from other race and ethnic groups, and then non-Hispanic Whites. (Reference Table 4A.3.3 PDF [756] CSV [757])
 [765]
[765]
Despite year-to-year rise and fall in healthcare treatments and visits for osteoporosis, total healthcare visits to physicians, ambulatory nonphysician healthcare sites, and for home health services, along with the number of prescriptions filled, have each remained relatively steady over the past 15 years (2000 to 2014). The general trend was a rising number of visits in the early 2000s, with a decline since about 2007. The exception is home health visits. (Reference Table 8.2.4 PDF [766] CSV [767])
 [769]
[769]
Medical costs reported in the Economic Cost [519] chapter of this report, on which this section is based, are analyzed using the US Department of Health and Human Services, Agency for Healthcare Research and Quality, Medical Expenditures Panel Survey (MEPS) and capture four types of healthcare resources consumed: ambulatory visits (to both physicians and nonphysicians), prescription medications, home healthcare visits, hospital discharges, plus “residual” (all other types of care). Unlike the hospital charges discussed previously, the MEPS utilizes expenditures actually paid for healthcare by insurance companies and patients.
Overall, ambulatory care visits accounted for the largest share of per-person direct cost for people with an osteoporosis condition along with other conditions. At an average cost of $4,035 per person on average 2012-2014, ambulatory cost of care increased 47% from 1998 to 2014 in 2014 dollars. However, the share of per person total direct cost for osteoporosis ambulatory care remained constant at 31%. The mean per-person cost for inpatient care, after dropping for several years, was slightly higher at $3,381 in 2012-2014 than in 1998-2000 in 2014 dollars. The share of total direct costs for inpatient care dropped by 25% between 1998-2000 and 2012-2014. The greatest change in average per-person cost was for prescriptions, rising from $1,771 in 1998-2000 to $3,494 in 2012-2014, in 2014 dollars, an increase of 97%. The share of cost for prescriptions rose 37%, from 20% to 27%. (Reference Table 8.4.4 PDF [770] CSV [771])
 [773]
[773] Total direct per-person healthcare costs in 2012-2014 for people with an osteoporosis condition along with other conditions were $12,869, an increase of 44% since 1998-2000 in 2014 dollars. Incremental direct per-person costs, those costs most likely attributable to an osteoporosis condition and a more useful statistic, cannot be calculated for osteoporosis because of the small sample size. (Reference Table 8.6.4 PDF [774] CSV [775])
 [777]
[777] Total aggregate direct costs for all persons were $73.6 billion in 2012-2014, a rise of 118% from the $28.1 billion in 1998-2000, in 2014 dollars. (Reference Table 8.6.4 PDF [774] CSV [775])
 [779]
[779]
Indirect costs associated with lost wages for people ages 18 to 64 years are not calculated for those with an osteoporosis condition. Osteoporosis is rarely cited as a reason for lost workdays or bed days, in part because of the older age of the most commonly affected adults. However, approximately 50% of people with hip fractures do not regain their prior activity level, leading to societal costs for added care, particularly among caregivers whose income may be reduced due to lost workdays and productivity, as well as physical therapy, transit assistance, and inhome care. Similarly, vertebral compression fractures due to osteoporosis contribute to spinal deformity, reduced mobility, and the need for assistance with activities of daily living, further increasing indirect societal costs.
The Bone and Joint Decade, from 2000 to 2010, saw an increase in the awareness of and education for osteoporosis, as well as therapies used in the clinical management of osteoporosis and fragility fracture. Although cause and effect cannot be determined, over time epidemiologic studies reported a steady decline in fractures, particularly of the hip.1 However, with the emerging information on the serious, yet rare, side effects of long-term exposure to some of the osteoporosis medications (particularly Nitrogen-containing bisphosphonates), changes in care from the physician and patient level emerged in the field, which have led to what is now being called an osteoporosis treatment gap.2
In October 2010, as a result of reports associating long-term use of anti-osteoporosis medications (particularly the Nitrogen-containing bisphosphonates and also denosumab) with rare adverse events such as atypical femoral fractures (AFF) and osteonecrosis of the jaw (ONJ), the FDA issued revised guidance concerning long-term use of bisphosphonate treatments. An AFF starts as a weakening of the outer rim of the femur below the hip area as a tiny crack resembling a stress fracture. Unlike more common osteoporosis fractures, AFF develop over time from normal activities. If warning signs are not addressed, eventually the thigh bone may break completely. ONJ occurs when the jaw bone is exposed. Most cases of ONJ happen in long-term or very high dose bisphosphonate users after a dental extraction. The risk of ONJ in patients taking bisphosphonates for osteoporosis has a rate estimated between .001 and .01%.3 In October 2010, the FDA provided guidelines [780] on patient review for therapies used longer than three to five years, typically bisphosphonates, and suggested taking a break (or "holiday") from potent antiresorptive medications, including Nitrogen-containing bisphosphonates, in appropriate patients.
There is limited evidence to support both the practice of “drug holidays” and to determine the appropriate time to resume therapy, if one chooses to have a “drug holiday.” The use of DXA and bone turnover markers may assist in the clinical decision (e.g., a decline in bone mass density (BMD) greater than the smallest detectable difference in DXA or an increase in bone turnover markers beyond the normal premenopausal range); however, some patients never return to therapy. As previously reported in the Fracture Trends section, since 2012, the decline in hip fractures that was previously observed in older women has plateaued or even reversed in the US. This finding may be associated with an osteoporosis treatment gap that was highlighted earlier. The major key challenge for the future is for researchers to identify factors associated with the treatment gap, and work with patients on the best way to mediate them so physicians can continue to provide the best care for patients in reducing the risk for fractures.
Currently available data are not conducted at the person-level and do not link lifestyle factors or treatment with diagnosis; therefore, causal relationships cannot be established. However, there are many factors that may be associated with the current osteoporosis treatment gap, including (1) a decrease in DXA testing, (2) a decrease in the number of providers performing DXAs, and (3) the decreasing prevalence of women with osteoporosis diagnoses, which may contradict some of the epidemiologic data.
Depicted in the Figure below, the prevalence of DXA testing has decreased in the rate given to female Medicare recipients age 65 and older from a peak of 13.2% in 2008 to 11.3% in 2014. Likewise, the number of DXA providers, particularly office-based providers, has decreased from 22,355 in 2008 to 15,952 in 2014, a loss of 6,403 providers. This decrease was not offset by a slight rise of 518 hospital DXA providers between 2007 to 2014.4
 [782]
[782]
Another potential factor is the decline in the use of medications. Drug holidays have become an option in treatment (see above), and along with the fear of side effects, there has been a decrease in the use of anti-osteoporosis medications. A study using commercial pharmacy data evaluated the number of dispensed prescriptions of both oral and parenteral bisphosphonates from 2002 to 2012. The total number of dispensed prescriptions reached a high of 31.0 million in 2008 and decreased to 14.7 million in 2012.5 Likewise, a study of Medicare patients with a hip fracture showed that the probability of osteoporosis medication use within 12 months of hip fracture discharge decreased from 40% in 2002 to 21% in 2011.6
 [784]
[784] To potentially understand the decline in medication use, researchers conducted ecologic studies describing medication use over time and evaluating the timing of the various FDA safety announcements. A study using commercial data evaluated the proportion of hip fracture patients using anti-osteoporosis medications.7 They stratified by bisphosphonates and all other osteoporosis medications. The investigators plotted the distribution of users over time and indicated when the FDA released announcements regarding safety around three adverse events: osteonecrosis of the jaw (May 2005), atrial fibrillation (Oct 2007), and atypical femur fractures (Mar 2010). The study, depicted in the graphic below, clearly showed that the FDA announcements may have had temporal associations with the use of bisphosphonates, but not apparently on the use of other osteoporosis medications. Specifically, the authors found a 4% decrease in the odds of bisphosphonate use in hip fracture patients every quarter after the release of the atypical femur fracture announcement, whereas there was no association in the other osteoporosis medications.8
 [786]
[786] Poor health education is another factor associated with the osteoporosis treatment gap. Although the Bone and Joint Decade increased the amount of osteoporosis education that was being circulated, it might not have reached all racial and ethnic groups. The prevalence of osteoporosis among Hispanic populations is equal to or higher than non-Hispanic whites, although the number of fractures is higher among non-Hispanic whites. Based on US Census data, the Hispanic population is the fastest growing ethnic group in the US overall, as well as among older adults,9,10 suggesting the need for culturally appropriate osteoporosis education information. Affiliates with the National Osteoporosis Foundation (NOF) have developed a Hispanic version of the NOF website to empower Hispanic women about osteoporosis, and “Fit to a T,” one of the patient education tools sponsored by the USBJI also sponsors Spanish language versions of several osteoporosis programs. This is one of the first steps in reducing disparities seen in DXA screening and medication use among Hispanic women.
Additional education is also needed for black women and the providers who serve them. Although black women have a generally lower prevalence of osteoporosis, those who have fractures have worse outcomes than their white counterparts. Several studies have shown that mortality after hip fractures is nearly 30% higher in black women than white women, even after adjusting for demographic, health, and surgical factors. Black women are less likely to be screened for osteoporosis,11, even high risk women who have sustained hip fractures,12 and less likely to receive medications.13,14,15 Although this disparity may have had a minimal impact on the current osteoporosis treatment gap, it still represents an area that needs improvement in the field.
Of three new therapies on the horizon in the last edition, abaloparatide (brand name Tymlos) and romosozumab (brand name Evenity) have been approved by the FDA for the treatment of osteoporosis.
Abaloparatide is a novel 34-amino acid peptide, which is a selective activator of the parathyroid hormone receptor type 1 signaling pathway.1 In Phase 3 studies, women were randomized to receive abaloparatide, teriparatide, or placebo. Compared to placebo, women randomized to abaloparatide had a 3.4% increase in BMD at the total hip, 2.9% increase at the femoral neck, and 9.2% at the lumbar spine.2 These increases were observed earlier than in the teriparatide group. Abaloparatide also reduced vertebral fracture and nonvertebral fracture risk by 86% and 43%, respectively.2 Abaloparatide is effective at increasing BMD and reducing fracture risk at all levels of baseline risk (i.e., baseline BMD score, prevalent fracture status, prior fracture status, age)3 and even in the oldest old.4
Romosozumab, FDA approved April 9, 2019, is a monoclonal antibody to sclerostin. Sclerostin is produced by osteocytes and inhibits bone formation while enhancing bone resorption. The pivotal Phase 3 study showed that 1-year of romosozumab administered monthly compared to placebo increased BMD at the lumbar spine by 13%, and reduced the risk of new vertebral fractures by 73%.5 In an additional study that compared romosozumab to alendronate, the risk of new vertebral fracture was 48% lower in the group randomized to romosozumab followed by alendronate than in the group who were randomized to alendronate and continued alendronate throughout the study.6 This study, but not a larger one against placebo, found a higher rate of adverse cardiovascular safety outcomes, including cardiac ischemic events and cerebrovascular events in the romosuozumab group.6
Having one fragility fracture increases the risk for a second fragility fracture, with estimates ranging from 37% at the same site to nearly seven-fold for different sites.7,8,9,10 Thus, secondary fracture prevention is important clinically and a major emphasis of the American Society for Bone and Mineral Research (ASBMR).
Programs and Services to Help Prevent Secondary Fractures
Many tools have been created to assist in secondary fracture prevention, with the Fracture Liaison Service (FLS) programs the most well-known. FLS programs have been shown to be successful in many European countries and have become international platforms for secondary fracture prevention. In the US, the first FLS programs were initiated within the Kaiser Permanente health system, a closed health network. In 2014, a simulation analysis estimated the cost effectiveness of FLS programs if initiated in the traditional US open-healthcare system.11 This study projected that over the remaining life span (mean of 8.6 years) of 10,000 men and women who sustained an index hip fracture, there would be an estimated 5,579 subsequent fractures, including 1,958 hip, 453 distal forearm, 998 vertebral, and 2,170 fractures of other sites. Implementation of a universal FLS was projected to reduce the rates of subsequent hip fracture by 109 per 10,000 persons, 21 fewer spine fractures, 5 fewer distal forearm fractures, and 17 fewer other osteoporotic fractures. The reduction in fracture rate was associated with a $66,879 reduction in costs and an increase in quality adjusted life expectancy (QALE) of 37.4 years for every 10,000 patients.10
This information led groups, including the National Osteoporosis Foundation (NOF) and the American Orthopaedic Association’s “Own the Bone” (AOA-OTB) program, to promote FLS training in the US. The NOF’s Fracture Prevention Central [790] (FPC) website, an online toolkit accessible to the public, includes tools and resources for those interested in starting an FLS program, as well as guidance to hospital administrators, affordable healthcare organizations, and health insurers on how to make a financial business case for implementing a FLS program at their location. NOF also has the FLS Model of Care Training Program [791] designed to help doctors, nurse practitioners, physician assistants, registered nurses, and other healthcare professionals improve the care management of post-fracture patients and navigate the complicated coordination of the care process across hospitals, medical offices and multiple medical specialties through the application of best practices. The program is designed as a self-paced, on-demand webinar series. Participants can choose to complete individual FLS sessions or complete all sessions and receive the FLS Certificate. The goal of the program is to ensure that fracture patients receive appropriate osteoporosis testing, diagnosis, treatment and ongoing support after they leave the hospital.
Own the Bone [792] program is a national post-fracture, systems-based, multidisciplinary fragility fracture prevention initiative. Its Web-based program and 10 prevention measures transform the way hospitals treat fracture patients. The ultimate goal is to change physician and patient behavior to reduce incidence of future fractures and positively impact osteoporosis treatment. The program conducts educational webinars and symposiums addressing nutrition counseling, physical activity counseling, lifestyle counseling, pharmacotherapy recommendations, BMD testing, and communication about bone health and additional risk factors. Own the Bone also has an extensive registry, which is consistent with the demographics of the general population of those with osteoporosis. Bone health experts establish standards of care through a medical advisory board for Own the Bone.
Both NOF and AOA-OTB have partnered with Project ECHO to disseminate FLS training through the ECHO platform, an initiative of the University of New Mexico, which uses case-based clinical discussions in a spoke and hub manner to disseminate information. The ECHO model™ breaks down the walls between specialty and primary care by linking expert specialist teams at an academic ‘hub’ with primary care clinicians in local communities – the ‘spokes’ of the model. In addition to the University of New Mexico, the ECHO platform is used by MNI Great Lakes ECHO in MI. To learn more about joining the Bone Health ECHO® program, click here [793].
The International Osteoporosis Foundation has the “Capture the Fracture [794]” program, which has created the Best Practice Framework, an international benchmark for FLS programs, that includes 13 globally-endorsed standards:
1 Patient identification,
2 Patient evaluation,
3 Post fracture assessment timing,
4 Vertebral fracture,
5 Assessment guidelines,
6 Secondary causes of osteoporosis,
7 Fall prevention,
8 Multifaceted health and lifestyles risk-factor assessment,
9 Medication initiation,
10 Medication review,
11 Communication strategy,
12 Long-term management, and
13 Creating a database.
The American Society for Bone and Mineral Research (ASBMR) has created the Secondary Fracture Prevention Initiative [795], a coalition of bone health experts, including healthcare professionals and patient advocates, dedicated to reducing the number of avoidable second fractures in individuals with osteoporosis. The Initiative, with consensus from a broad multi-stakeholder coalition, has developed five fundamental clinical recommendations [796] and seven additional recommendations for clinical care for women and men, age 65 years or older, with a hip or vertebral fracture. They are directed to all healthcare professionals who participate in the care of these patients, with the goal of reducing secondary fractures.
|
ICD-9-CM Codes |
ICD-10-CM Conversion Codes |
New ICD-10-CM Codes |
||
|
OSTEOPOROSIS |
||||
|
Osteoporosis unspecified: 733.00 |
M81.0 |
Age-related osteoporosis without current pathological fracture: M81.0 |
||
|
Senile osteoporosis: 733.01 |
M81.0 |
Localized osteoporosis [Lequesne]:M81.6 |
||
|
Idiopathic osteoporosis: 733.02 |
M81.8 |
Other osteoporosis without current pathological fracture: M81.8 |
||
|
Disuse osteoporosis: 733.03 |
M81.8 |
Adult osteomalacia: M83.x |
||
|
Other osteoporosis: 733.09 |
M81.8 |
|||
|
FRAGILITY FRACTURES |
||||
|
Hip fracture: 820.0, 820.2, 733.14 |
S72.019A, S72.023A, S72.033A, S72.043A, S72.099A, S72.109A, S72.143A, S72.23XA, M84.459A |
Osteoporosis with current pathological fracture: M80.x |
||
|
Spine fracture: 805.0, 805.2, 805.4, 805.8, 806.0, 806.2, 806.4, 806.8, 733.13 |
S12.9XXA, S12.000A, S12.001A, S12.100A, S12.101A, S12.200A, S12.201A, S12.300A, S12.301A, S12.400A, S12.401A, S12.500A, S12.501A, S12.600A, S12.601A, S22.009A, S32.009A, S32.10XA, S32.2XXA, S14.101A, S14.102A, S14.103A, S14.104A, S14.111A, S14.112A,S14.113A, S14.114A, S14.121A, S14.122A, S14.123A, S14.124A, S14.131A, S14.132A, S14.133A, S14.134A, S14.151A, S14.152A, S14.153A, S14.154A, S14.105A,S14.106A, S14.107A, S14.115A, S14.116A, S14.117A, S14.125A, S14.126A, S14.127A, S14.135A, S14.136A, S14.137A, S14.155A, S14.156A, S14.157A, S24.101AS24.102A, S24.111A, S24.112A, S24.131A, S24.132A, S24.151A, S24.152A, S24.103A, S24.104A, S24.113A, S24.114A, S24.133A, S24.134A, S24.153A, S24.154A,S34.109A, S34.119A, S34.129A, S32.009A, S34.101A, S34.111A, S34.121A, S32.019A, S34.102A, S34.112A, S34.122A, S32.029A, S34.103A, S34.113A, S34.123A,S32.039A, S34.104A, S34.114A, S34.124A, S32.049A, S34.105A, S34.115A, S34.125A, S32.059A, S14.109A, S24.109A, S34.109A, S34.139A, M48.50XA, M80.08XA,M84.48XA, M84.68XA |
Stress fracture: M84.3 |
||
|
Pelvic fracture: 808.0, 808.2, 808.4, 808.8 |
S32.409A, S32.501A, S32.501A, S32.509A, S32.309A, S32.609A, S32.810A, S32.811A, S32.82XA, S32.89XA, S32.9XXA |
Pathological fracture, not elsewhere classified: M84.4 |
||
|
Femur (thigh) fracture: 821.0, 821.2, 733.15 |
S72.90XA, S72.309A, S72.409A, S72.413A, S72.416A, S72.443A, S72.446A, S72.453A, S72.456A, S72.499A, M84.453A |
|||
|
Wrist fracture: 813.4, 733.12 |
S52.90XA, S52.539A, S52.549A, S52.509A, S52.609A, S52.119A, S52.529A, S52.019A, S52.629A, S52.011A, S52.012A, S52.621A, A52.622A, M84.439A |
|||
|
Humerus (arm) fracture: 812.0, 812.2, 812.4, 733.1 |
S42.209A, S42.213A, S42.216A, S42/293A, S42.295A, S42.253A, S42.256A, S42/293A, S42.296A, S42.309A, S42.399A, S42.409A, S42.413A, S42.416A, S42.433A, S42.436A, S42.453A, S42.456A, S42.443A, S42.446A, S42.463A, S42.466A, S42.473A, S42.476A, S42.493A, S42.496A, M84.40XA |
|||
An injury is a general term referring to damage to the body, and can be caused by accidents, falls, weapons, sports, and other incidents. Injuries may affect many parts of the body, including the brain, the extremities, and internal organs. Wounds are injuries that break the skin or other body tissues, and include cuts, scrapes, and punctured skin. This document is focused on injuries to the extremities and spine, referred to as musculoskeletal injuries throughout this document.
Injuries are reported for six different categories, with each having a somewhat different focus and data source(s) specific to the category of injury. To address the broadest picture, this chapter includes the following sections.
Self-reported Injuries [797]: Data for this topic is based primarily on the National Health Interviews Survey (NHIS), conducted annually since 1957 by the National Center for Health Statistics, Centers for Disease Control and Prevention, US Department of Health and Human Services. The survey includes self-reported questions on medical conditions, health insurance, doctor’s office visits, and physical activity and other health behaviors. Because of small sample sizes for some conditions, data is often merged for three years, the result being an average across the time period.
Traumatic Injuries [798]: Traumatic injuries are unintentional physical injuries of sudden onset and severe enough to require immediate medical attention. Causes of traumatic injuries include moving vehicle accidents (i.e., car, bicycle, motorcycle), gunshot injuries, sports, and falls. A major trauma is an injury that has the potential to cause prolonged disability or death. Data on traumatic injuries is based on national health care databases compiled annually by the Agency for Healthcare Research and Quality (AHRQ) and the National Center for Health Statistics (NCHS) of discharges and visits to hospitals, emergency rooms, outpatient clinics, and physician offices.
Falls [799]: Unintentional injury deaths and deaths due to falls are tracked by the Centers for Disease Control (CDC). Falls are a major cause of traumatic injury and death to the aging population.
Workplace Injuries [800]: Workplace injuries are compiled annually by the US Department of Labor, Bureau of Labor Statistics, Injuries, Illnesses and Fatalities Program. Musculoskeletal injuries are classified as musculoskeletal disorders (MSD) that affect muscles, tendons and connective tissue, and comprise a substantial portion of all workplace injuries.
Sports Injuries [801]: Sports injuries occur to children at playgrounds ranging all the way to professional sports. There is no single database that addresses sports injuries for all ages and activities. BMUS 4th Edition includes data from the US Consumer Product Safety Commission, National Electronic Injury Surveillance System (NEISS); the University of Colorado, Colorado School of Public Health High School Sports-Related Injury Surveillance Study (RIOTM); and data from the National Collegiate Athletic Association published in the Journal of Athletic Training. Access to raw databases used in any of these sources, as well as data from professional sports injuries, is not available.
Military Injuries [802]: Military injuries include injuries that occur in both nonactive and active duty personnel, and across the five major branches of military duty: Army, Navy, Air Force, Marine Corps, and Coast Guard. Data is compiled from annual summaries published by the Armed Forces Health Surveillance Branch.
Musculoskeletal injuries represent the majority of injuries treated. Using the national healthcare databases and ICD-9-CM codes for comparison basis, the share of injuries treated classified as musculoskeletal rose from 61% to 89% of all injuries between 2006/2007 and 2013.
Musculoskeletal injuries may be specific to the category of injury (e.g., MSDs as described in Workplace Injuries above), but for the most part fall into five major groups, plus a group of less common injuries. These categories are based on ICD-9-CM diagnostic codes used primarily in national healthcare databases.
Fractures: Fractures occur when a bone is broken. Fractures fall into six types which are not exclusive of one another.
Dislocations: Dislocations are joint injuries that force the articular surfaces of bones out of position. An acutely dislocated joint is painful, swollen, and often visibly out of place. Movement becomes limited. Immediate medical attention is needed to reposition the bones, relieve pressure on soft tissue structures, and provide proper support for healing.
Sprains & strains: A sprain is a stretched or torn ligament, while a strain is a stretched or torn muscle or tendon. A strain can be caused by twisting or pulling tissues. The difference between a sprain and a strain is that a sprain injures the bands of tissue that connect two bones together, while a strain involves an injury to a muscle or to the band of tissue that attaches a muscle to a bone.
Contusions: A contusion, also referred to as a bruise, is damage to the body that doesn't break the skin but ruptures the blood capillaries beneath, resulting in discoloration to the injured area. Most contusions are minor and heal quickly, but they can be serious enough to cause deep tissue damage, swelling, lead to internal “degloving (a significant soft-tissue injury), and limit joint range of motion near the injury. Bruises do not only occur under the skin, but also in deeper tissues, organs, and bones. While these deeper bruises may not show visible signs of bleeding, they can cause pain. They are the second most common sports injury.
Open wounds:
Other musculoskeletal injuries:
On average 2013-2015, 8.83 million persons reported seeking medical care for an injury during the prior three months, a number that extrapolates to 35.3 million per year (Reference Table 5A.1.1 PDF [803] CSV [804]), a number slightly higher than reported by the Centers for Disease Control (CDC) for nonfatal unintentional injuries. Even so, the number of self-reported annual injuries is much lower than the number of healthcare visits to physicians, emergency departments, outpatient clinics, and hospitals reported during the course of a year (Reference Table 5B.2.1 PDF [805] CSV [806]), suggesting that self-reported injuries are under reported.
The proportion of self-reported total injuries that were musculoskeletal was similar to that reported by the national healthcare databases for injury-related healthcare visits, 80% and 87% respectively. (Reference Table 5A.1.1 PDF [803] CSV [804]; Table 5B.2.1 PDF [805] CSV [806])
Self-reported injuries are reported by male and female individuals in the same proportion they are found in the population. Using age as the comparison variable, older people report more injuries than younger. Among racial/ethnic groups, non-Hispanic whites report more injuries while non-Hispanic others report fewer. Using the four geographic regions of the US, injuries are reported higher in the Midwest region. (Reference Table 5A.1.1 PDF [803] CSV [804]; Table 5A.1.2 PDF [807] CSV [808]; Table 5A.1.3 PDF [809] CSV [810]; Table 5A.1.4 PDF [811] CSV [812])
 [814]
[814] When reporting the cause of their injury, respondents are asked about six specific causes and an “other” cause. Approximately one-half of respondents reply with the “other” response, which includes accidents around the home and while conducting activities of daily living. In compiling data on the cause of injury, only three categories are used. “Falls” is one of the six specific causes; “vehicle or sports-related” injuries include being in a motor vehicle collision or as a pedestrian hit by a vehicle, accidents while in a boat, train or airplane, and accidents while on a scooter, bike, skateboard, horse, etc. Burns are included in the “other” cause category.
The cause of all injuries reported by male and female individuals is 11% each for vehicle or sports-related injuries. However, women report more falls than men (43% versus 30%) and fewer other causes (46%, 60%). (Reference Table 5A.1.1 PDF [803] CSV [804])
 [816]
[816] By age, persons age 18 to 44 report higher incidence of vehicle and sport-related injuries (15.6%), while those age 65 and over report only 5% from this cause. However, the 65 and over population reports the highest incidence of falls (58.4%). (Reference Table 5A.1.2 PDF [807] CSV [808])
 [818]
[818] Using race/ethnicity as the comparison variable, there is less variation between groups with only vehicle or sport-related injuries varying. Black non-Hispanics report vehicle or sport-related injuries as a cause 15.2% of the time while non-Hispanic whites report only 9.7% of injuries caused by vehicle or sport-related causes. (Reference Table 5A.1.3 PDF [809] CSV [810])
 [820]
[820] Geographic regional areas report only minor differences by cause of injuries, with vehicle and sport-related accidents slightly higher in the South and West regions than in the Northwest and Midwest regions. (Reference Table 5A.1.4 PDF [811] CSV [812])
 [822]
[822] It has long been known that most injuries occur in or around the home, in part because of the time spent at home versus other locations. In 2013-2015, persons self-reporting injuries reported one-half of the injuries for which they sought medical treatment occurred in the home (32%) or outside the home or farm (17%). Female individuals are more likely to report an injury occurring inside the home than are male individuals (37% versus 22%). Other common places of injuries to occur are public buildings (13%) and public streets (12%). Male individuals report injuries occurring in public buildings more than do female ones (22%, 13% respectively). Age is also a factor in where injuries occur, with 75% of injuries reported by persons age 65 and over occurring in or around the home while those age 18 or younger have more injuries at school (28%) or in a public facility (22%). Race/ethnicity and geographic region are not factors in where injuries occur. (Reference Table 5A.2.1 PDF [823] CSV [824])
 [826]
[826] The type of activity engaged in does not differ significantly as a cause of musculoskeletal injuries. Sports, non-sport leisure activities, and working in and around the home or workplace are the cause of similar numbers of injuries for which medical care is sought. There are slight differences between male and female individuals, but age is a greater factor, with those age 65 and older reporting working at home (27%) or an “other” activity (42%) while young people under 18 are more likely to be injured during sport activities (41%). Race/ethnicity and geographic region are neither one a factor in the type of activity engaged in when injuries occur. (Reference Table 5A.2.1 PDF [823] CSV [824]; Table 5A.2.2 PDF [827] CSV [828]; Table 5A.2.3 PDF [829] CSV [830]; Table 5A.2.4 PDF [831] CSV [832])
 [834]
[834] The type of self-reported injury reported showed small variations by demographic group, particularly with respect to age and race/ethnicity. Overall, the most common type of musculoskeletal injury for which medical attention was sought was a sprain or strain (37%). This was particularly true for non-Hispanic blacks (42%) and non-Hispanic others (43%), and persons age 18 to 44 (43%). Persons age 65 and older were most likely to report a scrape or bruise (contusion) for which they sought medical attention (28%). Fractures were most common among those 18 and younger (27%). (Reference Table 5A.3.1 PDF [835] CSV [836]; Table 5A.3.2 PDF [837] CSV [838]; Table 5A.3.3 PDF [839] CSV [840]; Table 5A.3.4 PDF [841] CSV [842])
 [844]
[844] Injuries to the lower extremity were the most common injury site, accounting for 45% of all musculoskeletal injuries for which medical attention was sought. Female individuals reported lower extremity injuries more than male (52% and 39% of all injuries, respectively) while 42% of injuries reported by male individuals were to the upper extremity. Persons age 18 to 64 years were most likely to have a back injury, but injuries to the neck/back/spine accounted for only 13% of reported injuries. Spine injuries were reported in the West region (19%) more than other regions. Race/ethnicity was not a factor is anatomic site of injuries for which medical attention was sought. (Reference Table 5A.3.1 PDF [835] CSV [836]; Table 5A.3.2 PDF [837] CSV [838]; Table 5A.3.3 PDF [839] CSV [840]; Table 5A.3.4 PDF [841] CSV [842])
 [846]
[846] Sprains and strains accounted for 64% of injuries for which medical attention was sought when the neck/back/spine were involved, and 41% of lower extremity injuries. Scrapes and bruises accounted to 49% of torso injuries. Injuries to the upper extremity were distributed across all types of injuries. Fractures occurred more frequently from a fall, while sprains and strains were more common with vehicle or sport-related injuries. Cuts and other types of injuries occurred from other causes. (Reference Table 5A.4.1 PDF [847] CSV [848]; Table 5A.4.2 PDF [849] CSV [850])
 [852]
[852] Just over 6% of self-reported medically-consulted musculoskeletal injuries resulted in hospitalization of one night or longer. Fractures were most likely to result in hospitalization (16%), with sprains and strains least likely (2%). Injuries to the torso were more likely to result in hospitalization (10%) than injuries to other anatomic sites. Injuries resulting from falls (10%) also had a greater likelihood of hospitalization. (Reference Table 5A.4.3 PDF [853] CSV [854])
The annual National Health Interview Survey asks participants if they are limited in activities of daily living (ADL), such as the ability to dress oneself, to get in or out of bed or a chair, or to work, due to health issues. Depending on the NHIS dataset used, the specific limitation items are different. The Person file includes activities such as dressing, eating, and working. The Injury file focuses on ability to socialize, walk, and lift/carry items. Both include only persons age 18 and over, and both are based on a “yes” response to “fracture or bone/joint injury” as the cause of the limitation.
In the Injury file, one in four or five persons report limitations with all activities included unless special equipment is available. Reaching over the head is the most limited activity (30%), while grasping small objects the least limited (20%). (Reference Table 5A.5.1 PDF [855] CSV [856])
 [858]
[858] Inability to work at all (52%) or limited in kind of work (27%) is the major limitation for adults in the Person file reporting a fracture or bone/joint injury. While one in three (31%) reported needing help with routine needs, the specific ADL varied. Women reported higher levels of need than men, and age was also a factor. One in four (25%) of persons age 65 and over reported needing help with personal care after a fracture or bone/joint injury. (Reference Table 5A.5.2 PDF [859] CSV [860])
 [862]
[862] In addition to needing help with activities, persons suffering a fracture or bone/joint injury report high levels of bed days and lost work days. A bed day is defined as 1/2 or more days in bed due to injury or illness in past 12 months, excluding hospitalization. A mean of 28 bed days were reported by 4.5 million persons with a fracture or bone/joint injury, for a total of 122.6 million days. Mean bed days were slightly higher for women (28 days), persons aged 45 to 64 years (30 days), non-Hispanic whites (30 days), and persons living in the Midwest (35 days).
A missed work day is defined as absence from work due to illness or injury in the past 12 months, excluding maternity or family leave. A mean of 23 lost work days were reported by 2.5 million persons with a fracture or bone/joint injury, for a total of 55.9 million days. Mean lost work days were similar between sexes, by age, and regionally, but considerably higher for Hispanic persons with a fracture or bone/joint injury (33 days) and much lower for non-Hispanic others (10 days).
The share of bed days and lost work days reported by a demographic group is impacted by both the mean days reported and their share of the total population. However, variations can be seen. For example, non-Hispanic whites accounted for 80% of bed days but only 60% of lost work days, while Hispanics were 10% and 17%, respectively. Female injured had a higher share of bed days (59%), while lost work days were evenly split between female and male individuals. Persons age 45 to 64 reported half (49%) of total bed days, with the balance split between younger and older persons. However, due to a representing a small share of the workforce, persons age 65 and over accounted for only 4% of lost work days. (Reference Table 5A.5.3 PDF [863] CSV [864])
 [866]
[866]
Traumatic injury is a term which refers to physical injuries of sudden onset and severe enough to require immediate medical attention. Traumatic injuries are the result of a wide variety of blunt, penetrating, and burn mechanisms. They include motor vehicle collisions, sports injuries, falls, natural disasters, and a multitude of other physical injuries which can occur at home, on the street, or while at work and require immediate care. Persistent pain and psychological distress lasting several years are common after traumatic musculoskeletal injury (TMsI).1
Accidents resulting in traumatic injury and requiring medical attention are treated in all levels of care sites, including physician’s offices, outpatient clinics, hospital emergency departments, and if severe enough, hospitalization. In 2013, more than 72 million patient visits for injuries were recorded for all levels of care, with 87% of these visits (62.7 million) involving a musculoskeletal injury. Visits for musculoskeletal injuries represented 5% of all healthcare visits for any cause. Visits to a physician’s office accounted for the largest share of total musculoskeletal injury healthcare visits (58%), while the 18.9 million emergency department visits for a musculoskeletal injury represented the highest share of visits for any cause (14%). (Reference Table 5B.0.1 PDF [867] CSV [868])
 [870]
[870] Records of patient visits for treatment of injuries often include a general cause of injury. In 2013, 28.3 million injury healthcare visits to hospitals and emergency departments were recorded, of which 73% (20.5 million) were musculoskeletal injuries. More than one-half ( 52%) of musculoskeletal hospital injuries were due to falls, with approximately one-fourth each due to trauma events (auto, train, boat, plane, motorcycle) or machinery, moving objects, other types of traumatic injury and other/undefined causes. Only a small proportion (3%) were due to sports injuries. Due to some admissions with multiple causes listed, percentages total more than 100%. Among emergency department visits, more than one-half of musculoskeletal injury visits were due to trauma events (51%), followed by falls as the cause of injury (36%), other/undefined cause (14%) and sports injuries (8%). (Reference Table 5B.1.1 PDF [872] CSV [873])
 [875]
[875] By sex, women are more likely to suffer a musculoskeletal injury for which healthcare is sought due to a fall, while men are more likely suffer an injury from a traumatic event or a sports injury. Age is a clear factor related to musculoskeletal injuries where hospitalization occurs, with 71% of hospitalization discharges due to an injury from a fall among those age 65 and over. Injuries from falls treated at emergency departments are spread among all age groups. Persons age 18 to 44 years represent the largest share of trauma injuries treated in both the hospital (36%) and emergency department (47%). (Reference Table 5B.1.2 PDF [876] CSV [877]and Table 5B.1.3 PDF [878] CSV [879])
 [881]
[881]
 [883]
[883] The most frequent type of injury treated as a result of a fall is a fracture, accounting for 80% of hospitalizations and 33% of emergency department visits. Fractures are also the most frequent traumatic injury seen in hospital cases (63%), but open wounds (28%) and sprains/strains (25%) are treated more frequently in the emergency department as a result of a traumatic injury. Sports injuries are tracked in the ED setting, but not the hospital. Sprains and strains accounted for 35% of sports injuries treated in the emergency department in 2013. (Reference Table 5B.1.4 PDF [884] CSV [885])
 [887]
[887]
 [889]
[889] The Centers for Disease Control (CDC) also provides data on the cause of injuries in their Web-based Injury Statistics Query and Reporting System [890] (WISQARS). Again, falls are the leading cause of unintentional nonfatal injuries (32%), with a rate of 29.2 injuries per 1,000 persons in 2015. The rate rises to 63.6/1,000 among those age 65 and over. Other common causes of unintentional injuries are struck by/against (14%) and overexertion (11%). (Reference Table 5B.1.5 PDF [891] CSV [892] and Table 5B.1.6 PDF [893] CSV [894])
 [896]
[896]
 [898]
[898]
Healthcare visits for treatment of musculoskeletal injuries include hospital discharges, emergency department visits, outpatient clinic visits, and physician’s office visits. Overall, 1 out of every 15 healthcare visits (6.8%) is for treatment of a musculoskeletal injury. In 2013, sprains and strains and fractures were the most frequently treated type of musculoskeletal injury. (Reference Table 5B.2.1 PDF [805] CSV [806])
 [900]
[900] Female injured are slightly more likely to be treated in a hospital than male (55% vs 51% of the population). Persons age 65 and over are far more likely to be treated for a musculoskeletal injury in the hospital, while those aged 45 to 64 are more likely to visit a physician’s office. Non-Hispanic whites are treated for musculoskeletal injuries in all healthcare settings more than other racial/ethnic groups. Residents of the Midwest region visit outpatient clinics for injury treatment more than residents of other regions, while those living in the West are most likely to visit a physician’s office for injury healthcare. (Reference Table 5B.2.1 PDF [805] CSV [806]; Table 5B.2.2 PDF [901] CSV [902]; Table 5B.2.3 PDF [903] CSV [904]; Table 5B.2.4 PDF [905] CSV [906])
Nearly 6 in 10 ( 58%) of musculoskeletal injuries for which healthcare treatment was sought were treated in a physician’s office. An additional 3 in 10 were treated in an emergency department and another 1 in an outpatient clinic. Less than 3% were severe enough to require hospitalization. (Reference Table 5B.2.5 PDF [907] CSV [908])
 [910]
[910] Three out of four (74%) fracture injuries admitted to the hospital are the admitting (first) diagnosis, while one in five other injuries are diagnosed as the admitting diagnoses. The ratio is much higher as the first diagnosis when treated in the emergency department. (Reference Table 5B.3 PDF [911] CSV [912])
 [914]
[914] Fractures are one of the most common musculoskeletal injuries, and can have long-term impact, particularly among the elderly. In 2013, one in five (24%) musculoskeletal injuries treated in a healthcare facility was for a fracture, with 1 in 20 persons in the population receiving care for a fracture. Data are based on visits in multiple settings and do not represent unique cases. (Reference Table 5B.2.1 PDF [805] CSV [806])
Trends in the number of fractures treated between 1998 and 2013 show relatively stable numbers. Around 3 million fractures of the upper and lower limbs are treated in emergency rooms each year, another 9 million in physician’s offices, with about 900,000 upper and lower limb fracture patients hospitalized each year. (Reference Table 5B.5.1 PDF [915] CSV [916])
 [918]
[918] Fractures of the radius and ulna (lower arm) are the most frequently treated fracture, with 2.7 million treated in 2013. These fractures are usually treated in the emergency department (ED) or a physician’s office, with a third (33%) occurring in the under 18 years of age population. Fractures of the ankle, humerus (upper arm), hand, and foot each account for 1.2 million to 1.6 million of fractures treated. These fractures occur at all ages, but more often in the middle ages of 18 to 64 years. Fracture of the neck of the femur, a serious injury with 77% occurring to persons over age 65 and more often among women, accounting for 68% of first line visits in the hospital or emergency department. Nearly 1.2 million neck of femur fractures visits were treated in 2013, with more than one-half (56%) seen initially in the ED or the hospital. (Reference Table 5B.5.2 PDF [919] CSV [920])
 [922]
[922] In 2013, fractures of the lower limb first treated in the ED had a higher rate of transfer to the hospital (35%) than did upper limb fractures (10%). This is likely due to neck of femur fractures in the older population, as 66% of lower limb fractures for persons age 65 and older treated in the ED were transferred to the hospital. However, fractures to the trunk were the most serious, and 42% treated in the ED were transferred to the hospital. When hospitalized fracture patients were discharged, more than 1 in 2 (58%) with a lower limb fracture were discharged to skilled nursing, intermediate care, or another facility, while another 11% had home healthcare. Among discharged patients age 65 and over, 80% with a lower limb fracture went to additional care while 8% had home healthcare. (Reference Table 5B.5.3 PDF [923] CSV [924]; Table 5B.5.4 PDF [925] CSV [926])
, United States 2013") [928]
[928] Sprains and strains are the most common musculoskeletal injuries treated in any healthcare facility. In 2013, one in five (26%) musculoskeletal injuries treated in a healthcare facility was for a sprain or strain, with 1 in 18 persons in the population receiving care for a sprain or strain. (Reference Table 5B.2.1 PDF [805] CSV [806]) Sprains and strains occur on a wide continuum of severity, and while mild sprains can be successfully treated at home, severe sprains sometimes require surgery to repair torn ligaments.
In 2013, sprains and strains of the back and sacroiliac joint comprised nearly one-third (30%, 7.1 million treatment episodes) of all sprains and strains for which healthcare treatment was given. Most were seen in a physician’s office (71%), with nearly all the remaining persons seen in an emergency department. Approximately 11,000 sprains and strains of the back and sacroiliac joint required hospitalization. Slightly more than 5 million sprains and strains of the shoulder and upper arm were seen by healthcare providers, as were 4.2 million sprains and strains of the ankle and foot. All totaled, more than 24 million persons with sprains and strains received medical care for these injuries in 2013. (Reference Table 5B.6.1 PDF [929] CSV [930])
 [932]
[932] When evaluated by age, in 2013 more sprains and strains were treated in persons aged 18 to 44 years than other age groups, followed by the 45 to 64 years of age group. Although there is some difference by sex, overall sprain and strain injury treatments reflect the distribution of male and female individuals in the population. The one exception is the 58% of hospital treatment for sprains and strains of the knee and leg which affect more male individuals. (Reference Table 5B.6.2 PDF [933] CSV [934])
 [936]
[936] Penetrating trauma is an injury caused by a foreign object piercing the skin, which damages the underlying tissues and results in an open wound. The most common causes of such trauma are gunshots, explosive devices, and stab wounds. Depending on the severity, it can be a puncture wound (sharp object pierces the skin and creates a small hole without entering a body cavity, such as a bite), a penetrating wound (a sharp object pierces the skin, creating a single open wound, AND enters a tissue or body cavity, such as a knife stab), or a perforating wound (object passes completely through the body, having both an entry and exit wound, such as a gunshot wound).
The most common causes of penetrating trauma in the US are gunshots and stabbings. One recent study found approximately 40% of homicides and 16% of suicides by firearm involved injuries to the torso.1 As recently as 2003, the US led in firearms-related deaths in all economically developed countries.2
A 2010 study of 157,045 trauma patients treated at 125 US trauma centers found the incidence of penetrating trauma to be significantly less than blunt trauma. Only 6.4% of all injuries were gunshots, while 1.5% were stab wounds.3 Yet, significant geographic variations and racial differences in the incidence of penetrating trauma exist. In a Los Angeles study of 12,254 trauma patients, 24% of patients treated had sustained penetrating trauma. In a similar Los Angeles study, penetrating trauma accounted for 20.4% of trauma cases, yet resulted in 50% of overall trauma deaths—most of which were due to gunshot wounds.4 Hence, the precise incidence of penetrating chest injury varies depending on the urban environment and the nature of the review. Overall, reported findings show penetrating chest injuries account for 1% to 13% of trauma admissions, and acute exploration is required in 5% to 15% of cases; exploration is required in 15% to 30% of patients who are unstable or in whom active hemorrhage is suspected.5
Although hospital and emergency department visits for penetrating injuries are a small proportion of total visits (<1%), in 2013 there were 76,000 hospital discharges and 290,400 emergency department (ED) visits with an external cause of injury defined as assault by firearms, explosives, or cutting/piercing instrument. Cutting/piercing instruments were identified for about two-thirds of the injuries (45,500 hospital discharges and 19,300 ED visits). Most of the remaining cases listed a firearm cause. (Reference Table 5B.7.1 PDF [937] CSV [938])
Males constituted a majority of persons with penetrating injuries, particularly when caused by firearms (88%) and explosives (80-85%). Two-thirds of penetrating injuries (66%-67%) occurred to persons age 18-44, even though this age group represents on 36% of the population. Residents in the South region had slightly higher rates of penetrating injuries than representative of its population. (Reference Table 5B.7.1 PDF [937] CSV [938])
 [940]
[940]
 [942]
[942] Looking at a five-year trend for penetrating injuries by race shows black, non-Hispanics carry a larger share of firearms injuries than expected for the population share, but only a slightly higher share of injuries caused by explosives or cutting/piercing instruments. (Reference Table 5B.7.3 PDF [943] CSV [944])
 [946]
[946] Hospital charges to treat injuries from firearms ($102,300) and explosives ($12,600) are much higher, on average, than the cost for all musculoskeletal injuries or all hospital discharges. Average charges for stabbing injuries ($35,400) are lower than for other causes of hospital stay. Overall in 2013, penetrating injuries accounted for $4.8 million in hospital charges. (Reference Table 5B.7.2 PDF [947] CSV [948])
The average hospital length of stay for musculoskeletal injuries in 2013 was 5.4 days, nearly a full day longer than for hospital discharges for any diagnoses (4.6 days). Persons age 45 to 64 had a slightly longer average stay (5.6 days), while those under 18 years of age had the shortest stay (4.3 days).
 [951]
[951] Dislocation injuries serious enough to require hospitalization had the longest average length of stay in 2013, nearly six days. However, except for serious sprains and strain injuries, with an average stay of just under five days (4.8), all musculoskeletal injuries had an average hospital stay of five to five-and-one-half days.
 [953]
[953] Average charges to treat musculoskeletal injuries provide a comparison between injury type and groups, but do not necessarily reflect actual cost as these are usually negotiated between providers and payors. By age, the highest average charges are for persons age 18 to 44 years ($64,700 per stay). The lowest charges are for the youngest patients (under 18 years, $47,400) and those age 65 and over ($51,000). By type of injury, dislocations have the highest average charges ($74,000 per episode), followed by fractions ($61,900). Musculoskeletal injuries have average hospital charges of $15,000 more than hospital stays for any diagnoses ($55,700 vs. $39,500). (Reference Table 5B.4.1.2 PDF [954] CSV [955])
 [957]
[957]
 [959]
[959] In general, the average length of stay and average charges for persons hospitalized with a musculoskeletal injury are longer/higher for men than for women, with the exceptions of fractures and contusions. Overall, non-Hispanic blacks have slightly longer hospital stays for musculoskeletal injuries, while Hispanics have higher average charges. By geographic region, the Northeast and South have slightly longer average stays, but the highest average charges are in the West. Fractures account for more than half the total charges for musculoskeletal injuries. (Reference Table 5B.4.1.1 PDF [960] CSV [961]; Reference Table 5B.4.1.3 PDF [962] CSV [963]; Reference Table 5B.4.1.4 PDF [964] CSV [965])
 [967]
[967] Total charges for all persons hospitalized with a musculoskeletal injury diagnoses (6.3%) comprise a larger share of total hospital charges for all discharges with any diagnoses than the comparative share of patients (4.5%). The discrepancy from 0.5% to 4.1% and is greatest for persons age 45 to 64. (Reference Table 5B.4.1.1 PDF [960] CSV [961]; Reference Table 5B.4.1.2 PDF [954] CSV [955]; Reference Table 5B.4.1.3 PDF [962] CSV [963]; Reference Table 5B.4.1.4 PDF [964] CSV [965])
 [969]
[969] Musculoskeletal injuries treated in an emergency department (ED) are usually discharged to home (90%), but nearly one in ten is admitted to the hospital (8%). This is half the rate seen for all other diagnoses presenting to the ED (16%). However, persons treated in a hospital for a musculoskeletal injury are more likely to be discharged to additional care (55%), including short-term, skilled nursing/intermediate care, or home health care, than are hospital discharges for any diagnoses (30%). (Reference Table 5B.4.2 PDF [970] CSV [971]; Table 5B.4.3 PDF [972] CSV [973])
 Discharges for Musculoskeletal Injury Discharges and All Discharges, United States 2013") [975]
[975] The type of musculoskeletal injury impacts whether additional care is likely to be required, with fracture injuries more often discharged to additional care than other types of musculoskeletal injuries. One in for (25%) of persons with fracture injuries seen in the ED are admitted to the hospital.
 [977]
[977]
 [979]
[979] Age is a significant factor related to additional care. Among those under the age of 18, 91% are discharged from the hospital to home. By the age of 65 and over, 81% are discharged to skilled nursing/intermediate care or home health care with a fracture. This compares to 25% of hospital discharges for any diagnoses.
 [981]
[981]
Falls are a major cause of unintentional musculoskeletal injuries, particularly fractures, and often the contributing cause of death within a year of the fall in older persons. Between 2000 and 2015, the age-adjusted rate of death per 100,000 persons due to falls rose from 4.8 to 9.0, nearly doubling. At the same time, the proportion of total unintentional injury deaths that were due to falls rose from 14% to 23%. (Reference Table 5C.1 PDF [982] CSV [983])
 [985]
[985] Most deaths due to falls were associated with older age, with the elderly person with already compromised health never fully recovering from their injuries, leading to death.The rate of deaths per 100,000 due to falls rose from 62.3 among persons age 75 to 84 years to 250.1 in the 85 and older age group. However, the share of deaths due to falls did not rise as steeply, accounting for 56% of total unintentional injury deaths in the 75 to 84 age group, compared with 69% in those 85 and older. Persons who fall in their mid-80s or older have a higher likelihood of dying from that fall. (Reference Table 5C.2 PDF [986] CSV [987])
 [989]
[989] Falls are also the leading cause of unintentional injuries resulting in hospitalization for most age groups. Exceptions are persons age 15 to 24 (4th ranking cause), 25 to 34 (5th), and 35 to 44 (3rd). On average, for the years 2010 to 2016, falls accounted for between 8% and 77% of all hospitalized injuries, depending on the age group, and 43% overall for all ages.1 The estimated lifetime medical and work-loss costs for all unintentional hospitalized nonfatal injuries in 2013 was $253 billion.2
One in eight (13%) unintentional injuries incurred from a fall that was severe enough to be treated in an emergency department and resulted in hospitalization in 2015. Age was a strong mitigating factor, as only 2% of these injuries among children and adolescents under 18 years of age were hospitalized, while in the 85 and older age group, 35% were hospitalized. (Reference Table 5C.3 PDF [990] CSV [991])
 [993]
[993] Workplace injuries are tracked by the US Department of Labor, Bureau of Labor Statistics [996], with data published annually on these injuries. Musculoskeletal workplace injuries include fractures, bruises/contusions, and amputations, as well as musculoskeletal disorders (MSDs). MSDs are often cumulative and include repetitive motion injuries that occur when the body reacts to strenuous repetitive motions (i.e., bending, climbing, crawling, reaching, twisting) or overexertion. MSD injuries include sprains, strains, tears, back pain, soreness, carpal tunnel syndrome, hernia, and musculoskeletal system and connective diseases. MSD cases are more severe than the average nonfatal workplace injury or illness, typically involving an average of several additional days away from work. In 2016, the median number of days away from work for all workplace injuries was 8 days;1 for MSD injuries, the median was 12 days. (Reference Table 5D.1 PDF [997] CSV [998])
The rate of nonfatal occupational injuries and illnesses has significantly decreased during the past 25 years, potentially due in part to heightened attention to workplace safety. In 1992, more than 2.3 million cases of work-related injuries and illnesses were reported by the Bureau of Labor Statistics. By 2016, the number had dropped to 892,000. A similar decline occurred in the number of MSDs. However, the relative ratio of MSDs to all workplace injuries has remained relatively steady at approximately one-third (29% to 35% range) of all workplace injuries. (Reference Table 5D.1 PDF [997] CSV [998])
 [1000]
 Men sustain workplace injuries at a higher incidence than women, with rates of 103.9 and 89.4/10,000 full-time workers, respectively, in 2016. They also are away from work an average of two days longer than women after a workplace injury. It is likely that at least a portion of the reason for this difference is the type of work involved, with men working more frequently in industries where a workplace injury is more common. Aging is a factor in median days away from work; workers less than 44 years of age had a median of less than 10 days away, while workers age 65 and over had a median of 15 days away in 2016. (Reference Table 5D.2.1 PDF [1001] CSV [1002] and Table 5D.2.2 PDF [1003] CSV [1004])
 [1006]
 The type of workplace injury incurred is a major factor in defining the median number of associated days away from work. Fractures have historically been, and remain, the injury associated with the highest number of days away from work. In the late 1990s, a median of 20 to 21 days away from work were reported for a fracture; since the early 2000s, the median days away has been about 30. Over the last few years, days away from work has risen to the mid-30s. In past years, carpal tunnel syndrome was identified as a close second in terms of days away from work (ranging from 21 to 32 days over the years 1997 to 2010), it was not listed as a condition in the latest reports. Amputations and tendonitis are the other two injury types that are associated with a median of greater than 10 days away from work.
Traumatic injuries to muscles, tendons, and ligaments account for 2 in 5 (39%) injuries resulting in days away from work. Sprains and strains have an incidence per 10,000 full-time workers, which is twice that of the next listed injury (36.3/10,000 versus 16.8) in 2016. Workers between the ages of 25 and 54 sustain the largest number of nonfatal occupational injuries that involve days away from work, possibly reflecting the ages found in the workforce. (Reference Table 5D.3.1 PDF [1007] CSV [1008]; Table 5D.3.2 PDF [1009] CSV [1010]; and Table 5D.4 PDF [1011] CSV [1012])
 [1014]
 Overexertion, either in combination with bodily reaction or involving outside sources, is the most common cause of nonfatal injuries resulting in days away from work. Together, the two types of overexertion resulted in an incidence of 51.0 per 10,000 full-time workers in 2016, with a median of 11 to 12 days away from work. For median days away from work, repetitive motions involving microtasks had the highest median days away from work (24) but had an incidence of only 2.1 per 10,000 full-time workers. (Reference Table 5D.5 PDF [1015] CSV [1016])
Workers often sustain injuries that affect multiple parts of their body. However, injuries to the upper extremities (shoulder, arm, wrist, hand), trunk (including the back), and lower extremities (knee, ankle, foot, toe) far outnumber injuries to the head, neck, other body systems, and multiple parts. In 2016, about one-third of workplace injuries involving days away from work involved the upper extremities (32%), with hand injuries the most common. Trunk and lower extremity injuries each account for about a fourth of all injuries (23% each). Knee injuries are the most common lower extremity injury. Back injuries account for three-fourths of trunk injuries. (Reference Table 5D.6 PDF [1017] CSV [1018])
 [1020]
Sports are integrally woven into the fabric of American society. From being a fan, through participation in recreational athletics, all the way to participation in competitive club, high school, collegiate, and professional athletics, sports are an important facet of our lives. Participation in sports and physical activities have several noted health and psychological benefits; however, over the past few decades, an increase in participation in both youth sports as well as recreational activity has been noted – with a resultant increase in both acute and chronic musculoskeletal injuries.
The goal of this section is to provide an overview of the epidemiology of athletic injuries in the United States population. As we ascend the athletic ladder from recreational activities to professional sports, we note an increase in participation and injury data available. However, we have poor mechanisms and infrastructure to study injuries among those engaged in the lowest levels of athletic participation. For example, there is limited data on the middle-aged person who begins jogging for fitness or the 12-year old who rides a bicycle. Similarly, as youth sports club participation has become more popular in the United States there are few resources to study injuries in this setting. We will attempt to provide an overview of these less organized athletic injuries from available data. We will also focus on higher levels of organized sports, primarily scholastic sports (high school level) and intercollegiate sports.
It is estimated that 30 million children and adolescents participate in organized sports. In addition, some 150 million adults participate in physical activity and recreational activities that are not related to their employment.1 However, both these large at-risk populations lack a systematic mechanism for tracking musculoskeletal injuries and conditions.
While professional, collegiate, and even high school athletics have epidemiologic systems in place to track injury patterns, recreational athletics lack any type of surveillance system. However, the US Consumer Product Safety Commission established the National Electronic Injury Surveillance System [1022] (NEISS) in 1997 to track emergency room visits and injury patterns associated with specific products. This database has also been helpful as a means of documenting injuries associated with athletic, physical activity, and recreational endeavors. However, a major limitation of this data is that injuries not significant enough to require an emergency room visit, or injuries that are seen in other healthcare settings (e.g., athletic training room, primary care clinic, specialty clinic) may not be documented and reported. Regardless, the NEISS probably provides the best available nationwide estimates on recreation related and physical activity injuries significant enough to require an emergency room visit.
Using the data from the NEISS, a 2002 CDC report detailed 4.3 million sports and recreation related injuries that were treated in US emergency departments.1 The injury rate was highest for boys ages 10-14. A more recent paper documented that an estimated 600,000 knee injuries present annually to emergency rooms in the United States. Of these, 49.3% resulted from participating in sports and recreation activities.2
More recent data from the NEISS for the years 2014 through 2016 reveal similar patterns. During this time period a total of 4.2 million emergency room visits were documented for injuries related to sports participation, physical activity, and recreational endeavors. Of those, 1.5 million were due to participation in team sports and 2.8 million injuries resulted from individual sports and recreational activities, of which 61% impacted the musculoskeletal system. Two out of three musculoskeletal injuries occur to males, with the proportion lower for individual sports (57%) than for team sports (77%). Of the estimated 2.8 million injuries resulting from individual sports that present annually to emergency rooms in the US, 57% impact the musculoskeletal system. Two out of three musculoskeletal injuries (65%) occur to males, with the proportion being slightly smaller among males for individual sports than for team sports. (Reference Table 5E.1.1 PDF [1023] CSV [1024])
 [1026]
Cycling and wheeled sports account for 19.9% of all recreational sports injuries and musculoskeletal injuries serious enough to warrant a visit to the ED. Fitness training results in an additional 16.3% of the total number of musculoskeletal injuries seen. Musculoskeletal injuries account for more than 50 percent of all injuries in all sports, with the exception of water sports. (Reference Table 5E.1.1 PDF [1023] CSV [1024])
 [1028]
 Musculoskeletal injuries treated in the ED as a result of a recreational sport injury occur in the highest proportion in kids ages 2 through 18. According to the latest data, nearly 60% of all musculoskeletal injuries due to participating in individual and team sports and recreational activities occur in this age range. This is, in part, due to the high number of playground injuries, as well as biking and other wheeled equipment, such as skateboards and scooters, but kids account for a higher proportion of treated sports injuries in all but a few sports that are more adult focused. Adults between the ages of 19 and 44 also account for a substantial proportion (29%) of treated musculoskeletal injuries, but they are also a larger share of the population and more likely to be active in recreational sport activities. (Reference Table 5E.1.2.1 PDF [1029] CSV [1030])
 [1032]
 Sprains and strains, primarily affecting the joints and muscles, are the most common reason for seeking care in the emergency department for sports and physical activity related injuries. An estimated 41.2% of musculoskeletal injuries seen in emergency departments due to participating in recreational sports and physical activities result in sprains or strains, followed by bone fractures (30.4%), contusions (24.3%), and joint dislocations (3.8%). (Reference Table 5E.1.3 PDF [1033] CSV [1034])
 [1036]
 Injuries from team and individual sports to the extremities are the most common, with 41.3% occurring in the upper extremity compared with 37.5% in the lower extremity. The trunk sustains most of the remaining injuries (14.4%), with less than 6% involving the head, although head injuries are often unreported. (Reference Table 5E.1.4 PDF CSV) Among team sports, kids age 2 to 12 are the most likely to injure the upper extremity in all except those playing hockey, where participation numbers in this age range are low. (Reference Table 5E.1.7 PDF [1037] CSV [1038])
 [1040]
 Nearly all (96%) musculoskeletal injuries due to sports and recreational activities seen in the ED are treated and released. This compares to just over 81% for all emergency department visits. Only 3% of recreational activity and sports injuries seen in EDs result in hospitalization. Among individual sports, 4.1% of musculoskeletal injuries seen in the ED resulted in hospitalization with the highest proportion of injuries from mountain climbing (12.1%), all-terrain vehicles and motorized bikes (8.1%), and bicycle/wheeled activities (bicycles, skateboards, scooters, etc.) (6.1%). Among team sports only 1.1% of injuries seen in the ED resulted in hospitalization, with the highest proportion reported in soccer (1.5%), followed by hockey (1.4%) and football (1.3%). (Reference Table 5E.1.5 PDF [1041] CSV [1042])
 [1044]
 It is not surprising that the majority of injuries treated in emergency departments due to sports participation and recreational physical activities occur on sports fields (37.5%), with 50.9% of team sports injuries and 29.2% of individual sports injuries occurring in this setting. (Reference Table 5E.1.6 PDF [1045] CSV [1046])
 [1048]
 Scholastic sports have nearly doubled from an estimated 4.0 million participants in 1971-1972 1 to 7.98 million participants in 2017-2018.2 These high school athletes experienced an estimated 1.4 million injuries in 2017-2018.3 Data from the National High School Sports-Related Injury Surveillance System [1049] using RIO (Reporting Information Online) as a surveillance system, was used to examine injury rates and trends. This data provides quality epidemiologic information entered by athletic trainers associated with participating high schools and provides nationwide estimates for injury incidence rates in common high school sports.
Using the National High School Sports-Related Injury Surveillance Study, it was estimated that more than 17 million injuries resulted from participation in team sports at the high school level during the 13 years studied between the 2005-2006 and 2017-2018 school years. On average, of the total injuries documented during the surveillance period, strains/sprains accounted for 44%, concussions represented 18%, contusions comprised 11%, and fractures were documented in 9% of cases. Injuries categorized as “other” comprised 18% of all injuries. Overall, the majority of injuries from participating in high school athletics impacted the musculoskeletal system.4
 [1051]
 Football had the highest injury incidence rate for musculoskeletal injuries among all team sports at the high school level, followed by girls’ soccer and boys’ wrestling. In 2017-2018, football also had the greatest number of total injuries as well. In every sport besides girls’ volleyball and boys’ wrestling, more injuries occurred during competition when compared to practice.
Musculoskeletal injuries occur at numerous different sites throughout the body. On average, between 2012 and 2018, 21% of all injuries were to the head/face, 17.5% impacted the ankle, 14.5% occurred in the knee, 9.5% affected the hip/thigh/upper leg, 7.5% affected the shoulder, 8% were to the hand/wrist, 5% to the trunk, 5% to the lower leg, 4% to the arm/elbow, 4% affected the foot, and 2% of all injuries were to the neck. Injuries categorized as “other” comprised 2% of all injures. The ankle and knee, two of the most injured joints accounted for a combined total of 32% of all musculoskeletal injuries among high school athletes.5 This is consistent with the most recent data available for the 2017-18 academic year.6
 [1053]
 Musculoskeletal injuries also account for substantial time loss from playing a sport. On average, between 2012 and 2018, 17% of all injuries resulted in 1-2 days of time loss; 24% resulted in 3-6 days of time loss; 16% resulted in 7-9 days of time loss; 19% resulted in 10-21 days of time loss; and 23% resulted in greater than 21 days of time loss or medical disqualification for the season, medical disqualification for the career, or an injury that did not resolve prior to the end of the season permitting return to play. One in four (24%) resulted in 3-6 days of time loss, which can equate to missing an entire week of practice and games, but nearly as many (23%) injuries resulted in missing 22 or more days or not returning to sport during the same season.7 During the same time period, between 5.3% and 8.2% of injuries annually required surgical intervention to repair.8
Though nearly 95% of all sports-related injuries seen in emergency departments are treated and released, as noted in the discussion of recreational athletics above, emergency medical system (EMS) transport among high school athletes is relatively uncommon. The overall rate of EMS transport among high school athletes participating in organized sports is 0.29 transports per 10,000 athlete exposures, according to a recent report.9 Nearly 60% of the injuries requiring EMS transport impacted the musculoskeletal system, with the most common injuries including fractures (24%), strains (12%), dislocations (11%), and sprains (10.3%).
Trends in annual injury incidence rates for high school athletes over time are presented in Graphs 5E.2.3a thru 5E.2.3h and the total annual number of injuries among high school athletes over time based on the RIO data are presented in Graph 5E.2.4. Overall, these data have remained relatively stable between 2005-2006 and 2017-2018. Annual incidence rates over time for specific high school sports during this time period are also presented. Some significant trends have been reported.10 Specifically, there have been statistically significant decreases in the annual injury incidence rate for boys’ high school soccer and basketball during practice sessions; however, there has also been a significant increase in the annual incidence rate for girls’ high school soccer in competitions.
 [1055]
 [1057]
 [1059]
 [1061]
 [1063]
 [1065]
 [1067]
 [1069]
 [1071]
 [1073]
 [1075]
 While less data is available on long term health impacts of musculoskeletal injuries in scholastic athletes, one such study by McLeod and colleagues offers insight into the significant impact of athletic injury in this large population.11 The research team studied a convenience sample of 160 uninjured and 45 injured scholastic athletes with health-related quality of life measures. They found significantly lower scores among the injured athletes for the following subscores of the Quality of Life Short Form Questionnaire (SF-36):12 physical functioning, limitations due to health problems, bodily pain, social functioning, and the physical composite score. These findings suggest that physical injuries in our young athletes affect not only their physical function and risk for future musculoskeletal injury and disability, but also extend beyond the physical aspects of overall health. Limited data is available on the long-term health related impact of musculoskeletal injuries experienced by high school athletes.
The National Collegiate Athletic Association [1079] (NCAA) is a non-profit association that regulates athletes of more than 1,200 institutions, conferences, organizations, and individuals that organize athletic programs of many colleges and universities in the United States and Canada. Athletic programs of more than 1,100 member schools that compete are divided into three levels or divisions.1 Nearly a half-million student-athletes participate in NCAA sports that offer national championships annually, and this number continues to grow. During the 2018-2019 academic year, the number of teams competing in NCAA championship sponsored sports reached an all-time high of 19,750. However, only about 6% of high school athletes will participate in NCAA intercollegiate sports.2
While there are numerous benefits associated with participating in collegiate athletics, there is also an increased risk of injury associated with participating in many types of sports. These injuries primarily affect the musculoskeletal system, in general, and the lower and upper extremities specifically. Though awareness of risk of injury associated with participating in collegiate athletics is growing, there is little known about the long-term impact of injuries sustained while participating in collegiate athletics. Recent injury data from the NCAA Injury Surveillance System [1080], as well as reports for specific joint injuries sustained by NCAA athletes and emerging data on the potential long-term impact of these injuries on health related quality of life, is presented.
For over 30 years, the NCAA and the Datalys Center [1081] (since 2009) has been engaged in active injury surveillance within the unique population of college athletes. Collaborative efforts between the NCAA and the National Athletic Trainers’ Association [1082] (NATA) have yielded rich injury surveillance data used to inform important rule changes to protect player safety.3 In a 2007 special issue of The Journal of Athletic Training, data from the NCAA injury surveillance system from the 1988-89 academic year through the 2003-2004 academic year were reviewed for 15 collegiate sports.4 With permission from the publisher, data from this study is included in this site. To read the full article, click here [1083].
The 15 sports examined included five fall sports (men’s football, women’s field hockey, men’s soccer, women’s soccer, and women’s volleyball), six winter sports (men’s basketball, women’s basketball, women’s gymnastics, men’s gymnastics, men’s ice hockey, and men’s wrestling), and five spring sports (men’s baseball, men’s football, women’s softball, men’s lacrosse, and women’s lacrosse). Data for men’s spring football were only included in the analysis of practice injuries. These data provided an overall summary of the NCAA data from the years 1988-1989 through 2003-2004, made recommendations for injury prevention initiatives, and provided insight into the burden of musculoskeletal injury experienced by collegiate athletes. Some of these data are highlighted in this section. More recently, a series of papers on the first decade of web-based injury surveillance in high school and collegiate athletes have been published.5,6,7,8,9,10,11 These data are also briefly integrated here, as appropriate, as they provide further insight into the incidence and burden of musculoskeletal injuries in collegiate athletes. Overall, musculoskeletal injuries to the upper and lower extremity account for approximately 80% of all injuries among NCAA athletes; however, injury patterns vary slightly by sport. The CDC, which estimates 2.6 million children ages 0 through 19 years are treated in emergency departments each year for sports and recreation related injuries12, provides tips on how to prevent sports-related injuries in their Protect the Ones You Love Initiative [1084]. Other professional societies and associations such as the American Orthopaedic Society for Sports Medicine’s (AOSSM) At Your Own Risk [1085]and Stop Sports Injuries [1086], and the National Athletic Trainers Association (NATA) Position Statements [1087] also provide recommendations for injury prevention.
Overall, incidence rates for the 15 sports examined range from a high of 35.9 per 1,000 game athlete-exposures for men’s football to a low of 1.9 for men’s practice basketball. Among men, the highest injury rates were observed in football, wrestling, soccer, and ice hockey. Among women, the highest injury rates were experienced in soccer, gymnastics, ice hockey, and field hockey. (Reference Table 5E.3.2 PDF [1088] CSV [1089])
 [1091]
 [1097]
 The majority of injuries resulted from contact with another player, regardless of whether or not injuries were sustained in practices or games. (Reference Table 5E.3.4 PDF [1098] CSV [1099])
 [1101]
 The majority of injuries documented during the study period affected the musculoskeletal system, with 72% of all injuries in games and 75% of all injuries in practices affecting the extremities. Regardless of whether injuries occurred in practices or games, over half of all injuries reported across the 15 sports examined during the study period were to the lower extremity. (Reference Table 5E.3.5 PDF [1102] CSV [1103])
 [1105]
 The NCAA injury surveillance system has also been used to examine the incidence and injury patterns of specific injuries among collegiate athletes.13,14These studies have primarily focused on those injuries that likely have the greatest burden in terms of time loss from sport, the need for surgical intervention, and the potential for long-term impact on health. Specifically, joint injuries have been a primary concern as it is well documented that these injuries can lead to chronic instability and increase the risk of osteoarthritis and degenerative joint disease.
Acute traumatic anterior cruciate ligament (ACL) injuries in the knee often lead to chronic pain and instability, and generally require surgical repair to restore function and stability. There is also substantial evidence to suggest that acute traumatic knee joint injuries such as ACL tears significantly increase the risk for post-traumatic osteoarthritis. Several studies have focused on the rate of ACL injuries among collegiate athletes.4,11,15,16,17 estimated that approximately 2,000 athletes participating in 15 different men’s and women’s NCAA sports sustain an ACL tear annually. The average annual rate of ACL injury during the 16-year study period examined was 0.15 per 1,000 athlete-exposures. Arendt and Dick16 first reported that there were disparities in ACL injury incidence rates between males and females participating in the NCAA gender matched sports of soccer and basketball. This observation was confirmed in a follow-up study that examined data from 1990 through 2002.15 The authors reported that the rate of ACL injuries was 3 times higher in female soccer players (0.33) when compared to male soccer players (0.11). Similarly, they reported that the rate of ACL injuries was 3.6 times higher in female basketball players (0.29) when compared to males (0.08). Regardless of sport, the rates in females were significantly higher when compared to males. They also reported that ACL injury rates declined significantly in male soccer players during the study period but remained constant among female soccer players. (Reference Table 5E.3.6 PDF [1106] CSV [1107])
 Injuries for Games and Practices Combined for 15 Sports, United States 1988-1989 to 2003-2004") [1109]
[1109] Despite the decreases in ACL injury rates observed by Agel et al15 in male soccer players, Hootman et al4 reported that ACL injury rates among males and females combined, participating in 15 different NCAA sports, significantly increased during the 16-year study period. On average, they reported a 1.3% annual increase in the rate of ACL injury over time (P=0.02). (Reference Table 5E.3.7 PDF [1094] CSV [1095])
 [1111]
 Dragoo et al13 compared ACL injury rates between NCAA football players participating on artificial turf and those participating on natural grass. They reported that the rate of ACL injury on artificial surfaces was significantly higher (1.39 times higher) than the injury rate on grass surfaces. A more recent study reports the injury rate on artificial turf 1.63 times higher than on grass surfaces.18 They also noted that non-contact injuries occurred more frequently on artificial turf surfaces (44%) than on natural grass (36%).
Ankle sprains are also common among NCAA athletes and they frequently lead to chronic pain, instability, and functional limitations. Hootman et al4 estimated that approximately 11,000 athletes participating in 15 different men’s and women’s NCAA sports sustain an ankle sprain annually. The average annual rate of ankle sprain injury during the 16-year study period examined was 0.86 per 1,000 athlete-exposures. They also examined the annual injury rates for ankle sprains among males and females participating in these sports combined between 1988 and 2004. They reported that injury rates remained constant during the 16-year study period. On average, there was a non-significant 0.1% (P=0.68) annual decrease in the rate of ankle sprains during the study period. (Reference Table 5E.3.6 PDF [1106] CSV [1107])
 [1113]
 Shoulder injuries, especially those that result in instability, also impact a significant number of NCAA athletes and can lead to chronic pain, recurrent instability, and functional limitations. Recurrent shoulder instability has also been associated with the increased risk of osteoarthritis in the shoulder. Surgical reconstruction is common following shoulder instability in young athletes. Owens et al14 examined the injury rates and patterns for shoulder instability among NCAA athletes over the 16-year period from 1988 through 2004 in the same 15 sports described previously. The overall injury rate for shoulder instability during the study period was 0.12 per 1,000 athlete-exposures. On average, this is comparable to just under 2,000 shoulder instability events experienced annually in NCAA athletes. Injury rates for shoulder instability were significantly higher in games when compared to practice. Overall, NCAA athletes were 3.5 (95% CI: 3.29-3.73) times more likely to experience shoulder instability events in games when compared to practices. Just over half (53%) of the shoulder instability events documented during the study period were first time instability events, with the remaining injuries being recurrent instability events (47%). Most shoulder instability events were due to contact with another athlete (68%) and other contact (20%). Nearly half (45%) of all shoulder instability events experienced by NCAA athletes during the study period resulted at least 10 days of lost playing time, with the remainder returning to play within 10 days of injury.
While we still have a rudimentary understanding of the impact that musculoskeletal injuries sustained by collegiate athletes have on long-term health outcomes, studies have recently begun to examine health-related quality of life in current and former NCAA athletes. McAllister et al1 evaluated health-related quality of life in NCAA Division I athletes using the SF-362 and examined the association between scores, injury history and severity. Collegiate athletes who reported a history of mild injury had significantly lower physical component summary scale scores, role physical scores, bodily pain scores, social function scores, and general health scores on the SF-36 when compared to those with no history of injury. Collegiate athletes who reported a serious injury had significantly lower scores on all SF-36 component scores when compared to athletes with no history of injury. Similar results were observed in a separate study that examined NCAA Division I and Division II athletes.3
More recently, studies have examined health-related quality of life in former NCAA athletes. Sorenson et al4 reported that former NCAA Division I athletes were significantly more likely to have joint-related health concerns when compared to non-athletes and were 14 times more likely to seek professional treatment for their symptoms. They also reported that the prevalence of joint related health concerns was significantly higher in older former athletes when compared to younger former athletes.
In a similar study, Simon et al5 examined health-related quality of life in former NCAA Division I athletes and former non-athletes using the Patient-Reported Outcomes Measurement Information System (PROMIS).6 They reported that former collegiate athletes report significantly worse scores for 5 of the 7 PROMIS scales examined when compared to non-athletes. Specifically, former athletes reported poorer scores on the physical function, depression, fatigue, sleep disturbances, and pain interference scales. There were no differences noted between former NCAA athletes and non-athletes for the anxiety and satisfaction with participation in social roles scales. The authors also noted that former collegiate athletes reported significantly more major injuries, chronic injuries, daily limitations, and physical activity limitations when compared to non-athletes.
Overall, these studies suggest that NCAA athletes who sustain injuries during their college years have significantly lower health-related quality of life scores, and that these scores may get worse with time, particularly for joint-related health issues and long-term major and chronic injuries. Decreased health-related quality of life in former college athletes may also contribute to greater daily activity and physical activity limitations when compared to non-athletes and may lead to significant chronic health comorbidities. Further research is needed to determine which factors contribute to the poorer health-related quality of life outcomes observed among former collegiate athletes in these studies.
The burden of musculoskeletal issues on the military population cannot be overstated. Further, the impact of these injuries does not stop when the service member transitions out of the military. Musculoskeletal injuries and conditions are one of the greatest threats to our military’s readiness and troops ability to deploy and as such, bear a substantial significance for our society as a whole.1,2 Further, inability to return to full duty due to musculoskeletal injury or pre-existing musculoskeletal condition is the most common reason for medical discharge from the Armed Services across all branches,3,4 with almost 78% of male Army personnel and 85% of females with a disability discharge discharged due to a musculoskeletal injury or condition.4 There is anecdotal and some scientific evidence on medical discharges from the British armed forces that females in military service experience an excess of work-related injuries, compared with males.5
During Fiscal Year 2016, there were nearly 1.3 million active duty service members (enlisted plus officers) and an additional 860,000 Reserve and National Guard members. Among all branches of the Department of Defense enlisted personnel (1.06 million), 84% are male and 16% female. Female personnel were slightly younger, with 86% under the age of 35, compared to 83% of male personnel under 35 years of age. This is nearly double the percentage of the civilian population under age 35, years where in both male and female persons only 44% is under 35 years of age. The Marine Corps has the highest proportion of personnel under the age of 35 years, with 92.5% of the enlisted component of the Marine Corps less than 35 years. The young age and high activity level of the active duty military population brings about a unique set of musculoskeletal conditions. (Reference Table 5F.0.1 PDF [1116] CSV [1117] and Table 5F.0.2 PDF [1118] CSV [1119]) (G5F.0.1, G5F.0.2, G5F.0.3)
 [1121]
 [1123]
 [1125]
 The military summary data presented here is largely derived from the Defense Medical Surveillance System (DMSS) from the Medical Surveillance Monthly Report (MSMR) annual reports on non-deployed, Active Duty United States military personnel. The DMSS examines total numbers of hospitalizations and ambulatory visits broken down by a defined set of diagnostic categories based on ICD-9-CM, and in the most recent years the ICD-10-CM, codes. In general, musculoskeletal injuries and conditions are compiled into two major diagnostic classifications, “injury and poisoning” or “musculoskeletal system” conditions. Typically, diagnoses included in the “injury and poisoning” category are more acute in nature (i.e. fractures, ligament tears, shoulder dislocations, etc.), while more chronic conditions (i.e. osteoarthritis, tendinitis, stress fractures, etc.) are included in the “musculoskeletal system” category.
Excluding pregnancy-related visits, ”injury and poisoning” and “musculoskeletal system” are consistently amongst the top causes for hospitalization and consistently ranked second and fourth most frequent diagnoses across all military personnel. Mental disorders and digestive systems are commonly ranked first and third. This illustrates the significant overall burden of musculoskeletal problems in relation to all other medical conditions treated at Military Treatment Facilities (MTFs). (Reference Table 5F.1.1.1 PDF [1128] CSV [1129])
 [1131]
 Broken down by service branch, the rate of hospitalization per person-year for all diagnostic categories is higher for Army personnel than for other service branches. Since the Army has more than double the number of personnel in other branches, the absolute number of hospitalizations is much higher and therefore not a valid comparison point. (Reference Table 5F.1.1.2 PDF [1132] CSV [1133])
 [1135]
 The total morbidity burden (hospitalizations plus ambulatory visits) for injury/poisoning events ranks as the number one cause of medical treatment received at MTFs. More than 540,000 service members were treated annually for an injury/poisoning event each year from 2012 to 2017. This accounted for roughly 25% of all encounters at military hospitals over that time frame. Additionally, injury/poisoning events resulted in 12% of hospital bed days and ultimately almost 25% of lost work time. (Reference Table 5F.1.1.3 PDF [1136] CSV [1137])
 [1139]
 Musculoskeletal injuries in the military encompass a wide range of pathology from chronic overuse conditions to acute injuries from training accidents to high energy blast injuries sustained on deployments. Given the overall young age of military cohorts, injuries sustained are often sports or training related and not unlike what would be seen in a civilian Sports Medicine practice; however, these injuries often occur at a higher incidence when compared with their civilian counterparts. The high energy blast injuries that we grew accustomed to during the heights of the Operation Iraqi Freedom (OIF) and Operation Enduring Freedom (OEF) conflicts have decreased over the last decade yet still remain a significant cause for morbidity and mortality amongst the military population.1
In 2012, battle injuries comprised 7% of hospitalization due to injury but fell to 1% or less in subsequent years. The overall rate of hospitalization for injuries/poisoning events has fallen over the last five years from 7.7 per 1,000 person-years in 2012 to 5.0 per 1,000 person-years in 2017. The most common cause of hospitalized injuries reported was falls. In recent years, however, the cause of more than half of hospitalizations due to injury was not identified, which makes a direct comparison challenging. (Reference Table 5F.1.2.1 PDF [1140] CSV [1141])
 [1143]
 The rate of hospitalization for injuries per person-year is consistently highest in the Army and lowest in the Air Force. Based on the 2016 distribution of Armed Forces by sex (84% male; 16% female), females are slightly less likely to be hospitalized for an injury/poisoning event across all branches. (Reference Table 5F.1.2.2 PDF [1144] CSV [1145] and Table 5F.1.2.3 PDF [1146] CSV [1147])
 [1149]
 The most common reason for ambulatory visits within the military has consistently been the “musculoskeletal system,” and the rate per person year has steadily increased over the 2012 to 2017 time period. Additionally, injury and poisonings are the 5th most common cause of ambulatory healthcare visits in the US Armed Forces, which also increased over the time period between 2012 and 2017. While the absolute number of visits is impacted by the annual end strength of the Armed Forces, the rate of ambulatory visits has not changed considerably between 2012 and 2017 despite fluctuations in total number of personnel. Overall, more than half the active component of the Armed Forces personnel had an ambulatory visit for an injury event each year resulting in an annual per person rate of 0.6-0.7, or roughly two in three personnel.
The direct care system (DCS) includes military treatment facilities (MTF) comprised of medical centers, hospitals, and clinics found at military bases and posts in the US and around the world dedicated to providing healthcare to DoD-eligible beneficiaries and staffed and run by DoD personnel. In addition, the military health system (MHS) provides purchased care contracted outside of an MTF that provides or supplements care to beneficiaries that is either unavailable in the DCS or falls outside the MTF market area.
For personnel treated at a MTF, disposition (ie, full, light or limited duty) of patients are tracked closely. In 2017, the illness-and injury-related diagnostic categories with the highest proportions of “limited-duty” dispositions were injuries and poisonings (17.5%) and musculoskeletal disorders (13%).1 However, treatment visits in purchased care facilities are not always identified. (Reference Table 5F.1.3.1 PDF [1150] CSV [1151] and Table 5F.1.3.3 PDF [1152] CSV [1153])
 [1155]
 Unlike hospitalizations for injury/poisoning events, where females are slightly less likely to be hospitalized, they are slightly more likely to have an ambulatory visit. (Reference Table 5F.1.3.2 PDF [1156] CSV [1157])
The diagnostic cause of ambulatory visits for injury/poisoning events is also provided in the MSMR Annual Summary Edition. While the proportion of visits varies somewhat by year and by sex, injury causes are consistent overall with the top two injuries being ankle sprains and sprains of the cruciate ligament of the knee. Between 8% and 10% of all ambulatory injuries are a sprain of the ankle, with foot injuries sometimes included in this diagnosis category depending on coding. Sprains of the cruciate ligament (knee) is the second most common, accounting for 3% to 4% of injuries. Sprains and strains of the shoulder and upper arm are more common among males, while females are more often diagnosed with sprain of the hip. (Reference Table 5F.1.3.4 PDF [1158] CSV [1159])
Routine, repetitive physical training and job requirements place service members at risk for common overuse conditions throughout the body. Prolonged overhead activities combined with routine physical training involving push-ups and pull-ups place this population at risk of developing common chronic conditions of the upper extremity. Some of the most common conditions include shoulder impingement, rotator cuff tendinopathy, medial and lateral epicondylitis, and degenerative wrist conditions like scapholunate advanced collapse (SLAC) and scaphoid nonunion advanced collapse (SNAC). Patellofemoral syndrome, patellar tendinitis, and iliotibial band syndrome are among the common overuse injuries affecting the knee in activity duty military populations. Ankle sprains leading to chronic ankle instability are also a common cause of disability in this cohort and occur at a rate 5-6 times higher than in the general population.2 Finally, chronic back and neck issues are a significant cause of morbidity and can ultimately result in the inability of the patient to perform the duties required of them to remain on Active Duty.
Stress fractures have long been a subject of interest in the military population given the treatment cost and significant time lost to injury this condition has. A recent epidemiological study found 31,758 lower extremity stress fractures occurred over a three-year time period, with 40% occurring in the tibia/fibula, 16% in the metatarsals, 9% in the femoral neck, 6% in the femoral shaft, and 30% in other unspecified bones.3 Females had a significantly increased risk of suffering from a stress fracture in any bone compared to their male counterparts; nearly 3-fold in this study. This gender difference has been repeatedly demonstrated and is attributed to anatomic, physiologic, and endocrinologic differences between males and females.4,5,6 Given the significant burden this condition has on troop readiness, identifying those at risk for stress fractures and improving prevention strategies should be a primary research focus going forward.
Acute injuries in the Active Duty population occur most commonly as a result of training accidents or sporting injuries. Causes of injury hospitalizations are coded according to the coding scheme outlined in the North Atlantic Treaty Organization (NATO) Standardization Agreement (STANAG) No. 2050, ed. 5.7
Falls and land transport consistently rank as the top unintentional causes for injury hospitalizations. Among all medical encounters for injuries and poisoning events (both hospitalization and ambulatory), musculoskeletal injuries to the knee, arm and shoulder, and foot and ankle all consistently rank in the top 10 out of 142 disease conditions. This is true both in total number of encounters and individuals affected, comprising at least two-thirds of medical encounters and more than one-half of individuals affected attributable to injuries and poisoning. (Reference Table 5F.1.4.1 PDF [1160] CSV [1161] and Table 5F.1.4.2 PDF [1162] CSV [1163])
 [1165]
 Among the most common acute injuries managed in the military population are fractures, ligamentous or meniscal knee injuries, and shoulder dislocations. Fractures can occur anywhere in the body but most often are seen in the hand and wrist (metacarpals, scaphoid, distal radius), ankle, and clavicle in the active duty population, and occur at a higher incidence than their civilian counterparts.8,9,10 These fractures often require operative fixation resulting in significant lost duty time and an increased likelihood that the patient is unable to return to full duty.
Multiple studies have shown an almost 10-fold higher incidence of anterior cruciate ligament and meniscal injuries in active duty service members compared to the general population.11,12,13 In contrast to injury patterns seen in civilians, men were at increased risks of sustaining these injuries compared to females; this may be attributable to differences in occupational tasks and activities between men and women in the military.
Shoulder dislocations and resultant shoulder instability are ubiquitous in the Active Duty population; a 7 to 21 times higher incidence of shoulder dislocation injury has been reported compared to the general population.14,15 These injuries often require surgical repair in this population with approximately 9% of those who require surgery being discharged for disability due to their injury.16
Identifying those at risk of sustaining these debilitating injuries and implementing preventive strategies should be of utmost importance in attempting to curb the resultant costly disability to our military members.
The true cost of military injuries is difficult to define due to the complexity of injuries and the long-lasting implications on the service member. In addition to actual treatment costs of the index injuries, we must take into account the added financial burden associated with time away from duty, long-term care for severely injured, and the effects of war trauma. In recent years (2012 to 2017), injuries and poisoning events cost a morbidity burden of 40,000 to 68,000 bed days among active category Armed Forces personnel. (Reference Table 5F.1.4.3 PDF [1166] CSV [1167])
 [1169]
 The Army has estimated the cost of Basic Combat Training (BCT) injuries to be $22 million annually for treatment of the 40% of men and 61% of women who sustain BCT-related injuries annually. The most common types of injuries were sprains, strains, joint pain, and back pain.1
Injury costs associated with the ongoing conflicts in Iraq and Afghanistan will be staggering for decades to come. One out of every two veterans from these two conflicts has already applied for permanent disability benefits. Higher survival rates for amputees and other catastrophic injuries that require life-long care further add to the economic burden of these disability costs associated with musculoskeletal injuries. The present value of the expected total medical care for Operation Enduring Freedom (OEF), Operation Iraqi Freedom (OIF), and Operation New Dawn (OND) veterans already committed to be delivered over the next forty years is projected to be $288 billion.2
The impact of musculoskeletal injuries on the service member does not stop when they leave the military. Degenerative conditions have been shown to plague the aging military population. Fragility fractures are less common in the active duty population, but certainly have a profound effect on the Veteran community. The years of consistent physical demands placed on the bodies of Active Duty service members results in life-long musculoskeletal issues, particularly post-traumatic arthritis, as well as psychological disturbances from chronic pain.
It has been shown that US military personnel develop osteoarthritis of the knee at rates up to 50% higher than age matched civilian counterparts.1 A recent retrospective review of total knee arthroplasty in active duty service members under age 50 years, found that nearly 75% of the knees had experienced prior ligamentous, meniscal, or chondral injury prior to arthroplasty, compared to 9.8% observed in a high volume civilian adult reconstruction practice.2 They reported an average of 17.2 years from injury to arthroplasty in this population.3 There is a paucity of data examining the prevalence of post-traumatic osteoarthritis of other major joints, including the hip, shoulder, and ankle, in the military population, but is believed to be significant.
Chronic pain and opioid abuse are endemic in our country; the military and veteran communities are not immune from these issues. Traumatic brain injuries, post-concussive syndrome, post traumatic stress disorder, and behavioral health disorders, combined with the stigma attached to these issues, complicates the diagnosis and treatment of chronic pain in this patient group. Chronic pain due to musculoskeletal pain and combat-related polytrauma pain has been reported in up to 50% of the Veteran community and 44% among US service members after combat deployment compared to 26% in the general population.4
Extremity trauma resulting from high-energy explosives in Iraq and Afghanistan was common; 54% of evacuated wounded service members had extremity injures. More than one-quarter (26%) of all extremity war injuries involved fractures; 82% were open.5 The Military Extremity Amputation/Limb Salvage (METALS) Study found that participants with a unilateral or bilateral amputation had significantly better SMFA functional outcomes than those whose limbs had been salvaged. This is contrary to what was found in the civilian LEAP study, where there were no significant differences in outcomes at two or seven years post injury.5 Amputees were nearly three times as likely to be engaged in a vigorous sport or recreational activity. However, the percentage working/on active duty or in school was the same, as were the rates of depression.5 Future key challenges in this population after discharge from military service include: access to care, prosthetic maintenance, activities of daily living, vocational rehabilitation, and quality of life.
The burden of musculoskeletal disease on the military population is vast and spans across the service member’s lifetime. The physical nature demanded by military requirements places its Active Duty and Reserve members at risk of suffering from acute, chronic, and life-long musculoskeletal conditions. Great strides have been made in developing ways to prevent and identify these issues sooner, but much work remains to be done.
Falls are the major cause of musculoskeletal injury among the elderly, with a rate in 2015 per 1,000 persons that was more than twice that for all ages (63.6/1000 versus 29.1/1000). Falls are also a major cause of death among the oldest old, those 85 and over. (Reference Table 5B.1.6 PDF [893] CSV [894])
 [1173]
 [1175]
 While persons aged 65 and older account for only 14% of the total U.S. population, they represent more than one-half (53%) of patients admitted to the hospital with a musculoskeletal injury. Among the 65 and over population, fractures account for 57% of injuries with a hospital stay and 28% of emergency department visits. (Reference Table 5B.2.1 PDF [805] CSV [806])
 [1177]
 More than three out of four (77%) fractures of the neck of femur, commonly known as a hip fracture, were treated for persons age 65 and over in 2013. Fractures of the humerus (upper arm) were also highest among the 65+ population, with 40% treated in this age group. (Reference Table 5B.2.2 PDF [901] CSV [902])
 [1179]
 In 2013, the proportion of hospital discharge patients age 65 and over with a musculoskeletal injury who were transferred to a skilled nursing, intermediate care or other long-term care facility was nearly three in four (71%). This compares to 48% of fracture patients among all ages, and only 14% for all ages, all diagnoses. Another 10% are discharged with home healthcare. (Reference Table 5B.4.2 PDF [970] CSV [971])
 [1181]
 With current average life expectancies of persons in their 40s, 50s, and 60s in the United States well beyond the age of 80, the risk of incurring a musculoskeletal injury, and, in particular, a fracture, is significant.
Between the years 1996-1998 and 2012-2014, the number of persons in the population reporting a musculoskeletal injury rose only slightly, from 23.4 million to 26.3 million, resulting in a slight decline in the proportion of the population with a musculoskeletal injury (8.6% to 8.3%). However, the distribution of the population with a musculoskeletal injury, by age group, showed a consistent shift upward as the population ages, reflecting the overall aging of the U.S. population. Persons in the 44 to 64-year age group showed the sharpest increase, but there was a jump in the 65 and over population as the Baby Boomers cohort ages. (Reference Table 8.1.5 PDF [1182] CSV [1183])
 [1185]
 Healthcare treatments and visits contribute to the burden of musculoskeletal injuries. Ambulatory nonphysicians are showing the fastest rise in the number of healthcare visits for musculoskeletal injuries (130%) between the years 1996-1998 to 2012-2014, from 54 million to 124 million visits, and are starting to approach physician office visits, which averaged 145 million visits per year 2012-2014. Hospital discharges for musculoskeletal injuries remain a very small proportion of overall treatment visits (< 3 million), indicating that most musculoskeletal injuries are not serious enough to require hospitalization. Prescription medications for musculoskeletal injuries more than doubled over the time frame, jumping from 201 million prescriptions to 423 million between 1996-1998 and 2012-2014, an increase of 111%. (Reference Table 8.2.5 PDF [1186] CSV [1187])
 [1189]
 In recent years, ambulatory care visits account for the largest share of per person direct cost for persons with a musculoskeletal injury, with the share increasing while inpatient costs share drops. In 2014 dollars, the average cost per person in 2012-2014 for ambulatory care was $2,949, an increase of 109% from 1996-1998, although the share of total costs increased only 3% (33% to 36%). The share of mean per person cost for inpatient care dropped from 34% to 28% between 1996-1998 and 2012-2014, but the mean cost in 2014 dollars rose from $1,421 to $2,283, an increase of 61%. At the same time, the average per person cost for prescriptions rose from $444 to $1,569, an increase of 253%. (Reference Table 8.4.5 PDF [1190] CSV [1191])
 [1193]
 Total direct per person healthcare cost for persons with a musculoskeletal injury were $8,135, an increase of 93% since 1996-1998, in 2014 dollars. Incremental direct per person costs, those costs most likely attributable to a musculoskeletal injury, rose from $1,261 to $2,022, in 2014 dollars, an increase of 60%. Total aggregate direct costs for persons with a musculoskeletal injury were $214 billion in 2012-2014, a rise of 117% from the $98 billion in 1996-1998, in 2014 dollars. Incremental aggregate direct costs increased from $29 billion in 1996-1998 to $53 billion in 2012-2014, an increase of 80%. (Reference Table 8.6.5 PDF [1194] CSV [1195])
 [1197]
 [1199]
 Indirect costs associated with lost wages for persons ages 18 to 64 are not calculated for persons with a musculoskeletal injury. However, musculoskeletal injuries are a primary cause of lost work days by persons in the labor force. Since 1992, musculoskeletal disorders (MSD) have accounted for nearly one-third of workplace injuries involving days away from work. In addition, MSD injuries consistently across the years result in more median days away from work than all workplace injuries. In 2016, MSDs had a median of 12 days away from work compared to a median of 8 days for all injuries, which includes the MSDs in this median. (Reference Table 5D.1 PDF [997] CSV [998] and Table 5D.2.2 PDF [1003] CSV [1004])
Musculoskeletal workplace injuries are a major concern, accounting for a large proportion of all nonfatal injuries that result in days away from work. Even though long-term trends show significant reductions in the total number of worker injuries each year, the proportion that are musculoskeletal related (MSD, which include fractures, bruises/ contusions, and amputations) continues to account for more than one-half of all worker nonfatal injury cases involving days away from work. In addition to the cost of medical care for these injuries, the cost of lost wages and the potential for long-term impairment negatively impacting worker productivity are enormous.
Even with improved and improving understanding and documentation of injuries, there are numerous unmet needs that represent challenges for the future. These range from logistical challenges brought about by the complexity of our healthcare system to the actual improvement of the provision of care for members of our society. While a comprehensive discourse cannot be provided here, we propose some timely thoughts.
While ICD-10 coding of diagnoses will provide greater resolution of the types of injuries sustained, it represents a challenge to the longitudinal tracking of injuries as we fully transition from one to the other. Discrepancies between providers, coders, healthcare and payment systems need to be recognized, minimized, and resolved.
Also, despite the availability of some very robust data systems, we still lack the ability to track many common injuries in our societies; those include injuries during pregnancy, due to domestic violence, due to animals, that are self-inflicted, and of great recent interest, due to gunshot / ballistic violence. Greater granularity regarding common injuries such as fall in the elderly (e.g., home, facilities, circumstances of fall) and motor vehicle crashes (e.g., under the influence, phones/devices) may help formulate interventions and policies to prevent injuries.
On the outcome side, the US still lacks comprehensive and mandatory treatment and outcomes registries that will allow us to understand the spectrum of treatment rendered and the outcomes obtained. We also have an opportunity to understand the relationship between treatment and outcomes.
The link between opioid use and injuries will also be important to understand and study. The current opioid "crisis" and the utilization of medications to treat injury-related pain drives the need for both ways to prevent injury and offer alternatives for treatment. For example, not only is there greater availability and use of cannabis-based products and medications, there has been increasing interest in substituting them for opioids. These changes should be carefully monitored so the epidemiologic and care implications are understood.
As we move forward, there will be a continued need to reflect on the data we have and how we can enhance that data to improve the prevention, evaluation and treatment of injuries.
Analysis includes all 5-digit codes within each three-digit category.
Fractures
Trunk and Multiple Site Fractures
Fracture of rib(s) sternum, larynx, and trachea: 807
Fracture of pelvis: 808
Ill‐defined fractures of bones of trunk: 809
Multiple fractures involving both upper limbs and upper limb with rib(s) and sternum: 819
Multiple fractures involving both lower limbs lower with upper limb and lower limb(s) with rib(s) and sternum: 828
Fracture of unspecified bones: 829
Upper Limb Fractures
Fracture of clavicle: 810
Fracture of scapula: 811
Fracture of humerus: 812
Fracture of radius and ulna: 813
Fracture of carpal bone(s): 814
Fracture of metacarpal bone(s): 815
Fracture of one or more phalanges of hand: 816
Multiple fractures of hand bones: 817
Ill-defined fractures of upper limb: 818
Multiple fractures involving both upper limbs and upper limb with rib(s) and sternum: 819
Lower Limb Fractures
Fracture of neck of femur: 820
Fracture of other and unspecified parts of femur: 821
Fracture of patella: 822
Fracture of tibia and fibula: 823
Fracture of ankle: 824
Fracture of one or more tarsal and metatarsal bones: 825
Fracture of one or more phalanges of foot: 826
Other multiple and ill‐defined fractures of lower limb: 827
Derangement
Internal derangement of knee: 717
Other derangement of joint: 718
Dislocation
Upper Limb Dislocation
Dislocation of shoulder: 831
Dislocation of elbow: 832
Dislocation of wrist: 833
Dislocation of finger: 834
Lower Limb Dislocation
Dislocation of hip: 835
Dislocation of knee: 836
Dislocation of ankle: 837
Dislocation of foot: 838
Other Site Dislocation
Other multiple and ill‐defined dislocations: 839
Sprains/Strains
Upper Limb Sprains/Strains
Sprains and strains of shoulder and upper arm: 840
Sprains and strains of elbow and forearm: 841
Sprains and strains of wrist and hand: 842
Lower Limb Sprains/Strains
Sprains and strains of hip and thigh: 843
Sprains and strains of knee and leg: 844
Sprains and strains of ankle and foot: 845
Back and Spine Sprains/Strains (also included in Spine Chapter)
Sprains and strains of sacroiliac region: 846
Sprains and strains of other and unspecified parts of back: 847
Other Site Sprains/Strains
Other and ill‐defined sprains and strains: 848
Contusions
Contusion of trunk: 922
Contusion of upper limb: 923
Contusion of lower limb and of other and unspecified sites: 924
Crushing Injuries
Crushing injury of trunk: 926
Crushing injury of upper limb: 927
Crushing injury of lower limb: 928
Crushing injury of multiple and unspecified sites: 929
Open Wound
Open Wound of Trunk and Chest
Open wound of neck: 874
Open wound of chest (wall): 875
Open wound of back: 876
Open wound of buttock: 877
Open wound of other and unspecified sites except limbs: 879
Open Wound of Upper Limb
Open wound of shoulder and upper arm: 880
Open wound of elbow forearm and wrist: 881
Open wound of hand except finger(s) alone: 882
Open wound of finger(s): 883
Multiple and unspecified open wound of upper limb: 884
Open Wound of Lower Limb
Open wound of hip and thigh: 890
Open wound of knee leg (except thigh) and ankle: 891
Open wound of foot except toe(s) alone: 892
Open wound of toe(s): 893
Multiple and unspecified open wound of lower limb: 894
Traumatic Amputation
Traumatic amputation of Upper Limb
Traumatic amputation of thumb (complete) (partial): 885
Traumatic amputation of other finger(s) (complete) (partial): 886
Traumatic amputation of arm and hand (complete) (partial): 887
Traumatic amputation of Lower Limb
Traumatic amputation of toe(s) (complete) (partial): 895
Traumatic amputation of foot (complete) (partial): 896
Traumatic amputation of leg(s) (complete) (partial): 897
Late Effect of Injury
Injury to other nerve(s) of trunk excluding shoulder and pelvic girdles: 954
Injury to peripheral nerve(s) of shoulder girdle and upper limb: 955
Injury to peripheral nerve(s) of pelvic girdle and lower limb: 956
Injury to other and unspecified nerves: 957
Injury other and unspecified: 959
Ecodes-Penetrating Injuries
Firearms: 965.0-965.4, 922.0-922.9, 955.0-955.4, 970.0, 985.0-985.4
Explosives: 965.5-965.9, 923.0-923.9, 955.5-955.9, 971.0, 985.5-985.7
Stabbing device: 956.0, 966.0, 974.0, 986.0
Musculoskeletal neoplasms cause significant morbidity and mortality, although less commonly than lung, breast, kidney, and certain other cancers. This significant burden is especially true in young patients who are more likely to develop cancers such as osteosarcoma, Ewing sarcoma, and rhabdomyosarcoma. Musculoskeletal neoplasms and sarcomas usually require concerted treatment efforts by coordinated medical teams. These teams are typically led by a subspecialty of physicians known as orthopedic oncologists. Because of the relative infrequency of musculoskeletal sarcomas, few institutions gather sufficient numbers to provide thorough epidemiologic and descriptive data. Therefore, tumor registry data are necessary to gather enough cases to generate meaningful data.
The following discussion is based on concerted analysis that incorporates the two largest tumor registries in the United States, the National Cancer Data Base (NCDB) of the American College of Surgeons [1200] (ACS) and the National Institutes of Health (NIH), National Cancer lnstitute’s Surveillance, Epidemiology and End Results [1201] (SEER) program. Actual incidence, death rates, and survival statistics are difficult to determine. The two databases derive slightly different numbers, and the numbers change annually with newly reported data. Thus, a direct comparison of NCDB and SEER is not possible. Sources for data cited in tables and graphs are shown. Sources available at the time of analysis may no longer be available.
The NCDB is a joint project of the Commission on Cancer of the American College of Surgeons and the American Cancer Society. The data used in this study and this report are derived from analysis of a cohort of patients registered and treated 2004-2015 and the resulting de-identified NCDB file comprising more than 1,500 Commission-accredited cancer programs. Data are collected from all institutions wishing to be accredited by the American College of Surgeons Commission on Cancer. Each accredited institution is required to report all patients with cancer treated at their institution, including annual follow-up data. Site visits and interaction between American College of Surgeons cancer database personnel and the local reporting institutions verifies a minimum of 90% case capture and reporting for each institution. Multiple internal checks verify the data accuracy. It is estimated that the approximately 1,500 reporting institutions each year treat approximately 72% of all patients with malignancies in the United States.1 The primary author was granted research access to the database under the Participant User File (PUF) research program. In his prior PUF-based research (including prior data reported in the predecessor of this publication), the accessible data was only for cases in patients 18 years old and older, thus creating age-associated limitations of the NCDB dataset. The most recent database reported herein, however, includes patients of all ages treated 2004-2015, inclusive. The American College of Surgeons and the Commission on Cancer have not verified and are not responsible for the analytic or statistical methodology employed or the conclusions drawn from these data by the investigator and authors of this chapter. Data from the NCDB was used in the analysis for certain demographic, treatment and survivorship analyses for musculoskeletal cancers.
The SEER database is the main program used by the National Cancer Institute (NCI) to support cancer surveillance activities. It is the most comprehensive and authoritative source of information on cancer incidence, prevalence, mortality, survival, and lifetime risk in the United States. The SEER Program currently collects and publishes cancer incidence and survival data from population-based cancer registries covering approximately 34% of the U.S. population.2 Data is available from 1974 to 2016 and includes more than 10 million cases.
We also derived some tumor incidence estimates by analysis and extrapolation from one of the author's case series data compiled from his practice experience. Dr. William Ward was the only orthopedic oncologist at Wake Forest University Baptist Medical Center in Winston Salem, NC, during the period between 1991 and 2005. Virtually all cases of osteosarcoma in North Carolina were treated by one of the very few orthopedic oncologists in North Carolina during that time. Dr. Ward's personal surgical database contains detailed incidence data regarding many musculoskeletal neoplasms. Comparing the incidence of osteosarcomas in the United States with that treated by Dr. Ward, we were able to extrapolate, using similar proportional estimates, to the national incidence of tumors for which there were no national registry data. Typically, aggressive benign bone and benign soft tissue tumors are most likely to be treated by orthopedic oncologists rather than by non-oncological-trained surgeons. However, because there is no way to estimate the numbers of patients treated by orthopedic surgeons and other surgeons not specifically trained in orthopaedic oncology, the derived national data estimates will be conservative because of the methodology used. All estimates in this chapter derived from the above methodology will be clearly identified as an extrapolation via this incidence estimation.
All tissues are made up of individual cells. Tumors, also known as neoplasms, are formed by uncontrolled and progressive excessive abnormal growth and multiplication of cells. In malignant tumors, the tumor cells continue to multiply and divide beyond the initial site. If unchecked, malignant tumors can cause death as they spread, or metastasize, to vital areas of the body. Benign tumors, on the other hand, remain localized and do not spread or metastasize to other body locations. They rarely threaten the life of the patient although they can cause significant injury or morbidity at the site of the tumor.
Muscle, bone, nerves, blood vessels, fat, and fibrous tissues are all connective tissues and are the tissue types that comprise musculoskeletal tissues and structures; therefore, tumors of these tissues form the basis of this report. Malignant tumors of the bone and connective tissue are also known as sarcomas, whereas cancers in most other organs are generally referred to as carcinomas.
Primary tumors are tumors of any organ or tissue that are composed of cells derived from that organ or tissue itself. Secondary, or metastatic tumors, are tumors in any organ or tissue that originated in a distant organ or tissue. Therefore, primary bone and soft tissue tumors originate in bone or connective tissue itself. Secondary or metastatic bone or connective tissue tumors began elsewhere and spread (metastasize) to the bone or connective tissues, retaining the cellular composition of the original tumor site. Primary tumors can be benign, which means they do not spread through the body to other sites, or malignant (cancerous), meaning they can and do spread to other places in the body.
Most musculoskeletal cancers, or sarcomas, are named by the Latin root word for the type of malignant tissue they produce. Thus, osteosarcomas are composed of malignant bone (osteo) producing cells; chondrosarcomas are composed of malignant cartilage (chondro) producing cells; liposarcomas are composed of malignant fat producing (lipo) cells; rhabdomyosarcomas create malignant muscle tissue (rhabdomyo); fibrosarcomas produce malignant connective tissue (fibro), and so on.
Secondary bone tumors that spread to the bone from malignancies in other organs such as lung, breast, and prostate cancers (metastatic cancers) are far more numerous than primary bone cancers. Although metastatic cancers to bone cause extensive morbidity from pain and fractures caused by bone weakening, such cancers are not the primary focus of this chapter. However, a section on secondary bone and joint cancers [1202] details some of the effects of this condition and its associated morbidity.
Hematologic (bone marrow) tumors are often not included in treatises on “bone cancer.” The three most common are leukemia (rarely weakens bone or causes fractures), lymphoma (can destroy bone structure and weaken bone causing fractures), and myeloma (often causes bone destruction). The latter two often cause bone weakness, pain, and fractures, so these two bone marrow tumors are included in most studies on bone cancers. Leukemias are rarely included since they only rarely cause significant bone weakness or fractures, therefore we have left them out of this chapter as well.
The incidence of cancer is defined as the number of new cancers of bone and connective tissue in a specific population during a year. The incidence rate is expressed as the number of cancers per 100,000 population at risk. In general, it does not include recurrences. Because of the low number of new cases, the incidence rate in this report is expressed as the number per one million population at risk.
Prevalence is defined as the number of people alive on a certain date in a population who have the disease and have previously had a diagnosis of the disease. It includes new (incidence) cases and pre- existing cases and is a function of past incidence and survival.
A cancer mortality rate is the number of deaths, with cancer as the underlying cause of death, occurring in a specific population during a year. It is calculated the same as the incidence rate.
Cancer survival statistics are typically expressed as the proportion of patients alive at some point subsequent to the diagnosis of their cancer. Observed all-cause survival is an estimate of the probability of surviving all causes of death. Net cancer-specific survival (policy-based statistic) is the probability of surviving cancer in the absence of other causes of death. It is a measure that is not influenced by changes in mortality from other causes and, therefore, provides a useful measure for tracking survival across time, and comparisons between racial/ethnic groups or between registries. Crude probability of death (patient prognosis measure) is the probability of dying of cancer in the presence of other causes of death. It is a better measure to assess the impact of cancer diagnosis at an individual level since mortality from other causes play a key role. It measures mortality patterns experienced in a cohort of cancer patients on which many possible causes of death are acting simultaneously. The crude measure is reported as a cumulative probability of death from cancer rather than survival.3
Net cancer-specific survival measures are relative survival and cause-specific survival. Relative survival is the ratio of the proportion of observed survivors (all causes of death) in a cohort of cancer patients to the proportion of expected survivors in a comparable cohort of cancer-free individuals. The formulation is based on the assumption of independent competing causes of death. Cause-specific survival is a net survival measure representing survival of a specified cause of death in the absence of other causes of death. Estimates are calculated by specifying the cause of death. Individuals who die of causes other than those specified are considered to be censored.4
Bone and connective tissue neoplasms, which include bone and joint sarcomas, myelomas, and soft tissue sarcomas, are uncommon when compared with other cancers and with other musculoskeletal conditions, accounting for about 2.4% of annual cancer cases between 2010 and 2014 (approximately 50,000 cases). This share is higher than the 2.2% reported for 2006 to 2010, and the 1.9% for 2002 to 2006. Estimated cases for 2017 were slightly lower, at 46,000 cases, but represented 2.7% of all new cancer cases. The annual average number of new bone and joints cancer cases, excluding myeloma and soft tissue, reported between 2010 and 2014 was 4,126 cases, with an average of 1,440 deaths from bone and joints cancer each year. Estimates for 2017 are 3,260 new cases and 1,550 deaths. Data cited is from the Surveillance Epidemiology and End Results (SEER) program of the National Cancer Institute and is used to illustrate the burden of bone and connective tissue neoplasms. (Reference Table 6A.A.1.0 PDF [1207] CSV [1208], Table 6A.A.1.3.1 PDF [1209] CSV [1210]; and Table 6A.A.1.4.1 PDF [1211] CSV [1212])
 [1214]
 The three most common primary cancers of bones and joints are osteosarcoma, chondrosarcoma, and Ewing sarcoma. Together they account for more than 80% of true primary bone and joint cancers. The ages at which these cancers most often occur vary. Osteosarcoma, a malignant bone tissue tumor commonly found near the growing end of the long bones, is the most common, and occurs most frequently in teens and young adults. Ewing sarcoma, a tumor often located in the shaft of long bones and in the pelvic bones, occurs most frequently in children and youth. Chondrosarcoma, a sarcoma of malignant cartilage cells, often occurs as the result of malignant degeneration of pre-existing cartilage cells within bone, including enchondromas (a benign tumor), and is primarily found among middle age and older adults. However, the majority of enchondromas never undergo malignant change; therefore, the routine resection of benign enchondromas is unwarranted. (Reference Table 6A.B.1.1 PDF [1215] CSV [1216], Table 6A.B.1.2 PDF [1217] CSV [1218], Table 6A.B.1.3 PDF [1219] CSV [1220], and Table 6A.B.1.4 PDF [1221] CSV [1222])
 [1224]
 Of the three, chondrosarcoma has the best prognosis, while Ewing sarcoma is generally considered to have the worst prognosis, followed closely by osteosarcoma. However, this perception is largely due to the greater tendency for osteosarcomas to present as high-grade tumors and for chondrosarcomas to present as low-grade tumors. When analyzed by stage, a recent survivorship analysis of a prior cohort of patients in the NCDB PUF database revealed similar survivorship rates for low-grade chondrosarcoma compared to low-grade osteosarcoma, and similar survivorship rates for Ewing sarcoma and high-grade osteosarcoma. By definition, all cases of Ewing sarcoma are high-grade, the most aggressive category of cancer, with full potential to metastasize and bring about death. High-grade chondrosarcoma has a worse prognosis when compared to high grade osteosarcoma and Ewing sarcoma.1
In the current NCDB analysis, only 4% of osteosarcomas are of Grade 1, the lowest grade, whereas 48% of chondrosarcoma are Grade 1. Therefore, chondrosarcomas have a higher proportion of low-grade cases than the other two bone and joint cancers, which accounts for its overall higher survival rate and the perception that it is not be as lethal. Conversely, 2% of all chondrosarcomas with histologic grading were reported as Grade 4, whereas 40% of osteosarcomas were reported as being in the most aggressive Grade 4 category. (Reference Table 6A.B.1.8 PDF [1225] CSV [1226])
 [1228]
 A fourth type of cancer is myeloma, a malignant primary tumor of the bone marrow formed from a type of bone marrow cells called plasma cells (the cells that manufacture antibodies). Although not classified as a bones and joint cancer, it typically causes extensive changes or damage to the bone structure itself, causing fractures, pain, and hypercalcemia (a condition in which the calcium level in blood is above normal, which can weaken bones, create kidney stones, and interfere with how the heart and brain work). Because of the associated bone destruction, myeloma is generally included in analysis of bone cancers. Myeloma usually involves multiple bones simultaneously. The isolated single-bone version of myeloma is called plasmacytoma, but virtually all cases of isolated plasmacytoma evolve into full-fledged multiple myeloma within 5 to 10 years after diagnosis of the plasmacytoma. Like leukemia and lymphoma, myeloma is more properly considered a primary cancer of the hematopoietic bone marrow (stem cells that give rise to other blood cells.). However, leukemia and lymphomas generally are not considered primary bone cancers, presumably because of the lower likelihood of structural bone destruction and associated complications. NonHodgkin's lymphomas, however, as well as myelomas, warrant some consideration in a report on the burden of musculoskeletal diseases due to the frequency of bone destruction and pathological fractures requiring operative intervention.
The reader is referred to the data tables 6A.B.1.1 thru 6A.B.1.9 for a more robust appreciation of these tumors. These tables show the latest NCDB demographic and survivorship analyses of bone and joint cancers, providing additional understanding of the demographics, age distribution, anatomic distribution, nature, treatment and prognosis of these sarcomas and their treatments and results.
Adamantinoma: A rare bone cancer, making up less than 1% of all bone cancers. It almost always occurs in the bones of the lower leg and involves both epithelial and osteofibrous tissue. It generally has a favorable prognosis.
Angiosarcoma: A cancer that forms from cells that are in the lining of blood vessels and lymph vessels. It often affects the skin and may appear as a bruise-like lesion that grows over time. The disease most commonly occurs in the skin, breast, liver, spleen, and deep tissue. It typically has an aggressive course and a poor prognosis.
Chondroblastoma – malignant: Chondroblastoma is a rare, usually benign, tumor of cartilaginous origin. It typically arises in the epiphysis of a long bone. Malignant chondroblastomas, which may occur many years after the original lesion, are extremely rare. Our analysis of the NCDB database reveals a usually good prognosis, with 95% survivorship at 5 years. Establishing the diagnosis in such rare and unusual cases is challenging at best. (Reference Table 6A.B.1.1 PDF CSV)
Chondrosarcoma: A bone cancer that develops from cartilage cells. Cartilage is the specialized, gristly connective tissue that is on the ends of bones with articulating joints that cushion the bone ends and allow motion over its smooth lubricated surfaces. Primitive cartilage is present in adults and the tissue from which most bones develop. Chondrosarcoma develops primarily in the pelvis, scapulae, chest bones, long bones, and spine.
Chordoma: A rare type of slow growing cancerous tumor that can occur anywhere along the spine, from the base of the skull to the tailbone. It derives from the notochord, an embryonic tissue generally considered to be the precursor to intervertebral disc tissue.
Ewing sarcoma: A cancerous tumor that grows in the bones or in the tissue around bones (soft tissue)—often the legs, pelvis, ribs, arms, or spine. Ewing sarcoma can spread to the lungs, bones, and bone marrow.
Fibrosarcoma: A malignant tumor consisting of fibroblasts (connective tissue cells that produce the collagen found in scar tissue) that may occur as a mass in the soft tissues or may be found in bone.
Giant cell tumor of bone - malignant: A relatively uncommon tumor of bone characterized by the presence of multinucleated giant cells (osteoclast-like cells). Malignancy in giant-cell tumor is uncommon and occurs in about 2% of all cases. However, if malignant degeneration does occur, it is likely to metastasize to the lungs. It often arises in sites of previously treated benign giant cell tumors that were treated with radiation therapy.
Hemangioendothelioma: A rare type of vascular tumor that affects the epithelial cells which line the inside of blood vessels. Epithelioid hemangioendothelioma tumors most commonly affect the soft tissues, liver, lungs, and bones.
Leiomyosarcoma: A type of soft tissue sarcoma that develops in muscle, fat, blood vessels, or any of the other tissues that support, surround, and protect the organs of the body. Leiomyosarcoma is one of the more common types of soft tissue sarcoma to develop in adults.
Malignant fibrous histiocytoma: Most often more recently classified as pleomorphic undifferentiated sarcoma, malignant fibrous histiocytoma (MFH) also can be listed as plasmosphic sarcoma not otherwise specified (PS-NOS). It also was often formerly known as a type of fibrosarcoma. It is historically considered the most common type of soft tissue sarcoma. It has an aggressive biological behavior and a poor prognosis, and primarily affects the extremities.
Neoplasm - malignant: The term "malignant neoplasm" means that a tumor is cancerous. When diagnosed it may mean further testing is needed to identify the specific type of cancer or sarcoma.
Osteosarcoma: The most common type of cancer that starts in the bones. The cancer cells in these tumors look like early forms of bone cells that normally help make new bone tissue, but the bone tissue in an osteosarcoma is not as strong as that of normal bones. Therefore, affected bones are subject to pathologic fracture (fractures caused by bone weakened due to underlying disease). Without proper treatment, osteosarcome is fatal.
Primitive peripheral neuroectodermal tumor: Primitive neuroectodermal tumors (PNETs) are a group of highly malignant tumors composed of small round cells of neuroectodermal origin that affect soft tissue and bone. PNETs exhibit great diversity in their clinical manifestations and pathologic similarities with other small round cell tumors. Peripheral primitive neuroectodermal tumors (pPNETs) are tumors derived from tissues outside the central and autonomic nervous system.
Sarcoma (NOS): A usually aggressive malignant mesenchymal cell tumor most commonly arising from muscle, fat, fibrous tissue, bone, cartilage, and/or blood vessels that is not otherwise specified (NOS).
SEER estimates an average of 3,260 people were newly diagnosed with cancer of the bones and joints, excluding myeloma, lymphoma, and leukemias, in 2017. During the same year, an estimated 1,550 people died from cancer of the bone and joints. The number of new cases of bone and joint cancers was estimated to be 1.0 per 100,000 people per year during the years 2012-2016.1 However, death rates from bone and joint cancers have declined slightly (0.2% per year) since 1982-2016, following a 9.9% decline from 1975-1982.2 Approximately 40% of bone cancers are diagnosed at a localized stage, for which the 5-year relative survival is 85%.3 The overall 5-year relative survival rate in the 2004-2015 NCDB Database set for Bone and Joint cancers was 65% but is higher for all combined chondrosarcomas (74%) than all combined osteosarcomas (60%). (Reference Table 6A.A.1.0 PDF [1207] CSV [1208] and Table 6A.A.1.5.1 PDF [1229] CSV [1230]. See Table 6A.B.1.1 PDF [1215] CSV [1216] and Table 6A.B.1.2 PDF [1217] CSV [1218] for the NCDB database data regarding the two- and five-year survivorship of all bone and joint sarcomas.)
 [1232]
 Myeloma occurs up to ten times more frequently than bone and joint cancers and is not defined as a rare cancer as the incidence is just over the 6/100,000 rare cancer definition. In 2019, myeloma was estimated to be diagnosed in 32,110 persons per year, an incidence rate of 6.9 per 100,000 persons per year. An estimated 12,960 persons will die of myeloma in 20194, with a death rate of 3.3 per 100,000 persons. (Reference Table 6A.A.1.2.1 PDF [1233] CSV [1234] and Table 6A.A.1.2.2 PDF [1235] CSV [1236])
Most bone cancers and soft tissue sarcomas are found more frequently in males than females and more frequently among whites than those of any other race, although there are exceptions or outliers to these generalizations for certain subtypes of bone and soft tissue tumors. However, reported rates have varied slightly for both genders and by race for the past decade. The average annual incidence of bone and joint cancers between 2012 and 2016 was 1 in 100,000, a slightly higher rate than reported in the first decade of the 21st century. The rate among white males was 1.2 in 100,000, while, among white females it was 0.9 in 100,000. The lowest reported rate, 0.6/100,000 was found for females of the Asian or Pacific Islander race. The incidence of cancer of the bones and joints in the United States is comparable to several site-specific oral cancers (i.e., lip, salivary gland, floor of the mouth), cancers of the bile duct, cancers of the eye, and Kaposi's sarcoma, which affects the skin and mucous membranes and is often associated with immunodeficient individuals with AIDS. (Reference Table 6A.A.1.1.1 PDF [1241] CSV [1242] and Table 6A.A.1.3.1 PDF [1209] CSV [1210])
 [1244]
 As with bone and joint cancers, males have a higher incidence of myeloma than do females, with an average of 8.1 cases in 100,000 white males to 4.9 cases in 100,000 white females for the years 2012-2016. Blacks have a much higher incidence rate of myeloma than whites, with 16.3 cases in 100,000 black males to 11.9 cases in 100,000 black females for the years 2012-2016 while American Indians/Alaska Natives and Asian/pacific islanders have lower incidence rates. The incidence of myeloma in the United States is comparable to the incidence of esophageal, liver, cervical, ovarian, brain, and lymphocytic leukemia cancers. Death rates reflect incidence. (Reference Table 6A.A.1.2.1 PDF [1233] CSV [1234] and Table 6A.A.1.2.2 PDF [1235] CSV [1236])
 [1246]
 The gender make-up of bone and joint cancers from the most recent NCDB (2004-2015) cohort also shows a male predominance for most of the bone and joint cancers and cancer subtypes, with parosteal osteosarcoma showing the major break from this generalization with 34% male and 66% female patients with this cancer. (Reference Table 6A.B.1.6 PDF [1247] CSV [1248] and Table 6A.B.1.7 PDF [1249] CSV [1250])
The median age for cancers of the bones and joints has risen slightly, to age 43 years, in recent years. However, it remains the leading cause of cancer in young persons under the age of 20 years. More than one in four (26%) diagnoses of bone and joints cancer is in children and youth under the age of 20 years, with 42% of cases diagnosed in persons younger than 35 years. Death from bone and joints cancer also affects children and youth at a high rate, with 12% of deaths occurring in those under 20 years of age and one fourth (27%) in those younger than 35 years. Males are typically diagnosed with bone cancers, and die from bone cancer, at an age several years younger than females. (Reference Table 6A.A.1.3.1 PDF [1209] CSV [1210]; Table 6A.A.1.4.1 PDF [1211] CSV [1212]; Table 6A.A.1.7 PDF [1251] CSV [1252]; and Table 6A.A.1.8 PDF [1253] CSV [1254]).
 [1256]
 Younger patients have a higher likelihood of surviving bone cancers. For example, the 5-year survivorship for classic osteosarcoma is 67% in 10 to 20-year-old patients, compared to 34% in patients in their 60s, 19% for patients in their 70s, and only 7% in patients in their 80s and older. Similar declining survivorship is noted with increasing age for Ewing Sarcoma and chondrosarcoma (unpublished NCDB current data analysis).
Myeloma, on the other hand, is primarily a cancer found among elderly persons, with a median age of 69 at the time of diagnosis and 75 at time of death from myeloma. Sixty-two percent (62%) of new myeloma cases are diagnosed in persons age 65 years and older, with more than three in four (78%) of deaths due to myeloma occurring in those 65 and older. Again, males are typically diagnosed with myeloma at ages a few years younger than females. (Reference Table 6A.A.1.3.1 PDF [1209] CSV [1210]; Table 6A.A.1.4.1 PDF [1211] CSV [1212]; Table 6A.A.1.7 PDF [1251] CSV [1252]; and Table 6A.A.1.8 PDF [1253] CSV [1254])
The incidence of bone and joints cancers is higher among non-Hispanic whites than found in other race/ethnicity groups, while myeloma is higher in non-Hispanic blacks. Death rates follow the same race/ethnic lines. (Reference Table 6A.A.1.1.1 PDF [1241] CSV [1242]; Table 6A.A.1.1.2 PDF [1257] CSV [1258]; Table 6A.A.1.2.1 PDF [1233] CSV [1234]; and Table 6A.A.1.2.2 PDF [1235] CSV [1236])
Causes of health disparities are complex and can include interrelated social, economic, cultural, environmental, and health system factors, and may arise, at least in part, from inequities in work, wealth, education, housing, and overall standard of living, as well as social barriers to high-quality cancer prevention, early detection, and treatment services.1
Annual population-based mortality rates due to cancers of bones and joints are low, averaging four deaths per one million people since the early 1990s.1 While the mortality rate from bone and joint cancer dropped by approximately 50% from that of the late 1970s, no significant improvement in this rate has been observed over the past 20 years.2 Males have a higher mortality rate than females for all race/ethnic groups. (Reference Table 6A.A.1.1.2 PDF [1257] CSV [1258])
Because bone and joint cancers affect younger populations more than other types of cancers, the median age at death, 61 years of age, is younger than any other type of cancer. There is a higher death rate in older individuals, but a higher incidence rate in younger individuals. At 0.1% risk, bone and joints cancer also has one of lowest life-time risks. This compares to 12% risk for breast and prostate cancer, the two highest risk cancers. (Reference Table 6A.A.1.5.1 PDF [1229] CSV [1230] and Table 6A.A.1.6.1 PDF [1259] CSV [1260]; and Table 6A.A.1.6.2 PDF [1261] CSV [1262])
The overall 5-year survival rate in 2009-2015 for bone and joint cancers was 66.2%, placing it roughly in the middle of all cancers for 5-year survival and comparable to several more common cancers such as rectal, cervical, and soft tissue cancers.3 This is a survival rate increase of 27% since 1975, when the 5-year survival rate was 52%. (Reference Table 6A.A.1.5.2 PDF [1263] CSV [1264])
 [1266]
 By extrapolation from median age at diagnosis and median age at death, one could estimate a median survival rate. However, this extrapolated survival time is misleading and inaccurate as younger patients, who typically are healthier and can tolerate more aggressive treatments, have improved survival compared to older individuals, who cannot tolerate such aggressive treatments and have poorer survival, greatly affecting this derived or extrapolated estimate of survivorship.
The overall 5-year survival rate for the primary types of bone and joint cancers varies by type and subtype of cancer, how it responds to treatment, and the degree to which the cancer has spread. Osteosarcoma diagnosed and treated before it has spread has a reported general survival rate between 60% and 80%; if it has already spread at the time of diagnosis, the 5-year survival rate is reported to be between 15% and 30%.4
If Ewing sarcoma is found before it metastasizes, the 5-year survival rate for children and youth is about 70%, with a survival rate of 78% reported for children under age 5, dropping to around 60% survival for adolescents age 15 to 19. However, if already metastasized when found, the 5-year survival rate drops to 15% to 30%.5
The annual population-based mortality rate of myeloma has been an average of 33 persons per one million population between 2001 and 2016. The mortality rate from myeloma has remained relatively constant since the mid-1970s. The 5-year survival rate for myeloma, 50%, is one of the lowest for all cancers; however, due to being primarily a cancer of older persons, this age-relatedness may, in part, reflect survival regardless of the presence or absence of myeloma. The median calculated rate of survival after diagnosis of myeloma is only 6 years. (Reference Table 6A.A.1.2.2 PDF [1235] CSV [1236] and Table 6A.A.1.5.1 PDF [1229] CSV [1230])
Within the NCDB, no change in the overall survival rates for patients diagnosed and treated in the years 1985 to 1988 compared to patients between 1994 and 1998 was found. There have been no substantial changes in therapies utilized for osteosarcoma since 1998, and the overall 1998-2010 NCDB data reveals no significant improvement, with an approximate 50% 5-year overall survival. However, the survival rate varies greatly with the histologic subtype of sarcoma. For instance, the 5-year relative survival rate is 56% for classic high-grade osteosarcoma, 89% for parosteal osteosarcoma, and 37% for osteosarcoma associated with Paget's disease of the bone. The most recent NCDB database investigation the three primary authors have performed, which covered patients diagnosed between 2004-2015, inclusive, is summarized in the data tables attached to this chapter. These data provide the analysis of the numbers of cases reported during these years, along with the Kaplan-Meier survivorship of the major diagnostic groupings, as well as of the subgroups and age-based for the various primary bone and joint tumors reported and treated 2004-2015. (Reference Table 6A.B.1.1 PDF [1215] CSV [1216]; Table 6A.B.1.2 PDF [1217] CSV [1218]; Table 6A.B.1.3 PDF [1219] CSV [1220]; and Table 6A.B.1.4 PDF [1221] CSV [1222])
 [1268]
 The above and all other reported survivorships in this chapter were generated using SAS/STAT software, Version14.2 for Windows 3. Copyright 2002-2012, SAS Institute Inc. SAS and all other SAS Institute Inc. product or service names are registered trademarks or trademarks of SAS Institute Inc., Cary, NC, USA. As stated previously, the NCDB is a joint project of the Commission on Cancer of the American College of Surgeons and the American Cancer Society. The data used in this study and this report are derived from a de-identified NCDB file comprising more than 1,500 Commission-accredited cancer programs. The American College of Surgeons and the Commission on Cancer have not verified and are not responsible for the analytic or statistical methodology employed or the conclusions drawn from these data by the investigator and authors of this chapter.
The economic burden of bone cancers can be great. The more advanced the disease, the worse the prognosis and, accordingly, the more expensive the treatments. It is likely that early detection, and, certainly, prevention if possible, could drastically reduce costs. Several expensive treatments are required to address these tumors. In the 2007 report by Damron, Ward, and Stewart,1 it was noted that the most frequent initial treatments varied widely based on the type of sarcoma and, although not reported, also on the stage of the disease as well.
Collectively, they reported surgery alone was the most common initial treatment for chondrosarcomas (69%), whereas Ewing sarcoma treatments were divided between surgery and chemotherapy (24% of cases), radiation and chemotherapy (23%), and chemotherapy alone (18%). With osteosarcoma, when initial treatment was known, the largest group received surgery and chemotherapy (46%). Surgery was reported as part of the initial treatment in 71% of osteosarcoma patients, 83% of chondrosarcoma patients, and 47% of Ewing sarcoma patients. The most frequent operations performed were limb-sparing radical resections and excisions. When the type of surgery was defined and known, limb-preservation surgery was performed in 69% of osteosarcomas, 79% of chondrosarcomas, and 81% of Ewing sarcomas.1
The frequencies of the various treatment modalities employed in the latest reported (2004-2015) NCDB cohort are shown in the data tables attached to this section for bone and joint cancers and soft tissue cancers. As shown in the table, for Osteosarcoma NOS 76% had surgery, 74% had chemotherapy, and only 8% had radiation. For Ewing Sarcoma, the numbers were 51%, 85%, and 45%, respectively. For Chondrosarcoma NOS, the numbers were 85%, 3%, and 10%. These distributions reflect the widely different treatments of these three major categories of bone and joint cancers. (Reference Table 6A.B.1.9 PDF [1273] CSV [1274] and Table 6A.B.2.6 PDF [1275] CSV [1276])
 [1278]
 In Dr. Ward's personal series of more than 100 osteosarcomas, amputation has been required in only 17% of patients, but almost all remaining patients have had surgical resection, limb reconstruction, and chemotherapy.1 The authors believe Dr Ward’s series is a reasonable approximation of treatments employed by most orthopedic oncologists in the US today.
Multiple therapies may be needed throughout the course of the patient's disease, especially in more advanced cases. In later stages of the disease for those not cured with surgery alone, significant costs will accumulate as patients develop pulmonary disease and ultimately die. Hormone therapy, immunotherapy, bone marrow transplant, and endocrine treatments each accounted for 1% or less of initial treatments. However, in severely affected individuals in whom standard treatments fail, these alternative treatments may be tried more frequently. Currently, the authors are not aware of any data source that reports the rate of utilization of such late treatments.
All these treatments are costly to administer. Per-patient cost will vary widely depending on the treatments utilized, and the number and intensity of treatments. Overall, treatment for bone and joint cancers can easily exceed $100,000 for a single patient. This is particularly true if a patient receives surgery, chemotherapy, and radiation therapy. If one includes bone-replacing endoprostheses or artificial limbs used in cases requiring amputation, the cost will be much higher. In addition to the direct medical cost, there are extensive indirect and social costs from lost work time and disability. For some patients, healthcare costs associated with their bone and joint cancers will be ongoing.
Analysis of the most recent NCDB insurance data, which covers all ages and covers the years 2004-2015 inclusive, available for 18,881 reported bone and joint cancer cases show Medicare and Medicaid covering 16.76% and 14.71%, respectively, with private insurance covering 57.33%, other government payors covering 1.9% with 5.05% uninsured and 4.24% with unknown insurance status. (Reference Table 6A.B.1.11 PDF [1279] CSV [1280])
 [1282]
Almost all cancers have preferential sites to which they spread or metastasize, resulting in secondary cancers. Secondary bone cancer is much more common than primary bone cancer and results in great morbidity and pain. The three most common sites to which cancers metastasize are lung, liver, and bone. The skeleton is the most common organ affected by metastatic cancer, and the site of disease that produces the greatest morbidity. The most commonly encountered cancers that readily and frequently spread to bone are cancers of the breast, lung, kidney, prostate, gastrointestinal tract, and thyroid gland. The incidence of bone metastases in lung cancer patients is approximately 30% to 40%, with the median survival time (MST) of patients with such metastases 6 to 7 months.1 At postmortem examination, 70% of patients dying of breast and prostate cancer have evidence of metastatic bone disease. Cancers of the thyroid, kidney, and bronchus also commonly give rise to bone metastases, with an incidence at postmortem examination of 30% to 40%.2 Brain and ovarian cancers rarely spread to bone. Many other cancers have intermediate rates of spread to bones.
A tumor formed by metastatic cancer cells is called a metastatic tumor or a metastasis. The cancer cells in their new metastatic site closely resemble the original or primary cancer from which the cancer initially arose. For example, breast cancer that spreads to the bone and forms a metastatic tumor is still considered metastatic breast cancer, not true bone cancer. The cancerous tissues in the bone will still exhibit the microscopic appearance of breast tissue and breast cancer when it is inspected or viewed under a microscope. Many lay people will now refer to it as bone cancer, but to the physician, bone cancer implies a cancer that started or originated in the bone, such as osteosarcoma, Ewing sarcoma, or myeloma, as discussed previously.
Metastatic bone disease complications are termed skeletal related events (SREs). SREs include pain, pathologic fracture, vertebral deformity and collapse, spinal cord compression, and hypercalcemia (overabundance of calcium in the blood) of malignancy. These complications result in impaired mobility and reduced quality of life (QOL) and have a significant negative impact on survival.2 In addition, metastatic disease may remain confined to the skeleton, with the decline in quality of life and eventual death almost entirely due to skeletal complications and their treatment.
The prognosis of metastatic bone disease is dependent on the primary site, with breast and prostate cancers associated with a survival measured in years compared with lung cancer, where the average survival is only a matter of months. Survival rates for secondary bone cancer depend on patient factors such as age, overall health, treatment, and response to treatment. However, due to the advanced stage of cancer that has spread to the bone, survival rates are much lower than for primary cancer without such spread.
The fundamental treatment for disease control for bone metastasis from advanced cancer is systemic chemotherapy and radiation of the bone lesions. Prevention and treatment of bone metastases is highly dependent on an effective treatment being employed against the primary cancer. As a direct treatment for bone metastases themselves, radiation therapy, surgery, and bisphosphonates are the mainstays of treatment. Intravenous bisphosphonate, such as zoledronic acid, have been shown to prevent or reduce pathologic fractures and may reduce these costs.3 With the 1995 FDA approval of the use of bisphosphonate medications to prevent such fractures, the incidence of fractures in treated patients with bone metastasis has significantly decreased. Fracture rates reported in cases of metastatic disease and myeloma have been demonstrated in multiple studies to be diminished by roughly 50%. The bisphosphonate medications work by interrupting a biochemical pathway required for bone breakdown by osteoclasts, the cells that normally remove bone in the process of bone remodeling. This bone breakdown step is overactivated in the presence of bony metastases, causing bone loss, bone destruction, and ultimately fractures from the weakening of the bone. Thus, the introduction of bisphosphonate medication has been a major advance during the past 20 years, with significant impact on the health of those with myeloma and metastatic cancer to the bone. Most pathologic fractures encountered currently are in patients with newly diagnosed metastatic cancer who have not received prophylactic treatments because the cancer had not been diagnosed.
Dr. Ward has had several anecdotal cases in the last year (2018-2019) with metastatic lung and other cancers that have metastasized to bone in whom the cancer elsewhere in the body is responding favorably to newer targeted chemotherapy and immunotherapy regimens, but the bone metastasis for some reason is not responding favorably, requiring more extensive surgical treatment of the unresponsive bone metastatic lesion. Whether or not this will become a more common challenge in the future is anyone’s guess, but with several cases seen by one physician in a short time, it raises the possibility that more extensive bone resection treatments may become more necessary for metastatic bone lesions as these individualized systemic targeted treatments are employed in greater numbers and are capable of controlling the disease in the rest of the body.
The economic burden of SREs in patients with bone metastases is substantial. Several recent studies show that the estimated lifetime SRE-related cost per patient suffering from bone metastatic disease (BMD) resulted in medical costs more than twice the treatment cost for cancer in patients without BMD.1,2 Finding cures and effective treatments for all types of cancer can help reduce the prevalence and costs associated with bone and joint cancer.
Overall, cancers metastatic to bone cause significant pain and morbidity. Approximately 50% of patients with metastatic cancer of lung, breast, prostate, and kidney develop bony metastases prior to death. Untreated, these metastases can lead to pathological fractures and cause great pain and disability. Thus, the elucidation of the biochemical steps involved in bone destruction and the development of drugs to combat such steps, have been an example of tremendous scientific advancement and achievement in the field of cancer research and treatment.
Soft tissue tumors, like bone tumors, are called sarcomas, and are encountered more frequently than bone and joints tumors. Soft tissue tumors originate in connective or non-glandular tissue and can develop in any part of the body that contains fat, muscle, nerve, blood vessels, fibrous tissues, and in any deep tissues, including tissues surrounding joints, bones, or deep subcutaneous tissues. More than half of soft tissue sarcomas develop in the arms or legs. About one in five (20%) are found in the abdominal cavity and present with symptoms similar to other abdominal-based health problems. The rest begin in the head and neck area or in and on the chest or abdomen (about 10% each).1 The differentiating feature of soft tissue tumors (sarcomas) is that they arise from the connective tissues rather than from gland forming organs such as kidneys, lungs, intestines, breasts, prostate, or thyroid glands.
There also are a vast number of non-malignant soft tissue neoplasms and tumors such as lipomas. In addition, typically included are cystic lesions of the deep tissues. Additional information on soft tissue sarcomas can be found in multiple sources such as Enzinger and Weiss’s Soft Tissue Tumors.2
The reader is referred to the data tables 6A.B.2.1 thru 6A.B.2.7 for a more robust appreciation of these tumors. These tables show the latest NCDB demographic and survivorship analyses of soft tissue cancers, providing additional understanding of the demographics, anatomic distribution, nature, treatment and prognosis of these sarcomas and their treatments and results.
There are multiple soft tissue sarcomas with varying degrees of aggressive behavior, but virtually all have the capacity to metastasize and cause death. Treatment for high-grade soft tissue sarcomas is typically resection (removal) and radiation. Chemotherapy is playing an ever-increasing role, especially in high-grade (fast-growing) and metastatic cases.
Cancer cells are often referred to as differentiated versus undifferentiated. Differentiation describes how much or how little the tumor tissue microscopically resembles the normal tissue from which it originated. Well-differentiated cancer cells look much like normal cells and tend to grow and spread more slowly than poorly differentiated or undifferentiated cancer cells. Differentiation is used in tumor grading systems, which are different for each type of cancer.1 The most common types of soft tissue sarcomas are described below.2
Malignant Fibrous Histiocvtomas (MFH)/Pleomorphic Sarcomas (PS) Not Otherwise Specified (NOS)
The most commonly encountered soft tissue sarcoma is malignant fibrous histiocytoma, a tumor of the fibrous tissue most often occurring in the arms or legs. The least differentiated of the sarcomas, in many cases it represents a poorly defined, high-grade soft tissue sarcoma that cannot be further defined pathologically (histologically). A recent trend is to classify these poorly differentiated sarcomas as pleomorphic sarcomas or spindle cell sarcomas not otherwise specified (NOS), rather than the previous designation as malignant fibrous histiocytoma. Poorly differentiated sarcomas typically affect older individuals. Analysis of annual rates of MFH and PS reflect this evolving diagnostic trend.
Liposarcomas
The next most commonly encountered and reported soft tissue sarcoma is liposarcoma, a malignant tumor of the fatty (adipose) tissues. This sarcoma also is more common in older persons. There are several subtypes ranging from the low-grade lipoma-like liposarcoma that rarely metastasizes to high-grade pleomorphic liposarcomas and round cell liposarcomas, which have a prognosis similar to malignant fibrous histiocytoma. Liposarcomas can develop anywhere in the body, but they most often develop in the thigh, around the knee, and inside the back of the abdomen. Seen in a wide range of patient ages, liposarcomas occur most frequently in adults between 50 years and 65 years old. Some liposarcomas grow very slowly, whereas others can grow quickly.
Synovial Sarcomas
The third most commonly encountered soft tissue sarcoma is synovial sarcoma, which is more likely to affect younger adults than previously mentioned sarcomas. The most common location is the thigh. Despite the name synovial sarcoma, most do not occur in joints or in the synovium of joints. Synovial sarcomas tend to occur mostly in young adults but can also occur in children and in older people. Many of these cases respond very favorably to chemotherapy with significant shrinkage of the tumor, although resection (surgical removal) and radiation remain the cornerstones of current therapy. Prognosis is similar to malignant fibrous histiocytoma and the other high-grade soft tissue sarcomas mentioned above.
Tumors of Muscle Tissue
Leiomyosarcomas
Smooth muscle (involuntary muscle) cells are found in internal organs such as stomach, intestines, blood vessels, or uterus. This muscle tissue gives these organs the ability to contract involuntarily. Leiomyosarcomas are malignant tumors of involuntary muscle tissue. They can occur almost anywhere in the body, but most often are found in the uterus. A second common site is the retroperitoneum (back of the abdomen) and in the internal organs and blood vessels where leiomyomas (benign version of similar tumor) also arise. Less often, they develop in the deep soft tissues of the legs or arms. They tend to occur in adults, particularly the elderly. Since they often arise from the smooth muscle cells in the walls of arteries, resection of extremity leiomyosarcomas frequently requires a concomitant vascular reconstruction.
Rhabdomyosarcomas
Skeletal muscles are the voluntary muscles that control and allow movement of arms and legs and other body parts. Rhabdomyosarcomas are malignant tumors of skeletal muscle. These tumors commonly grow in the arms or legs, but they can also begin in the head and neck area and in reproductive and urinary organs, such as the vagina or bladder. Rhabdomyosarcomas are primarily tumors of children. Clinically and behaviorally, they are in a class by themselves. They are treated with aggressive chemotherapy, as well as surgery and/or radiation in many cases. The aggressive treatments often cause permanent life-altering disability, even in survivors. For more information, see the American Cancer Society document "Rhabdomyosarcoma [1285].“
Malignant Peripheral Nerve Sheath Tumors
Malignant schwannomas, neurofibrosarcomas, and neurogenic sarcomas are malignant tumors of the protective lining that surrounds nerves. The currently favored name for these sarcomas is malignant peripheral nerve sheath tumor. A rare form of cancer, it often has an association with neurofibromatosis and thus may possess a genetic component.
Tumors of Blood Vessels and Lymph Vessels
Angiosarcomas (Hemangiosarcomas)
Malignant tumors can develop either from blood vessels (hemangiosarcomas) or from lymph vessels (lymphangiosarcomas). These tumors often develop in a part of the body that has been exposed to radiation. Angiosarcomas are sometimes seen in the breast after radiation therapy for breast cancer or in the arm on the same side as a breast that has been irradiated or removed by mastectomy. They are difficult to cure as they spread through the bloodstream to other parts of the body and often spread extensively through the local tissues.
Hemangiopericytoma
These are tumors of perivascular tissue (tissue around blood vessels). They most often develop in the legs, pelvis, and retroperitoneum (the back of the abdominal cavity) and are most common in adults. These can be either benign or malignant. They do not often spread to distant sites, tending to recur where they started, even after surgery, unless widely excised. Following recent research and further histologic, genetic, and clinical evaluations, hemangiopericytomas have recently been reclassified as one end of the spectrum of malignant solitary fibrous tumors or possibly identical to malignant solitary fibrous tumors.
Hemangioendothelioma
This is a less aggressive blood vessel tumor than hemangiosarcoma, but still considered a low-grade cancer. It usually invades nearby tissues and sometimes metastasizes to distant parts of the body. It may develop in soft tissues or in internal organs, such as the liver or lungs.
Kaposi Sarcoma
These cancers are composed of cells similar to those lining blood or lymph vessels. In the past, Kaposi's sarcoma was an uncommon cancer mostly seen in older people with no apparent immune system problems. It is now most common in people with human immunodeficiency virus (HIV) infection and the acquired immunodeficiency syndrome (AIDS). It also develops in organ transplant patients who are taking medication to suppress their immune system. It is probably related to infection with a virus called human herpesvirus-8 (HHV-8).
Tumors of Fibrous Tissue
Fibrous tissue forms tendons and ligaments and covers bones, muscles, and joint capsules, as well as other organs in the body.
Malignant fibrous histiocytoma (MFH)
MFH is found most often in the arms or legs. Less often, it can develop inside the back of the abdomen. This sarcoma is most common in older adults. Although it mostly tends to grow locally, it can spread to distant sites. It is the most commonly diagnosed soft tissue sarcoma, although now these are more often classified as pleomorphic sarcoma, not otherwise specified (NOS), as discussed in the introduction section of soft tissue cancers.
Fibrosarcoma
Fibrosarcomas are cancers of fibrous tissue. They have a characteristic herringbone cloth pattern when viewed under the microscope. Fibrosarcomas most commonly affect the legs, arms, or trunk. They are most common between the ages of 20 years and 60 years, but can occur at any age, even in infancy.
Dermatofibrosarcoma protuberans (DFSP)
These tumors are slow-growing cancers of the fibrous tissue beneath the skin, usually noted in the trunk or limbs. They invade nearby tissues but rarely metastasize. They primarily affect young adults. Due to their slow, insidious growth, their uncommon occurrence, and their innocuous appearance, diagnosis is often delayed. The local recurrence rate is higher than many sarcomas and has been reported to be as high as 50% in some studies. While death due to disease is uncommon (<5%), the local recurrences can cause significant local morbidity.
Fibromatosis/Desmoid tumors
Fibromatosis is one of the names given to neoplastic tumors with features between fibrosarcomas and benign tumors, such as fibromas and superficial fibrous diseases like Dupytren's disease. They tend to grow slowly, but steadily. These tumors are often referred to as desmoid tumors. Although they are benign and do not metastasize, they do form in response to genetic alterations similar to many cancers and can cause great disability and even death. These tumors can invade nearby tissues, causing great havoc and occasionally even death. Some doctors may consider these to be a type of low-grade fibrosarcomas; most, however, regard them as benign but locally aggressive tumors. Certain hormones, particularly estrogen, may increase the growth of some desmoid tumors. There has been a very recent evolution in the thinking about this disease, with an evolution toward a greater role for careful observation after diagnosis, with surgical intervention being less enthusiastically employed, reserving such for more painful and/or aggressively growing tumors. Antiestrogen drugs are sometimes useful in treating desmoids that cannot be completely removed by surgery. Radiation therapy plays a role in treatment, especially when the tumor cannot be resected or in recurrent cases. There are ongoing chemotherapeutic trials in place with newer agents that interrupt the various biological processes in the growth of these tumors that hold promise for future patients. Additional research into the biology and treatment of these, and virtually all tumors, is clearly indicated.
Tumors of Uncertain Tissue Type
Through microscopic examination and other laboratory tests, doctors can usually find similarities between most sarcomas and certain types of normal soft tissues, thus, allowing them to be classified based on this histologic appearance. However, some sarcomas have not been linked to a specific type of normal soft tissue due to their unique appearance that does not closely resemble any normal single tissue type.
Malignant mesenchymoma
These very uncommon sarcomas contain areas showing features of at least two types of sarcoma, including fibrosarcomatous tissue per the original description. Since all connective tissue derive from undifferentiated mesenchymal tissues in an embryologic sense, it has been termed Mesenchymoma. The term has fallen out of favor, and it is now thought that many cases may be better classified as one of the subtypes of sarcomas based on the tissue type contained within the tumor.3
Alveolar soft-part sarcoma
This rare cancer primarily affects young adults. The legs are the most common location of these tumors. One of the most vascular (many tumor-contained and tumor-associated blood vessels) of all sarcomas, it induces an extensive network of vessels to grow in and around the tumor. Because of their very slow growth rate, a delay in diagnosis can occur. Unfortunately, it ultimately has a high mortality rate and can lead to death years after diagnosis. The rate of progression can be quite slow; late metastases are common.
Epithelioid sarcoma
This sarcoma often develops in tissues under the skin of the hands, forearms, feet, or lower legs. Adolescents and young adults are often affected. These are often misdiagnosed as infections and chronic infectious ulcers because of their innocuous appearance and uncommon occurrence. This sarcoma has a much higher propensity for lymph node metastasis than most sarcomas, which usually preferentially metastasize to the lung.
Clear cell sarcoma
This rare cancer often develops in tissues of the arms or legs. It recently has been determined to be a variant of malignant melanoma, a type of cancer that develops from pigment-producing skin cells. How cancers with these features develop in parts of the body other than the skin is not known. As a melanoma, it behaves differently than sarcomas. It has a propensity to spread through the lymphatic system. Local recurrence is common; therefore, wide resections are required for complete local eradication.
Other Types of Sarcoma
There are other types of soft tissue sarcomas, but they are less commonly encountered and not included in this discussion.
A recently published study, based on the National Cancer Database NCDB of the American College of Surgeons Commission on Cancers, reports the 13-year experience (1998-2010) with 34 of the most commonly encountered soft tissue sarcomas. This report provides a good overview of the US experience with soft tissue sarcomas, including survival curves, the 2- and 5-year survivorship rate, and various demographic data.4
Soft tissue sarcomas account for less than 1% of all cancer cases diagnosed each year, and for a similar proportion of cancer deaths in any given year.
In terms of case numbers, the musculoskeletal health burden in the United States from soft tissue sarcomas is three to four times greater than that of bone and joint sarcomas. For the period from 2010 to 2014, the annual average number of soft tissue neoplasms, including the heart, approximated 15,500 cases/year in the SEER database. Estimated new cases for 2018 by the American Cancer Society are 13,040.1 Soft tissue sarcomas come in a wide variety of forms that affect different age groups, but the most frequently encountered soft tissue sarcomas affect adults age 45 and older. (Reference Table 6A.A.1.3.1 PDF [1209] CSV [1210])
As previously noted, the National Cancer Data Base (NCDB), a joint program of the Commission on Cancer and the American College of Surgeons, maintains the most thorough database on patients diagnosed with soft tissue sarcomas. Although the NCDB was not created to serve as an incidence based registry, it currently gathers data on approximately 72% of the cancers treated in the United States.2 It should be noted this percentage varies from year to year based on the participation and reporting by hospitals to this voluntary database.
A 2014 report by Corey, Swett, and Ward examined the adult cases reported to the NCDB of soft tissue sarcomas during a 13-year interval (1998-2010). In 2010, 5,070 soft tissue sarcomas were reported to the NCDB. While the numbers of soft tissue sarcomas reported to the NCDB increased by 19% over this 13-year period, the number of bone sarcomas reported to the NCDB increased by only 10.7% during this same time.3 However the NCDB is not an incidence or prevalence based database, and the number can simply reflect a change in makeup of the reporting member institutions.
Soft tissue sarcomas can be found among all ages, with the risk of developing soft tissue cancer very small, ranging from 0.33% at 20 years to 0.17% at 75 years of age. However, due to the smaller population count in older cohorts, the share of cases diagnosed after the age of 55 is larger than in younger cohorts. (Reference Table 6A.A.1.3.1 PDF [1209] CSV [1210], Table 6A.A.1.3.2 PDF [1288] CSV [1289], and Table 6A.A.1.6.2 PDF [1261] CSV [1262])
 [1291]
 The rate at which males are diagnosed with soft tissue sarcomas has historically been higher than for females, with corresponding increases or decreases found in both sexes. The most recent rates from the NCI are for the year 2014 and are 4.1/100,000 for males and 2.9/100,000 for females. Males are diagnosed with soft tissue sarcomas at a slightly higher age than females. (Reference Table 6A.A.1.1.3 PDF [1292] CSV [1293] and Table 6A.A.1.7 PDF [1251] CSV [1252])
Blacks are diagnosed an average of eight years earlier than those who are white. In the 1970s and 1980s, the incidence rates for soft tissue sarcomas was slightly higher among the black population than for the white population. However, in the early 1990s a shift was observed and today incidence rates are higher among whites. In 2014, the rates were 3.5 and 3.3 per 100,000 persons, respectively, for whites and blacks. (Reference Table 6A.A.1.7 PDF [1251] CSV [1252] and Table 6A.A.1.1.4 PDF [1294] CSV [1295])
 [1297]
The 5-year survival rate in 2010-2014 for soft tissue sarcomas is reported at 64% by the SEER database and an overall relative survival rate of 50% by the American Cancer Society.1 This rate is similar to that for leukemia, colon and rectum, and non-Hodgkin lymphoma cancers. Average length of survival after diagnosis is 5 years, similar to that of breast, colon, and bladder cancers. White women have a slightly higher 5-year survival rate than do men and live an average of 1 year longer after diagnosis. Black women are diagnosed at about the same average age as black men with soft tissue sarcomas but live an average of two years longer after diagnosis. (Reference Table 6A.A.1.5.1 PDF [1229] CSV [1230]; Table 6A.A.1.7 PDF [1251] CSV [1252]; and Table 6A.A.1.8 PDF [1253] CSV [1254])
 [1299]
 For high-grade soft tissue sarcomas, the most important prognostic factor is the stage at which the tumor is identified. Staging criteria for soft tissue sarcomas are primarily determined by whether the tumor has metastasized or spread elsewhere in the body. Size is highly correlated with risk of metastasis and survival. In general, the prognosis for a soft tissue sarcoma is poorer if the sarcoma is large. As a general rule, high-grade soft tissue sarcomas over 10 cm in diameter have an approximate 50% mortality rate and those over 15 cm in diameter have an approximate 75% mortality rate.
The staging criteria of soft tissue sarcoma of the National Cancer Institute groups sarcomas by whether they are still confined to the primary site (called localized); have spread to nearby lymph nodes or tissues (called regional); or have spread (metastasized) to sites away from the main tumor (called distant). The 5-year survival rates for soft tissue sarcomas have not changed much for many years. The corresponding 5-year relative survival rates were:
• 83% for localized sarcomas (56% of soft tissue sarcomas were localized when they were diagnosed)
• 54% for regional stage sarcomas; (19% were in this stage)
• 16% for sarcomas with distant spread (16% were in this stage)
The 10-year relative survival rate is only slightly worse for these stages, meaning that most people who survive 5 years are probably cured.1
Sarcomas are often staged by orthopedic oncologists with a staging system established by Dr. William Enneking and adopted and modified by surgical societies primarily consisting of orthopedic oncologists. That may have accounted for the lack of AJCC staging data in many cases of bone and soft tissue sarcomas reported to the NCDB. Nearly 40% of cases for 2000-2011 reported in the NCDB data have an unknown stage. This is a much higher proportion than found among other common cancer types, making it difficult to compare the severity of soft tissue sarcomas to other cancers.
From 2004-2015 inclusive, information on insurance coverage was available for roughly 65,015 patients treated with soft tissue sarcomas. The largest insurance payer was private insurance (51.0%), followed by Medicare and Medicaid (30.9% and 8.9%) respectively. Other government payors covered 1.4%, while 4.8% were uninsured and payor status was unknown in 3.0%. (Reference Table 6A.B.2.8 PDF [1301] CSV [1302])
 [1304]
 The total economic costs of malignant soft tissue sarcoma are unknown. Surgery is often the first line of treatment for soft tissue sarcoma. Multiple therapies may be needed during the course of the patient's disease, especially in more advanced cases. In later stages of the disease in those not cured with surgery alone, significant costs will accumulate as patients typically develop pulmonary disease and ultimately die. Chemotherapy, and subsequently hormone therapy, immunotherapy, bone marrow transplant, and endocrine treatments are undertaken in a small number of cases that fail standard treatments. Overall, costs will vary with treatments utilized, number, and intensity of treatments, and can easily top $100,000 for a single patient that receives surgery, chemotherapy, and radiation therapy. (Reference Table 6A.B.2.6 PDF [1275] CSV [1276])
Throughout the years 2005--2008, one study reported that the average professional charge for a primary excision was $9,700 and $12,900 for re-excision. Although every 1-cm increase in size of the tumor results in an increase of $148 for a primary excision, size was not an independent factor affecting re-excision rates. The grade of the tumor was positively associated with professional charge, such that higher-grade tumors resulted in higher charges compared to lower-grade tumors. Analysis including professional, technical, and indirect charges revealed that, on average, patients undergoing definitive primary excision at their cancer treatment center were charged $40,230. This compared to $44,770 for patients receiving definitive re-excision of unsuccessful or incomplete previous resections at the same cancer treatment center. This higher cost did not include the charges and costs generated by their previous unsuccessful or incomplete previous attempt at resection.1
This analysis confirms that proper work-up, evaluation, and treatment are key to maintain costs, as well as improve the outcome for these patients. This cost analysis did not include the costs associated with chemotherapy or radiation therapy, or the costs of diagnostic and follow-up laboratory and radiographic studies, nor the actual costs of care.
The majority of sarcomas develop in people with no known risk factors, and there is currently no known way to prevent these cases. Whereas future developments in genomic research may allow genetic testing to identify persons with increased risk of developing soft tissue sarcomas, few such predictors are available at present. Reporting suspicious lumps and growths or unusual symptoms to a doctor, and appropriate evaluation of such abnormalities can help diagnose soft tissue cancer at an earlier stage. Treatment is thought to be more effective when detected early, as smaller-diameter sarcomas have been shown to have improved outcome compared to large sarcomas.
Whenever physicians examine a patient presenting with a new mass in the leg, thigh, muscles, and deep tissue of the body, particularly if the patient has a previous history of cancer, metastatic cancers in the soft tissues should be considered. The most likely cancers to metastasize to soft tissue are cancers of the lung and kidney.
Cancers of the musculoskeletal system affect both children and adults, but virtually all tumors have different age-based frequency. Myeloma, the cancer of the bone marrow, affects older persons more, while other bone and joint tumors are more prevalent in children and young adults. Soft tissue sarcomas affect all ages, but most are more common as persons reach middle age and later years. See individual cancer discussions for further information. In general, the older the patient, the poorer the prognosis and survival.
Certain primary cancers of bones and joints (adamantinoma, osteosarcoma, Ewing sarcoma, and malignant giant cell tumor of bone) are found among people under the age of 30 years in higher proportion than expected for the overall incidence of most sarcomas. In 2010-2014, 42% of bone and joint cancers diagnosed were found in people under the age of 35 years, with more than 26% occurring among children and adolescents under the age of 20. This compares to 4% of all types of cancer sites found in people aged 35 years and younger, and only 1% in those younger than 20 years. Hodgkin lymphoma is the only other cancer to affect young people in similar numbers, with a higher percentage of cases diagnosed in the 20-year to 34-year age range. The average age at diagnosis for bone and joint cancers is 43 years, surpassed in youthfulness only by Hodgkin lymphoma, diagnosed at an average age of 39 years.1 (Reference Table 6A.A.1.3.1 PDF [1209] CSV [1210]; Table 6A.A.1.7 PDF [1251] CSV [1252] ; Table 6A.B.1.3 PDF [1219] CSV [1220] ; and Table 6A.B.1.5 PDF [1305] CSV [1306])
 [1308]
 Deaths from bone and joint cancers also are more common in people under the age of 35 years. Between 2010 and 2014, 12% of deaths from bone and joint cancer occurred in children and youth under the age of 20, and an additional 15% among young adults aged 20 years to 34 years. The mortality rate among children and youth under 20 years from bone and joint cancer comprises only 0.03% of deaths from all types of cancer, but 10% of cancer deaths in people under the age of 20 years and 5% of deaths among young people aged 20 to 34 years. The relative proportion of deaths from bone and joint cancers was higher in children, youth, and young adults than all other cancer types that disproportionately affect younger people, including brain and nervous system, leukemia, endocrine system, and soft tissue cancers. The average age at death for bone and joint cancers is 61 years, the youngest of all types of cancer. (Reference Table 6A.A.1.4.1 PDF [1211] CSV [1212]; and Table 6A.A.1.5.1 PDF [1229] CSV [1230])
 [1310]
 In 2014, osteosarcoma accounted for 55% of the malignant bone tumors in survivors diagnosed with cancer as children and alive on January 1, 2014. Nearly all the remaining bone tumors in survivors diagnosed as children and still alive had been diagnosed with Ewing sarcoma (30%). Among the childhood cancer survivors of all ages, 4.4% were survivors of bone tumors. (Reference Table T6A.A.2.2 PDF [1311] CSV [1312])
Males were a greater proportion of the osteosarcoma survivors than were females until survivors reached middle age, when females were a larger share. Nearly one in four (22%) of the survivors had been diagnosed some 35 years ago. This is comparable with childhood cancer survivors for all types of cancer, where nearly one in four (23%) were diagnosed more than 30 years ago. (Reference Table 6A.A.2.1 PDF [1313] CSV [1314])
Although not considered a childhood cancer, soft tissue sarcomas, which affect all ages, accounted for 8% of new diagnoses in the years 2010 to 2014 in children and young adults under the age of 20. Another 9% were found in the population age 20 to 34. Deaths from soft tissue sarcomas in this time frame were slightly lower but still accounted for a higher proportion of cancer deaths in the under 35 population (4% and 6%, respectively) than all except bone and joint cancers. (Reference Table 6A.A.1.3.1 PDF [1209] CSV [1210] and Table 6A.A.1.4.1 PDF [1211] CSV [1212])
Rhabdomyosarcoma, a soft tissue sarcoma of the muscle mesenchymal cells, accounts for 3.5% of all new childhood cancers among children younger than 15 years and 2.0% of cases for youth aged 15 to 19 years each year. Half of the rhabdomyosarcoma cases are in children age 10 and younger. The 5-year survival rate when detected in children under the age of 15 is now reported at 67%, dropping to 51% for youth aged 15 to 19 years.2 This data demonstrates the relationships of survival to both age and diagnostic subset. In virtually all categories, survival decreases with age advancing beyond 10 years of age. (Reference Table 6A.B.2.3 PDF [1315] CSV [1316])
 [1318]
 Burden of Childhood Musculoskeletal Cancers
The high incidence and mortality rate of bone cancers among children, youth, and young adults creates a significant burden on the productivity and life of future generations. Apart from the financial costs, emotional toil, and lost lives from the initial treatments, survivors carry significant functional burdens and continuing care costs. With no differences found in survival rates between amputation and limb-salvage surgery, up to 90% of surviving bone and joint cancer patients are treated with limb-salvaging surgery.3 These surgeries most often require implantation of massive bone-replacing endoprostheses that have limited life span and compromised function, requiring periodic surveillance and revision surgery to repair or replace worn parts. The amputated survivors will require prosthetic limbs, the function of which is clearly limiting in comparison to normal activity. Furthermore, due to wear and tear of these artificial limbs, as well as changes in the amputated stumps themselves of the survivors’ limbs, these prosthetic limbs will require ongoing costly repairs, revisions, and replacements over the years.
Both procedures are expensive. The cost estimate nearly 20 years ago was $25,000 per year for artificial limb replacement of an amputated limb in an active 20- to 30-year old man in 1997 dollars. The cost estimate was $23,500 for implant, rehabilitation, monitoring, and replacement with limb salvaging endoprostheses.4 A 1994 study comparing hospital and professional fees reported higher costs of $59,214 for the Ilizarov method of limb salvage via lengthening of the remaining parts versus $30,148 for amputation, but cited lifetime prosthetic costs of $403,200.4 Both estimates are limited by sample size and actual knowledge of long-term maintenance costs, but more recent cost estimates are not available. A 2008 study of functional outcome found no clear evidence that one procedure, limb-salvage versus amputation, provided a better functional outcome.5 Due to chronic pain and overall dysfunction, a large number of survivors, regardless of treatment, will end up on disability, requiring public support for the majority of their adult lifetime.
More than 60% of myeloma cases are diagnosed in persons age 65 years and older. This is a similar rate to respiratory and urinary system cancers, both of which disproportionately affect older persons. Soft tissue cancers affect all ages, and in relatively equal proportion in the middle and older years (ages 45 to 84 years). As previously discussed, bone and joint cancers affect a disproportionate number of younger persons and are not considered a major cancer of aging unless in a metastatic form. However, when comparing the share of cases to cohort population size, most cancers have a higher ratio as aging occurs. (Reference Table 6A.A.1.3.1 PDF [1209] CSV [1210] and Table 6A.A.1.3.2 PDF [1288] CSV [1289])
Because of the advanced age of many myeloma patients, 78% of deaths from myeloma occur in the 65 and older population. Fewer than 50% of patients survive 5 years after diagnosis, although the long-term survivors skew the average survival time up to 6 years. Soft tissue cancer deaths occur about equally in people under 65 years and those 65 years and older. Deaths from bone and joint cancers have the lowest rate in the 65-year and older population of all cancers since it affects younger persons at a high rate. Again, when compared to the cohort population size, the ratio of deaths increases with age. However, the 2 and 5 year survivorship of both bone and joint as well as soft tissue sarcomas decreases as one ages. (Reference Table 6A.A.1.4.1 PDF [1211] CSV [1212]; Table 6A.A.1.4.2 PDF [1319] CSV [1320]; and Table 6A.A.1.5.1 PDF [1229] CSV [1230])
Burden of Musculoskeletal Cancers of the Aging
The average age of the population in the United States continues to rise. With aging, the human body's ability to cope with stress and illness declines. As a result, poorer outcomes from cancers are expected in the aged due to greater decline in functional status, adaptability, and an increase in co-morbid conditions. All these factors effect survival.
The relative frequency of more common benign bone tumors has been discerned from prior publications and extrapolation from the primary author’s (Ward) case registry of consecutive surgical cases treated between 1991 through 2004. It should be noted that although Dr. Ward's personal tumor registry has been updated since 2004, in 2005 additional providers joined his group and began to share care for this cohort of patients. This, in his opinion, meant accurate incidence estimates could no longer be extrapolated from his personal tumor database. Table 6A.C.1 (PDF [1324] CSV [1325]) reflects the collected experience reported in the Mayo Clinic publication of 1986, the University of Florida publication from 1983, the J. Mirra experience reported in 1989, and the case series reflecting the practice of Dr. Ward, a full-time solo orthopedic oncologist in practice from 1991 to 2004 at Wake Forest University Health Sciences in Winston-Salem, NC.
The experience of Dr. Ward during the stated time-period is believed to reflect roughly the general prevalence of bone and soft tissue tumors, since he treated a wide variety of benign and malignant bone tumors in a broad referral practice. All cases in his registry reflected his personally treated patients, i.e., none were "consult cases" in which only radiographs or pathology slides were reviewed for outside consulting physicians. The Mayo and Mirra series included consult cases in their registries. The earlier data sets were accumulated during time periods prior to the full development of the subspecialty of orthopedic oncology; thus, only the more unusual cases of bone tumors were referred to major medical centers, making estimates of their incidence less reliable. It is believed, with the exception of bone cysts, non-ossifying fibromas, enchondromas, and osteochondromas, general orthopedic surgeons and other musculoskeletal specialists in North Carolina treated few bone tumors over the period the data was collected, as most were referred to orthopedic oncologists. Practical experience has confirmed that osteosarcoma is the least likely sarcoma to be treated by anyone other than an orthopedic oncologist. Dr. Ward and a small group of orthopedic oncologists treated nearly all patients with osteosarcomas in North Carolina for more than 28 years.
As such, comparing the cases of benign bone tumors relative to the cases of osteosarcoma treated by Dr. Ward provides a relative index that is useful in generating a broad estimate of the prevalence of these benign tumors. By comparing this estimate with the national estimate for the annual occurrence of osteosarcoma, the most commonly encountered primary sarcoma of bone, a rough estimate of the incidence and prevalence of these benign bone tumor diseases was calculated. Because the records only included patients treated surgically, incidence and prevalence estimates include only patients with these disease states that generally require surgical intervention. This selection excludes small benign tumors, thereby artificially lowering the frequency estimates. In addition, this estimation methodology likely grossly underestimates the incidence and prevalence of these tumors as many were and are likely treated by other physicians. (Reference Table 6A.C.1 PDF [1324] CSV [1325])
Osteochondroma
The most commonly encountered benign tumor of bone is osteochondroma, which typically arises near the long ends of bones. Osteochondromas are often painful because of formation of bursae (small fluid-filled sac) overlying the lesion and/or tenting and irritation of overlying soft tissues. They can cause interference with neurovascular function due to tenting of such structures over the osteochondroma surface, and they have the potential for causing growth deformity in the involved and adjacent bones. Long-term complications are uncommon except for rare cases of dedifferentiation into chondrosarcoma. There is no estimate of the number of patients seen with nonoperatively managed osteochondromas due to lack of records. An annual US prevalence of >1,500 surgical cases is based on records kept by Dr. Ward; this is believed to be clearly underestimated. This estimate would not include cases treated by general orthopedic surgeons and pediatric orthopedic surgeons, who, in addition to orthopedic oncologists, provide medical and surgical treatment of many osteochondromas.
Unicameral Bone Cysts
Unicameral bone cysts (simple bone cysts) are the second most commonly encountered benign bone lesions, with an estimated annual prevalence of more than 1,250 surgical cases. The etiology of these fluid-filled bone cysts, usually found in the growing ends of children’s long bones such as the proximal humerus or femur, is unclear. Because they never metastasize and are usually quite characteristic on radiographs, many of these are treated by other orthopedic surgeons, especially pediatric orthopedic surgeons. The true incidence, therefore, is probably significantly higher than that estimated by extrapolation from Dr. Ward's practice experience. These cystic lesions cause weakening of the bone and the patients may require multiple surgeries to rebuild the bone with bone grafts, injections, and other techniques. They occur in children, and typically recur multiple times until skeletal maturity is achieved.
Giant Cell Tumor of Bone
Giant cell tumor of bone, with an estimated annual prevalence of more than 750 cases, is the third most commonly encountered benign bone neoplasm and accounts for significant disability and dysfunction. This typically occurs near the end of the long bones, most commonly the lower femur or upper tibia, and causes destruction of the bone. The tumor may extend through the cortex of the bone into the soft tissues and, if large enough prior to treatment, can be associated with pathologic fracture of the involved bone. Smaller tumors can be treated with bone resection and reconstruction with bone grafts or cement filler. Cases that are more complicated require sophisticated reconstruction with massive joint replacements and/or massive allografts which can cause severe long-term disability. On rare occasions, giant cell tumors metastasize to the lungs. In such cases, they typically respond poorly to chemotherapy and may cause death. These tumors are rarely treated by general orthopedic surgeons. Although currently not considered the standard of care, many patients' tumors have had excellent responses to denosumab treatment, a monoclonal antibody directed against RANK ligand, the activator of osteoclasts (giant cells). This is very similar to the mechanism of action of bisphosphonates. Initial studies with denosumab have shown a very favorable response in many tumors so treated but presently, even with denosumab pretreatment, surgical resection appears to be ultimately required. Current research continues and with enhanced understanding of the underlying pathogenic mechanisms, nonsurgical management may become possible in the future.
Enchondroma
A fourth commonly encountered tumor that may require surgery is enchondroma, estimated at more than 725 annual surgical cases. Bones typically form as cartilage during the embryo stage of human development, and this cartilage model ultimately converts into bone structure. The cartilage-based growth plates add length to the bones from bone growth. Enchondromas are tumors derived from remnants of these cartilaginous tissues that abnormally remain in the skeleton as remnants or nodules from the normal pattern of maturation and development. If these achieve sufficient size, they can cause cortical bone erosion and pain or fracture and may present diagnostic challenges requiring biopsy. They often require treatment by curettage and bone grafting. These lesions can dedifferentiate into malignant cartilage tumors called chondrosarcomas. Many small enchondromas are seen incidentally, cause no symptoms, and are treated with simple observation, thus, total incidence of enchondromas is much higher than calculated from extrapolation of the surgical data. In addition, the burden of enchondromas requiring surgical treatment is very conservatively estimated, as many are treated by general orthopedic surgeons, pediatric orthopedic surgeons, and hand surgeons.
Other Benign Bone Tumors
Multiple other benign tumors are commonly encountered.
• Aneurysmal/ bone cysts (ABCs) are aggressive cystic lesions similar to unicameral bone cysts. However, ABCs are more destructive, expanding and weakening the bone and causing greater bone destruction. They tend to fill with blood and tissue, not simple fluid. Usually, ABCs respond favorably to curettage and bone grafting, but recur in at least 20% of cases. Some ABCs arise secondarily in other bone lesions and conditions such as fibrous dysplasia.
• Metaphyseal fibrous defects (non-ossifying fibromas) are focal defects in normal bone that are filled with soft tissue. These occur in 2% to 3% of children. Most resolve without ever causing symptoms and may never be detected unless the child receives an X-ray or MRI scan for another problem. Large ones may require surgery, such as bone grafting to prevent fracture and for surgery to treat completed fractures that have already occurred.
• Osteoid osteoma is a small tumor typically occurring in children that is associated with severe, unrelenting night pain. It usually requires resection or radio frequency ablation and occasionally may require bone grafting. When located in the spine, it can cause a painful scoliosis. Recently, successful treatment with radio frequency ablation under radiographic guidance has become the treatment of choice for accessible lesions.
• Chondroblastoma is an unusual neoplasm that occurs in the ends of growing bones in teenagers and young adults. This requires resection of the lesion and bone grafting. If untreated, it can cause collapse and degenerative arthritis in the associated joint and, on rare occasion, can metastasize to the lung. Chondroblastomas are usually referred to orthopedic oncologists.
• Numerous other less common benign bone tumors often are treated similarly to giant cell tumors, ABCs, or chondroblastomas with curettage, resection, and bone grafting. Most cause some degree of disability and dysfunction of the involved extremity.
As with the benign bone tumors, there is no national registry of benign soft tissue tumors. By comparing Dr. Ward's 13 years of practice history from 1991 to 2004 and computing an incidence index relative to that of osteosarcoma, some estimate of the minimal prevalence of surgically treated lesions may be obtained.
From this index estimate, a baseline estimated extrapolation of the national incidence can be calculated. However, benign soft tissue tumors are the most likely category of tumors to be treated by other surgeons, such as general orthopedic surgeons, plastic surgeons, and general surgeons; therefore, this national estimate is extremely conservative. The prevalence and burden In the United States from benign soft tissue tumors is significantly higher than estimated herein. (Reference Table 6A.C.1 PDF [1324] CSV [1325])
Benign soft tissue tumors are usually detected as asymptomatic masses. Treatment typically requires resection. Benign lesions rarely cause death, and it is rare that an amputation is necessary. However, depending on the site of involvement and size of the lesion, significant disability of the involved extremity and/or joint can occur. The true cost of these otherwise benign neoplasms can be high for healthcare costs, lost worktime, morbidity, emotional cost, and disability expenses.
Tumors of Fat Tissue
Lipomas: Benign tumors of fat tissue
Lipomas are the most common benign soft tissue tumor. Most are found under the skin, but they can develop anywhere in the body. Many lipomas are present for years and inactive, but those that are growing lesions are probably the most commonly resected soft tissue benign tumor. Resection of small growing lesions is usually performed in local community settings by multiple surgical specialists and even by primary care practitioners. Only patients with larger, more concerning lesions are typically referred to surgeons with a focus in surgical oncology. Not infrequently, a slow-growing sarcoma is mistakenly diagnosed as a lipoma, leading to a delay in the diagnosis of soft tissue sarcoma. This misdiagnosis can lead to an original suboptimal resection of the unappreciated sarcoma by the unsuspecting community surgeon.
Lipoblastomas
Lipoblastomas are benign fat tumors that occur in infants and young children.
Hibernomas
Hibernomas are benign fat tissue tumors that behave similarly to lipomas. They are so named because of their brownish coloration that resembles the appearance of the fatty tissue of bears, hence the name hibernomas. They are much less common than lipomas.
Tumors of Muscle Tissue
Leiomyomas (Smooth Muscle Benign Tumors)
Smooth muscle is found in internal organs such as stomach, intestines, blood vessels, or uterus. Unlike skeletal muscle that contracts voluntarily, smooth muscle contracts involuntarily. Leiomyomas are benign tumors of smooth, or involuntary muscle. Leiomyomas can arise almost anywhere in the body in either men or women because they start in widespread tissues such as blood vessels or intestine. The most common leiomyomas is the fibroid tumor that often develops in the uterus.
Rhabdomyomas (Skeletal Muscle Benign Tumors)
Skeletal muscle is the muscle that allows movement of arms and legs and other body parts. These are voluntary muscles. Rhabdomyomas are benign tumors of skeletal muscle and are very rare.
Benign Tumors of Peripheral Nerve Tissue (Benign Peripheral Nerve Sheath Tumors)
Neurofibromas, schwannomas (neurilemmomas), and neuromas are benign tumors of nerves. These tumors can occur almost anywhere in the body. An Inherited condition called neurofibromatosis, or Von Recklinghausen disease, causes people to develop many neurofibromas throughout their body. Some of these may dedifferentiate and become malignant. These dedifferentiated malignant tumors usually form from large neurofibromas in the upper arms, neck, pelvis, or thigh. Patients with the dedifferentiated neural sarcomas have a very poor prognosis and most ultimately succumb to the cancer.
Tumors of Joint Tissue
Joints are surrounded by tough tissue called synovium, which produces fluid that lubricates joint surfaces allowing them to move smoothly. Joint tissue tumors typically arise from the synovium.
Pigmented villonodular synovitis (PVNS) is a benign tumor of joint tissue. It is most common in its nodular form in the hands, and more common in women than in men. The nodular form rarely recurs following adequate and complete excision. PVNS also occurs in a diffuse form that typically will involve the entire joint lining and has a high recurrence rate after attempted resections. PVNS in its diffuse form is most commonly encountered in the knee joint, where it often causes recurrent bloody effusions (swollen knees filled with bloody fluid). It does not spread to other joints, but when recurrent or persistent, can destroy the involved joint.
Tumors of Blood Vessels and Lymph Vessels
Hemangiomas are benign tumors of blood vessels. They are rather common, are often present at birth, and can affect the skin or internal organs. They sometimes disappear without treatment, but when located in muscles and other deep tissues, can be quite problematic and may require surgical treatment.
Glomus tumors are benign perivascular (surrounding blood vessels) tumors. They usually are found under the skin and often under fingernails. They are usually small (<1 cm), but are exquisitely tender and painful. They may make the overlying skin sensitive to even light touch from clothing.
Hemangiopericytoma is a tumor of perivascular tissue. It most often develops in the legs, pelvis, and retroperitoneum (the back of the abdominal cavity) and is most common in adults. These can be either benign or malignant. They rarely spread to distant sites but tend to recur locally following surgical resection unless very widely excised. They may be multifocal.
Lymphangiomas are benign lymph vessel tumors that are usually present at birth. Lymph is a type of fluid that circulates in every tissue of the body. Lymph fluid is collected and routed back into the venous system by the lymphatic system. It contains waste products from tissues and immune system cells. Lymphangiosarcomas are the malignant lymph vessel equivalents of angiosarcomas.
Tumors of Fibrous Tissue
Fibrous tissue forms tendons and ligaments and covers bones as well as other organs in the body.
Fibromas, elastofibromas, extra-abdominal fibromatosis, and fibrous histiocytomas are all benign soft tissue tumors. Fibromatosis is the most problematic of these tumors. They frequently recur following resection, and may require additional treatment with repeat surgery, radiation therapy, chemotherapy, or other therapies. Although these tumors do not metastasize, they can be challenging. Fibromatoses (desmoid tumors) were discussed at length under the malignant soft tissue section above where they are often grouped due to their locally aggressive nature.
Tumors of Uncertain Tissue Type
Through microscopic examination and other laboratory tests, doctors can usually find similarities between most soft tissue tumors and certain types of normal soft tissues. This is how soft tissue tumors are classified. However, some soft tissue tumors have not been linked to a specific type of normal soft tissue.
Myxoma is a benign tumor that is usually located in muscles but does not develop from muscle cells. The cells of a myxoma produce mucus-like material in and around the cells, a distinguishing feature of this tumor. They are usually found in adults, and rarely recur after treatment. Myxoma must be differentiated from myxofibrosarcoma, a malignant neoplasm that can appear very similar under the microscope as well as in gross appearance. The challenge for the treating physician is to avoid overtreating myxomas and to avoid undertreating myxofibrosarcomas, in terms of the extent of normal tissue margin around the tumor to be resected with the tumor to minimize the risk of recurrence.
Granular cell tumors are very uncommon and are usually benign tumors of adults that can be found almost anywhere in the body. They are frequently multifocal.
Tumor-like Conditions of Soft Tissue
Some conditions of soft tissues are caused by inflammation or injury that forms a mass similar to a soft tissue tumor. Unlike a true tumor, they do not come from a single abnormal cell; they have limited capacity to grow or spread to nearby tissues, and never spread through the bloodstream or lymph system. Examples include nodular fasciitis and myositis ossificans, which involve tissues under the skin and muscle tissues, respectively.
There are also deposition diseases that are often grouped with tumors. The most commonly encountered ones are tophi, often seen in cases of poorly controlled gout. These tophi can achieve massive size and may be mistaken for true tumors. They can erode through the skin, causing skin breakdown and infection that may require surgical treatment and antibiotics. Calcium deposits are often seen in renal failure and poorly managed dialysis patients. They may be painful and may require difficult resection of deposits infiltrated into normal tissue. When not associated with diseases of abnormal calcium metabolism, such as renal failure and dialysis, the disease is termed tumoral calcinosis. It behaves essentially the same as the calcium deposition mentioned in association with renal disease. Amyloid deposition can rarely cause a soft tissue (or bony) mass. These are most often seen in poorly controlled dialysis patients. Rheumatoid nodules are soft tissue deposits of antibody-laden, inflammatory soft tissue masses that can be quite painful and may require resection for symptomatic relief. Adequate treatment of the underlying rheumatoid arthritis with current disease-modifying medications usually prevents the occurrence of such lesions.
Unlike other content areas in this document, the incidence and burden of musculoskeletal tumors relies on the extensive cancer reports available from national cancer databases. ICD-9-CM codes for tumors are presented, but the national databases used in other sections were not analyzed for tumors.
SEER Cancer Statistics Review
Howlader N, Noone AM, Krapcho M, Miller D, Bishop K, Kosary CL, Yu M, Ruhl J, Tatalovich Z, Mariotto A, Lewis DR, Chen HS, Feuer EJ, Cronin KA (eds). SEER Cancer Statistics Review, 1975-2014, National Cancer Institute. Bethesda, MD, https://seer.cancer.gov/csr/1975_2014/ [1326], based on November 2016 SEER data submission, posted to the SEER web site, April 2017. https://seer.cancer.gov/csr/1975_2014/ [1326] .
National Cancer Database Benchmark Reports. American College of Surgeons
American College of Surgeons: NCDB Benchmarks. National Cancer Database Comparison Reports: NCDB Analytic Cases: Disease Site by American Joint Committee on Cancer Stage, Ox Years: 2000 to 2011. Available at: https://cromwell.facs.orglBmarks/BMCmplver [1327] 10/Doosl 1•>1 Accessed February 12, 2015.
American College of Surgeons National Cancer Database
The NCDB is a joint project of the Commission on Cancer of the American College of Surgeons and the American Cancer Society. Data used in this study and this report are derived from a de-identified NCDB file. The American College of Surgeons and the Commission on Cancer have not verified and are not responsible for the analytic or statistical methodology employed, or the conclusions drawn from these data by the investigator and authors of this work.
The Kaplan Meier survivorships reported in this chapter were generated using SAS/STAT software, Version14.2 for Windows. Copyright 2002-2012, SAS Institute Inc. SAS and all other SAS Institute Inc. product or service names are registered trademarks or trademarks of SAS Institute Inc., Cary, NC, USA.
Case Series. William G. Ward, MD
Case series reflecting the practice of William G. Ward, a full-lime solo orthopedic oncologist in practice from 1991 to 2004, at Wake Forest University Health Sciences in Winston-Salem, NC.
MALIGNANT NEOPLASM OF BONE AND ARTICULAR CARTILAGE
Malignant neoplasm of bone and articular cartilage: 170
Malignant neoplasm of bones of skull and face except mandible: 170.0
Malignant neoplasm of mandible: 170.1
Malignant neoplasm of vertebral column excluding sacrum and coccyx: 170.2
Malignant neoplasm of ribs sternum and clavicle: 170.3
Malignant neoplasm of scapula and long bones of upper limb: 170.4
Malignant neoplasm of short bones of upper limb: 170.5
Malignant neoplasm of pelvic bones, sacrum, and coccyx: 170.6
Malignant neoplasm of long bones of lower limb: 170.7
Malignant neoplasm of short bones of lower limb: 170.8
Site unspecified: 170.9
Malignant neoplasm of connective and other soft tissue: 171
Of head, face, and neck: 171.1
Of upper limb Including shoulder. 171.2
Of lower limb Including hip: 171.3
Of thorax:171.4
Of abdomen:171.5
Of pelvis: 171.6
Of trunk unspecified: 171 7
Malignant neoplasm of other specified sites of connective and other soft tissue: 171.8
Site unspecified: 171.9
BENIGN TUMORS
Benign neoplasm of bone and articular cartilage: 213
Other benign neoplasm of connective and other soft tissue: 215
Neuromuscular disorder (NMD) is a collective term used to describe diseases that affect any part of the nervous system and muscles. Although there are many different forms that vary in onset, severity, and prognosis, NMDs can have a significant direct and indirect impact on an individual leading to loss of functional capacity.1
Different classification systems are available for neuromuscular disorders based on the location of involvement, the etiology, or presenting symptom. Based on the anatomic location of involvement, NMD can be categorized into
Based on the presenting symptoms, NMDs can be classified into disorders with sensory impairment, motor impairment, or both. Neuromuscular disorders can also be categorized roughly into hereditary or acquired neuromuscular NMDs.2 The breakdown of classifications based on the type of impairment at presentation include the following categories.
Sensory impairment can be divided into negative symptoms and positive symptoms. Negative symptoms, which include numbness and loss of joint proprioception with unsteadiness, are often prominent in hereditary conditions such as Charcot Marie Tooth disease or severe neuropathy. Generally, the positive sensory symptoms, such as tingling, pins/needle sensation, and burning pain, are more commonly recognized by patients and the reason they seek medical attention.
Peripheral neuropathy is the most common cause of sensory impairment. It can be divided into hereditary (often related to family history and genetic mutation) and acquired neuropathy. Depending on the area of involvement, neuropathy also can be classified into polyneuropathy, meaning multiple nerves are involved (e.g. distal symmetric polyneuropathy, brachial plexopathy), or mononeuropathy, such as carpal tunnel syndrome, cubital tunnel syndrome, or single level radiculopathies from a disc herniation or spinal stenosis.
The most common acquired polyneuropathy is secondary to diabetes, which affects an estimated 50% of the older type 2 diabetic population.3,4 The most common mononeuropathy is carpal tunnel syndrome (median nerve entrapment at the wrist), followed by ulnar nerve entrapment at the elbow. Charcot Marie Tooth disease is the most common hereditary neuropathy and has variable sensory involvement.
Motor impairment, manifested as muscle weakness and fatigue, can be secondary to motor neuron disease (such as amyotrophic lateral sclerosis), peripheral neuropathy (involving motor nerves), neuromuscular junction disorders (like myasthenia gravis), and myopathy. When it occurs with sensory impairment, peripheral neuropathy is the most common underlying cause.
Muscle pain (myalgia) or cramps are rare manifestations of some myopathies. Each group of disorders can be further classified depending on the location of involvement and underlying etiology.
Muscle weakness can be due to pain inhibition (from musculoskeletal conditions like arthritis). In contrast to the weakness accompanying pain, the weakness seen with neuromuscular disorders is more profound and often more progressive.
Swallowing difficulty (dysphagia), speech problems (dysarthria), and drooping of upper eyelid (ptosis) can be manifestations of muscle weakness in the head and neck secondary to motor neuron disease, myopathy, or neuromuscular disorders.
Mobility involves various types of movement, such as transferring from sitting to standing, walking, and stair/ramp negotiation. Motor impairments involving thigh and hip muscles limit the ability to stand, and can be caused by myopathy or neuropathy (lumbar plexopathy, amyotrophy, radiculopathy). Steady gait requires good balance and joint proprioception (the sense of the relative position of one's own parts of the body and strength of effort being employed in movement), which can be compromised in peripheral neuropathy with sensory impairment. Impairments of sensory and motor nerve functions are important risk factors for falls in older persons and relate directly to disability.5 If the distal muscles that cross the ankle are involved because of peripheral neuropathy or lumbosacral radiculopathy, patients may present with difficulty clearing their foot while walking, resulting in a dragging or slapping gait or “drop foot”.
Upper extremity muscle strength and sensation are important for activities of daily living (ADL), therefore, impairments can cause significant disability. Difficulty with dressing, brushing teeth and combing hair can occur with weakness of the shoulder and arm caused by myopathy, brachial plexopathy or radiculopathy. Injury to the hand and wrist from carpal tunnel syndrome, radiculopathy, motor neuron disease, etc. can lead to dropping objects, difficulty with buttoning and other fine motor skills.
A focal neuropathy means only one or, at most, a few nerves are injured. Pain, numbness, and weakness are confined to a single limb or a small region of the trunk or head. Focal neuropathies are typically caused by compression or trauma. Carpal tunnel syndrome is an example of a focal neuropathy (as described below).
Mononeuropathy is a form of neuropathy that affects a single nerve or, more rarely, a nerve group (mononeuritis multiplex). There may or may not be pain, followed by loss of sensation, strength, and overall function, depending on the type. These types of neuropathies are typically due to injury, compression, aging, inflammatory disorders, or other systemic diseases. Examples of mononeuropathy include carpal tunnel syndrome, ulnar neuropathy, trigeminal neuralgia, radial neuropathy, peroneal neuropathy, radiculopathy, and occipital neuralgia.
Mononeuropathy can develop if there has been a prolonged period of swelling or pressure placed on a specific point in the body such as the hands, feet, or face. Symptoms of mononeuropathy include loss of feeling, tingling, burning, muscle weakness, and paralysis.
Mononeuropathy can develop if there has been a prolonged period of swelling or pressure placed on a specific point in the body such as the hands, feet or face. Symptoms of mononeuropathy include loss of feeling, tingling, burning, muscle weakness, and paralysis.
Carpal tunnel syndrome
Carpal tunnel syndrome is the most common mononeuropathy and is caused by entrapment of the median nerve in the carpal tunnel at the wrist. It is a slowly progressive condition causing tingling, numbness, and pain in the hand and fingers (possibly sparing the pinky finger), with weakness and wasting of muscle at the base of the thumb. Based on different studies, the incidence varies between 0.99 to 3.5 persons per 1,000 person-years.1,2 Higher incidence has been reported in women and working populations requiring repetitive wrist motions. Carpal tunnel syndrome is diagnosed based on clinical information (history and physical examination) and confirmed by electrodiagnostic tests (EDx) consisting of nerve conduction studies (NCS) and electromyography (EMG).
Ulnar neuropathy
Ulnar neuropathy is the second most common entrapment neuropathy and most commonly occurs at the elbow. It presents with weakness of the hand, along with tingling, numbness, and pain in the inner side of the hand and fingers (half of ring finger and pinky). It is often triggered from irritation of the “funny bone” where the nerve is exposed along the inner aspect of the elbow.
The brachial plexus is a network of nerves that originate in the neck and branch off to form most of the other nerves that control movement and sensation in the upper limbs, including the shoulder, arm, forearm, and hand. The radial, median, and ulnar nerves originate from the brachial plexus.
Brachial plexus injury (BPI) is an umbrella term for a variety of conditions that may impair function of the brachial plexus nerve network. Most pediatric and adult brachial plexus injuries are caused by birth or trauma respectively, such as high-speed vehicular or motorcycle accidents, blunt trauma, stab or gunshot wounds. It can also be the result of inflammatory processes, compression (e.g., caused by a growing tumor, thickened muscles, or the collar bone), or genetic mutation. Symptoms are pain, loss of sensation, muscle weakness, and varying degrees of paralysis.
Radiculopathy is a nerve root disorder that can cause numbness, tingling, pain, and weakness. It is typically caused by acute or chronic pressure on a nerve root as it exits the spinal canal. The most common cause is a herniated intervertebral disc in younger patients, and spinal stenosis, or narrowing of the spinal canal, in older patients. There are also several less common causes such as meningitis, tumors, diabetes, and infections.
Cervical radiculopathy typically causes pain radiating form the neck to the arm or shoulder blade region., often accompanied by tingling, numbness or weakness. The prevalence of cervical radiculopathy is 3.3 cases per 1000, with average age-adjusted incidence rate of .8 cases per 1000 persons. Lumbosacral radiculopathy typically presents as “sciatica”, pain radiating from the lower back into the buttock, thigh and/or leg. It is more common than cervical radiculopathy with a prevalence of 3% to 5% of the adult population, which is evenly distributed between men and women.3 Most radiculopathies related to disc herniation are self-limiting with symptoms resolving over the course of weeks to months.4
Carpal tunnel syndrome is the most common reason for electrodiagnostic test (EDx) referral.1
Conservative management includes activity modification, wrist braces, occupational therapy, and ultrasound guided steroid injections, . Carpal tunnel release to decompress the entrapped nerve is the primary surgical treatment and is commonly done if symptoms persist despite conservative management. The cost of treatment varies widely depending on the type of surgery, surgery setting, and amount of occupational therapy or lost work. Surgery is typically performed in an outpatient setting, and can be done open, with a camera or with a small incision under ultrasound. Potential complications include scarring, recurrent symptoms or nerve damage, although surgery is typically successful after appropriate diagnostic workup and conservative treatment.
Patients with radiating neck and back pain and neurologic deficits often require diagnostic studies such as MRIs and EDx to confirm the clinical impression, to investigate the underlying cause, and to determine severity. Although most radiculopathies respond to conservative management (oral pain medication, physical therapy, image guided epidural steroid injections), some patients require surgical treatment to decompress the nerve root.
During 2013, there were more than 14.8 million healthcare visits made that included a diagnosis of focal neuropathy, representing nearly 1 in 20 persons in the US. Nearly all were adults over the age of 18, with most age 45 or over. Females were more likely to have a healthcare visit for focal neuropathy than males (55% of visits versus 45%), as were non-Hispanic whites. Non-Hispanic others accounted for less than 1% of focal neuropathy healthcare visits. Visits by geographic region were representative of the population. (Reference Table T6B.1.1 PDF [1329] CSV [1330]; Table 6B.1.2 PDF [1331] CSV; [1332] Table 6B.1.3 PDF [1333] CSV [1334]; and Table 6B.1.4 PDF [1335] CSV [1336])
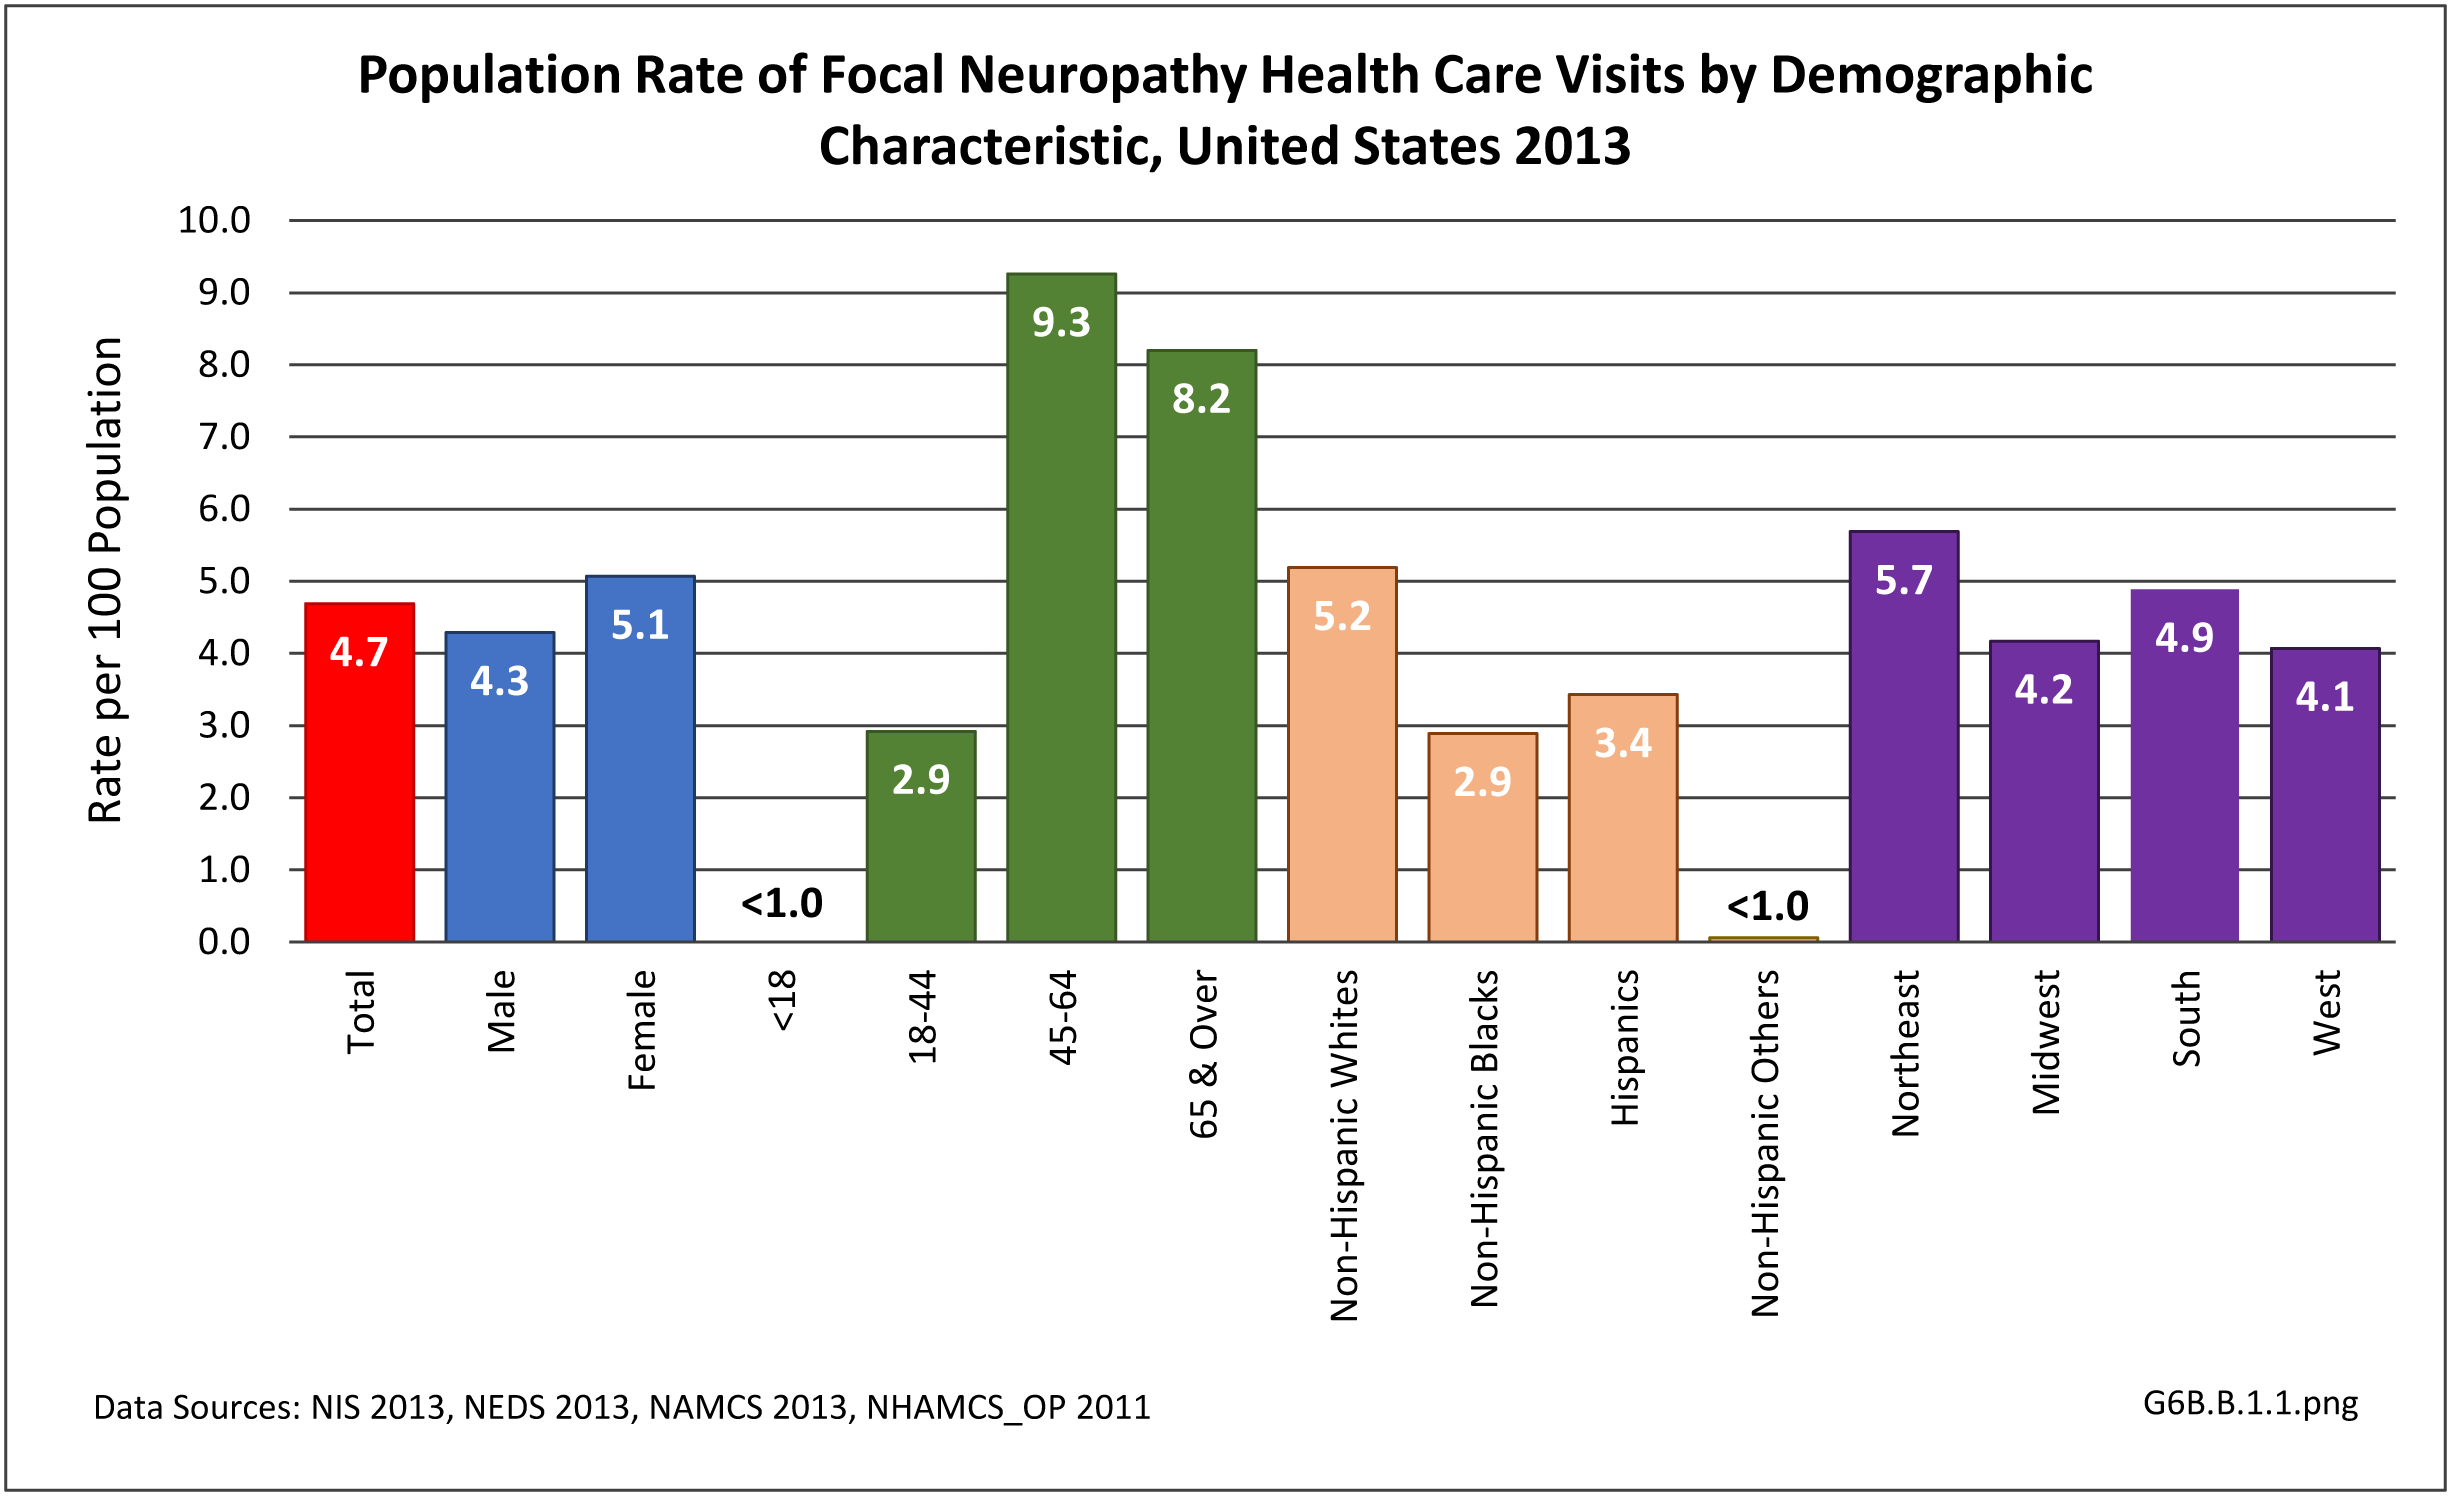 [1338]
 Slightly more than 1.2 in 100 health care visits in 2013 had a focal neuropathy diagnosis. Most of these visits (84%) were to a physician’s office, where the rate of focal neuropathy diagnoses was nearly 1.4% of all visits. Only 3% of the total health care visits with a focal neuropathy diagnosis were hospital discharges, yet this accounted for 427,100 discharges. A diagnosis of root neuropathy was made in 3 out of 4 diagnoses. (Reference Table 6B.1.5 PDF [1339] CSV [1340]) (G6B.B.1.2)
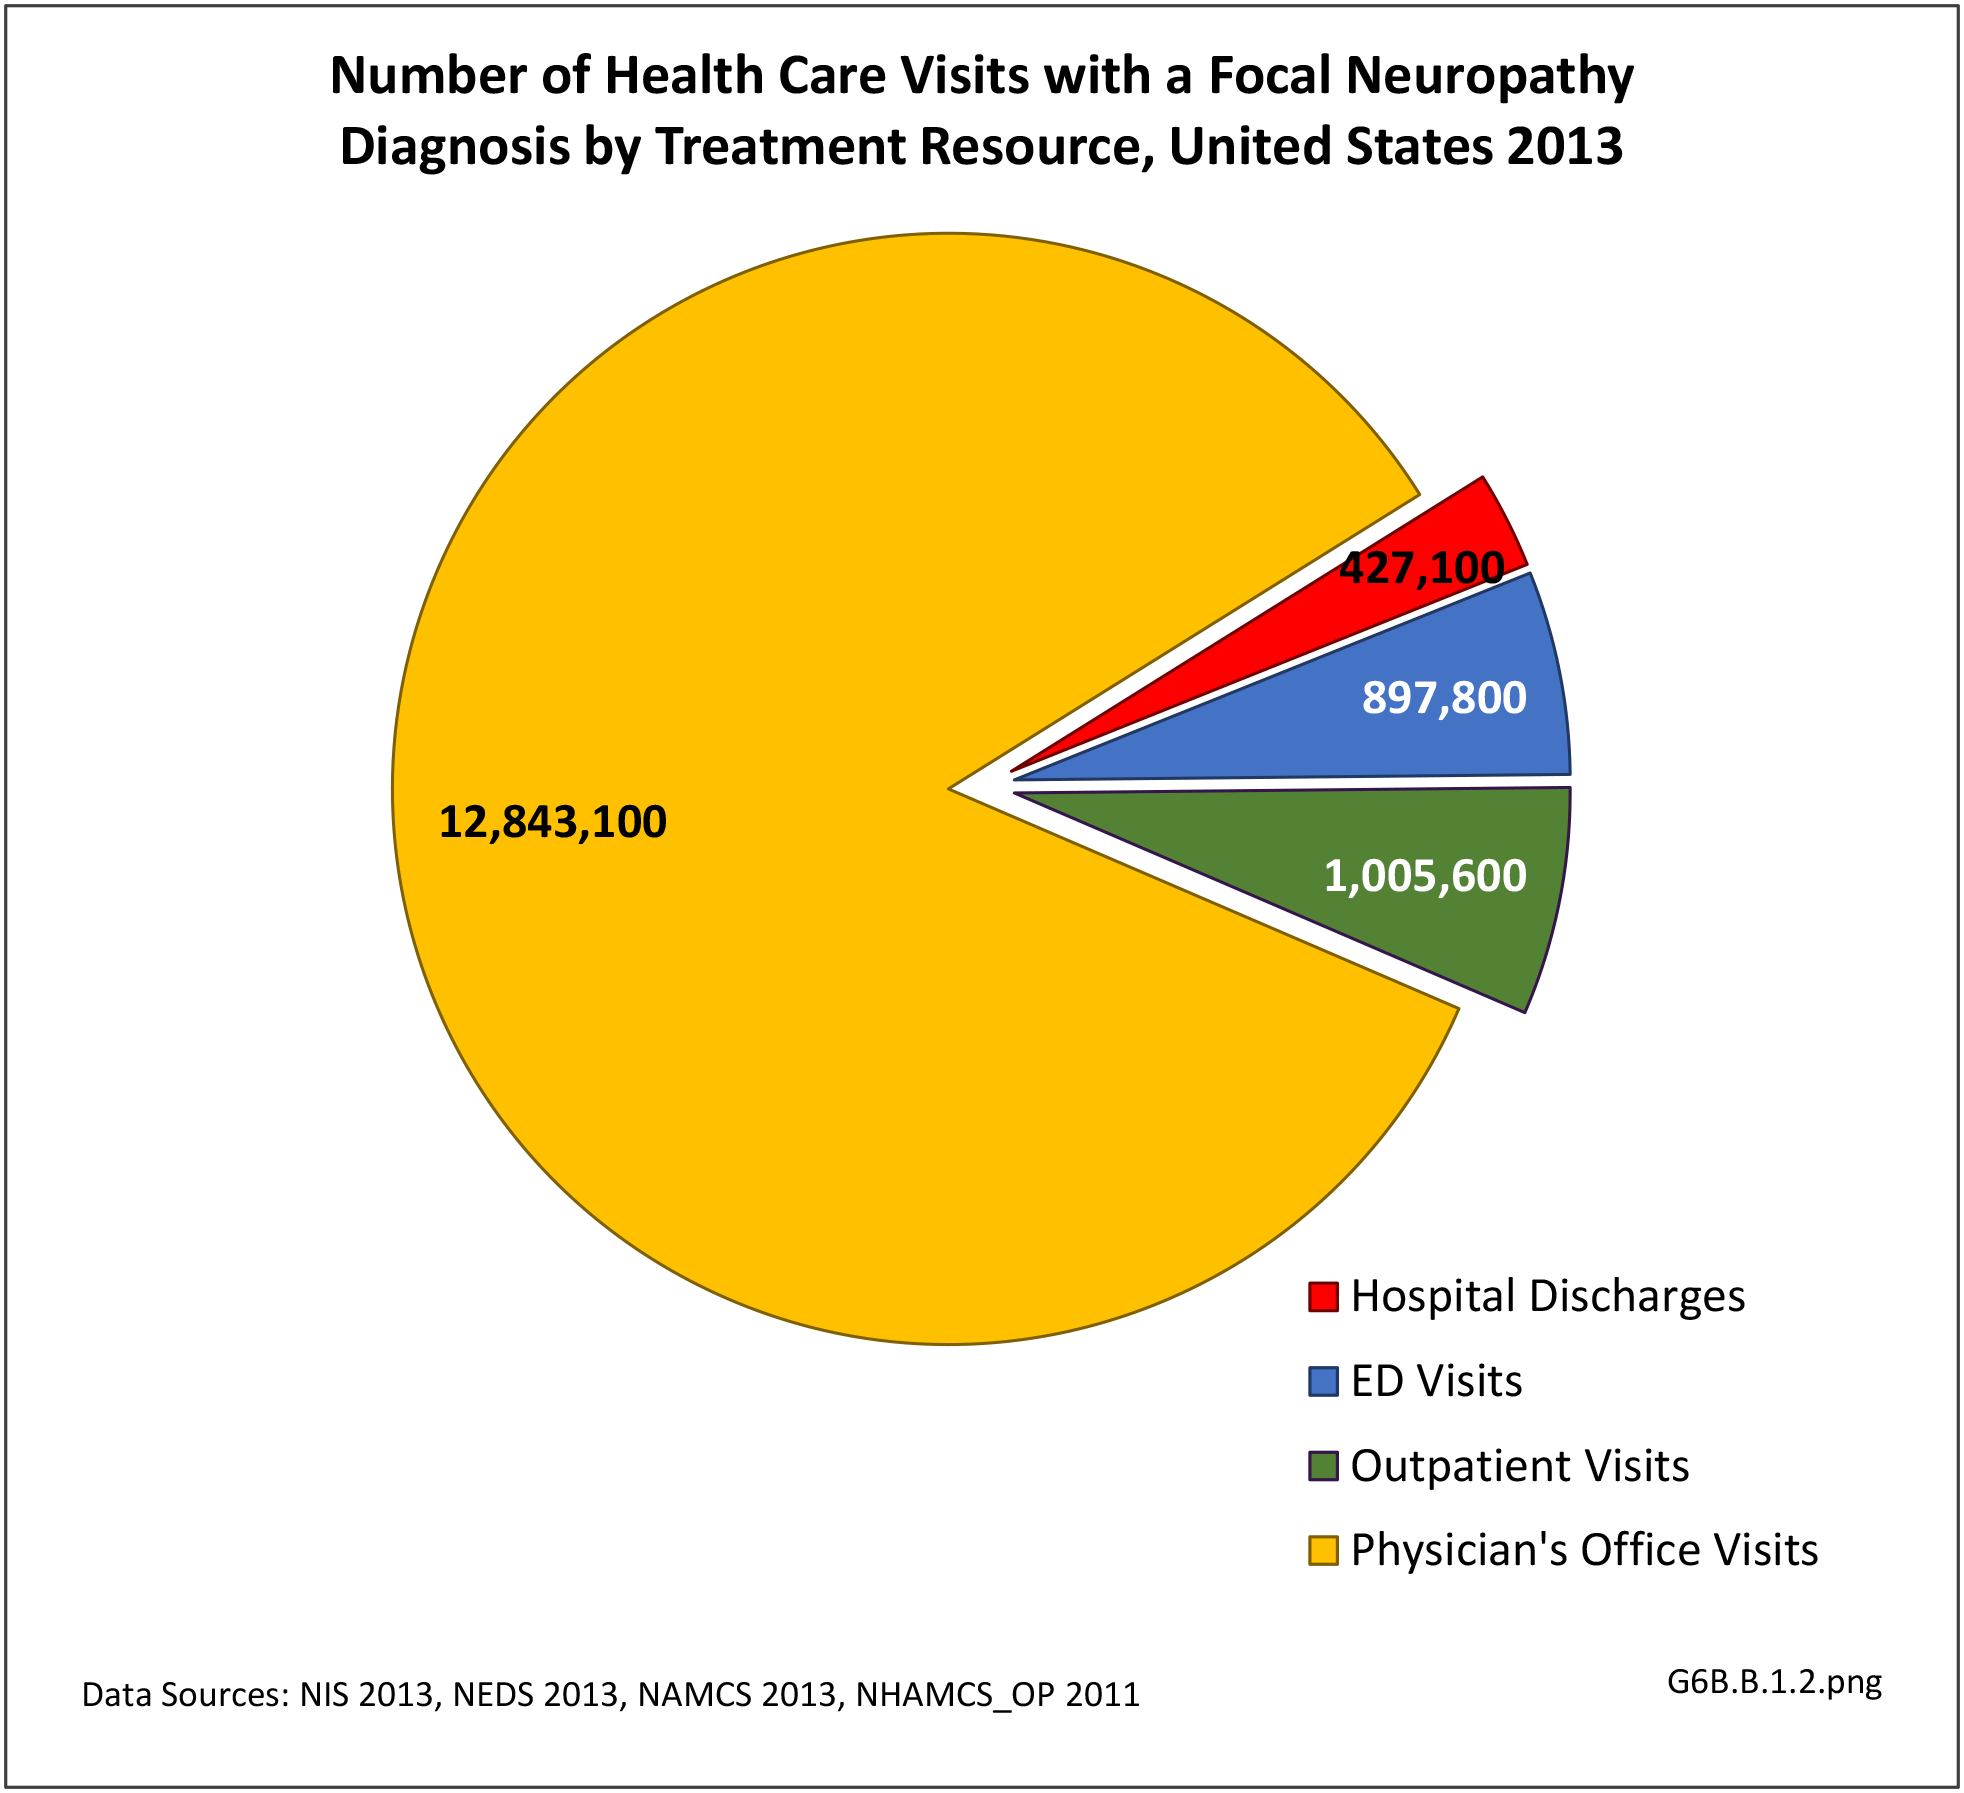 [1342]
As most entrapment neuropathies and radiculopathies increase with age, the burden of these conditions is increasing with the aging demographic profile of the US. The elderly were reported to have a higher prevalence of severe carpal tunnel syndrome.1 Due to age-related changes in the spine, the underlying etiologies of radiculopathy are different among various age groups. For example, radiculopathy from disc herniation is common in young adults, whereas spinal stenosis and spondylosis are more common in the elderly population.2
The burden of entrapment neuropathies and radiculopathy includes direct health care costs related to diagnosis, physical and occupational therapy, pain management, surgical intervention, plus indirect costs due to lost works days and productivity. Carpal tunnel syndrome is one of the most common worker’s compensation diagnoses. Radiculopathy from neck or low back conditions also significantly hampers mobility, activities of daily living, and quality of life.
Mean hospital charges for an average stay of 4.3 days in 2013 were $64,400, although this would not be actual cost paid due to variations in actual payments. Also, the hospital charges did not include professional fees and non-covered charges, such as lab tests. Adding to the cost for about one-third (36%) of discharges with a diagnosis of focal neuropathy discharged from a hospital in 2013 was “discharged to additional care”, either at a skilled nursing facility or with home health care. Mean emergency department charges were $3,200 with a focal neuropathy diagnosis, with 1 in 5 (19%) cases admitted to the hospital. (Reference Table 6B.2.1 PDF [1343] CSV [1344] and Table 6B.2.2 PDF [1345] CSV [1346])
Peripheral neuropathy is a condition that develops from a dysfunction of the nerves that transmit motor or sensory information to and from the brain, spinal cord, and the rest of the body. An estimated 20 million people in the United States have some form of the more than 100 types of peripheral neuropathy.1,2 Peripheral neuropathy can be categorized as hereditary or acquired, with diabetes mellitus the most common cause of acquired peripheral neuropathy.1 Alcohol abuse is also a common cause.
Up to 70% of patients with diabetes eventually develop peripheral neuropathy, with symptoms ranging from subtle or no symptoms to tingling, pain, and profound weakness. Symptoms usually involve the longer nerves, affecting the toes, feet, then gradually progress up the body. Sensory symptoms are more common than motor, and pain occurs in 40-60% of patients with documented neuropathy.3
Guillan-Barre syndrome (GBS) is a peripheral neuropathy in which the body’s immune system attacks part of the peripheral nerve. The syndrome is not uncommon, afflicting approximately one person in 100,000. Usually GBS occurs a few days or weeks after a respiratory or gastrointestinal viral infection. Less commonly it occurs following surgery, or vaccination. There has recently been an increased incidence of GBS due to infection from the Zika virus.
Charcot-Marie-Tooth (CMT) is one of the most common inherited peripheral neuropathies, affecting 1 in 2500 people in the United States. It has several forms affecting different parts of the peripheral nervous system. Despite its inherited fashion, the onset of symptoms varies depending on the type and severity, and it can present anytime from childhood to adulthood. Symptoms may involve the foot, lower leg and hand/finger with numbness, tingling, weakness and muscle wasting. Due to weakness, fatigue and impaired gait, quality of life is significantly impaired.4 Some patients with severe involvement are disabled.5
The diagnosis of peripheral neuropathy is made based on clinical presentation, EDx, blood tests, and occasionally biopsy. Genetic testing is utilized in hereditary conditions, especially for women in their reproductive years, and for affected family members.1
There is no cure for most peripheral neuropathies, and health care resources are typically utilized for symptomatic treatment in outpatient settings, e.g., pain management, rehabilitation (including physical and occupational therapy), and bracing. Patients with diabetic neuropathy utilize greater healthcare resources and have higher costs than patients with diabetes without neuropathy.2
Nearly 6.4 million health care visits in 2013 had a diagnosis of peripheral polyneuropathy, representing 2 in 100 persons in the US. Age is a factor in polyneuropathy, with half (52%) the diagnoses occurring in the 65 and over population. Although males and females had similar rates of diagnosis, females were slightly more likely to have a polyneuropathy diagnosis than males. Because of the small number of diagnoses overall, it is difficult to determine racial/ethnic differences. The western region of the US had a higher share of diagnoses for peripheral polyneuropathy than expected based on population.(Reference Table T6B.1.1 PDF [1329] CSV [1330]; Table 6B.1.2 PDF [1331] CSV [1332]; Table 6B.1.3 PDF [1333] CSV [1334]; and Table 6B.1.4 PDF [1335] CSV [1336])
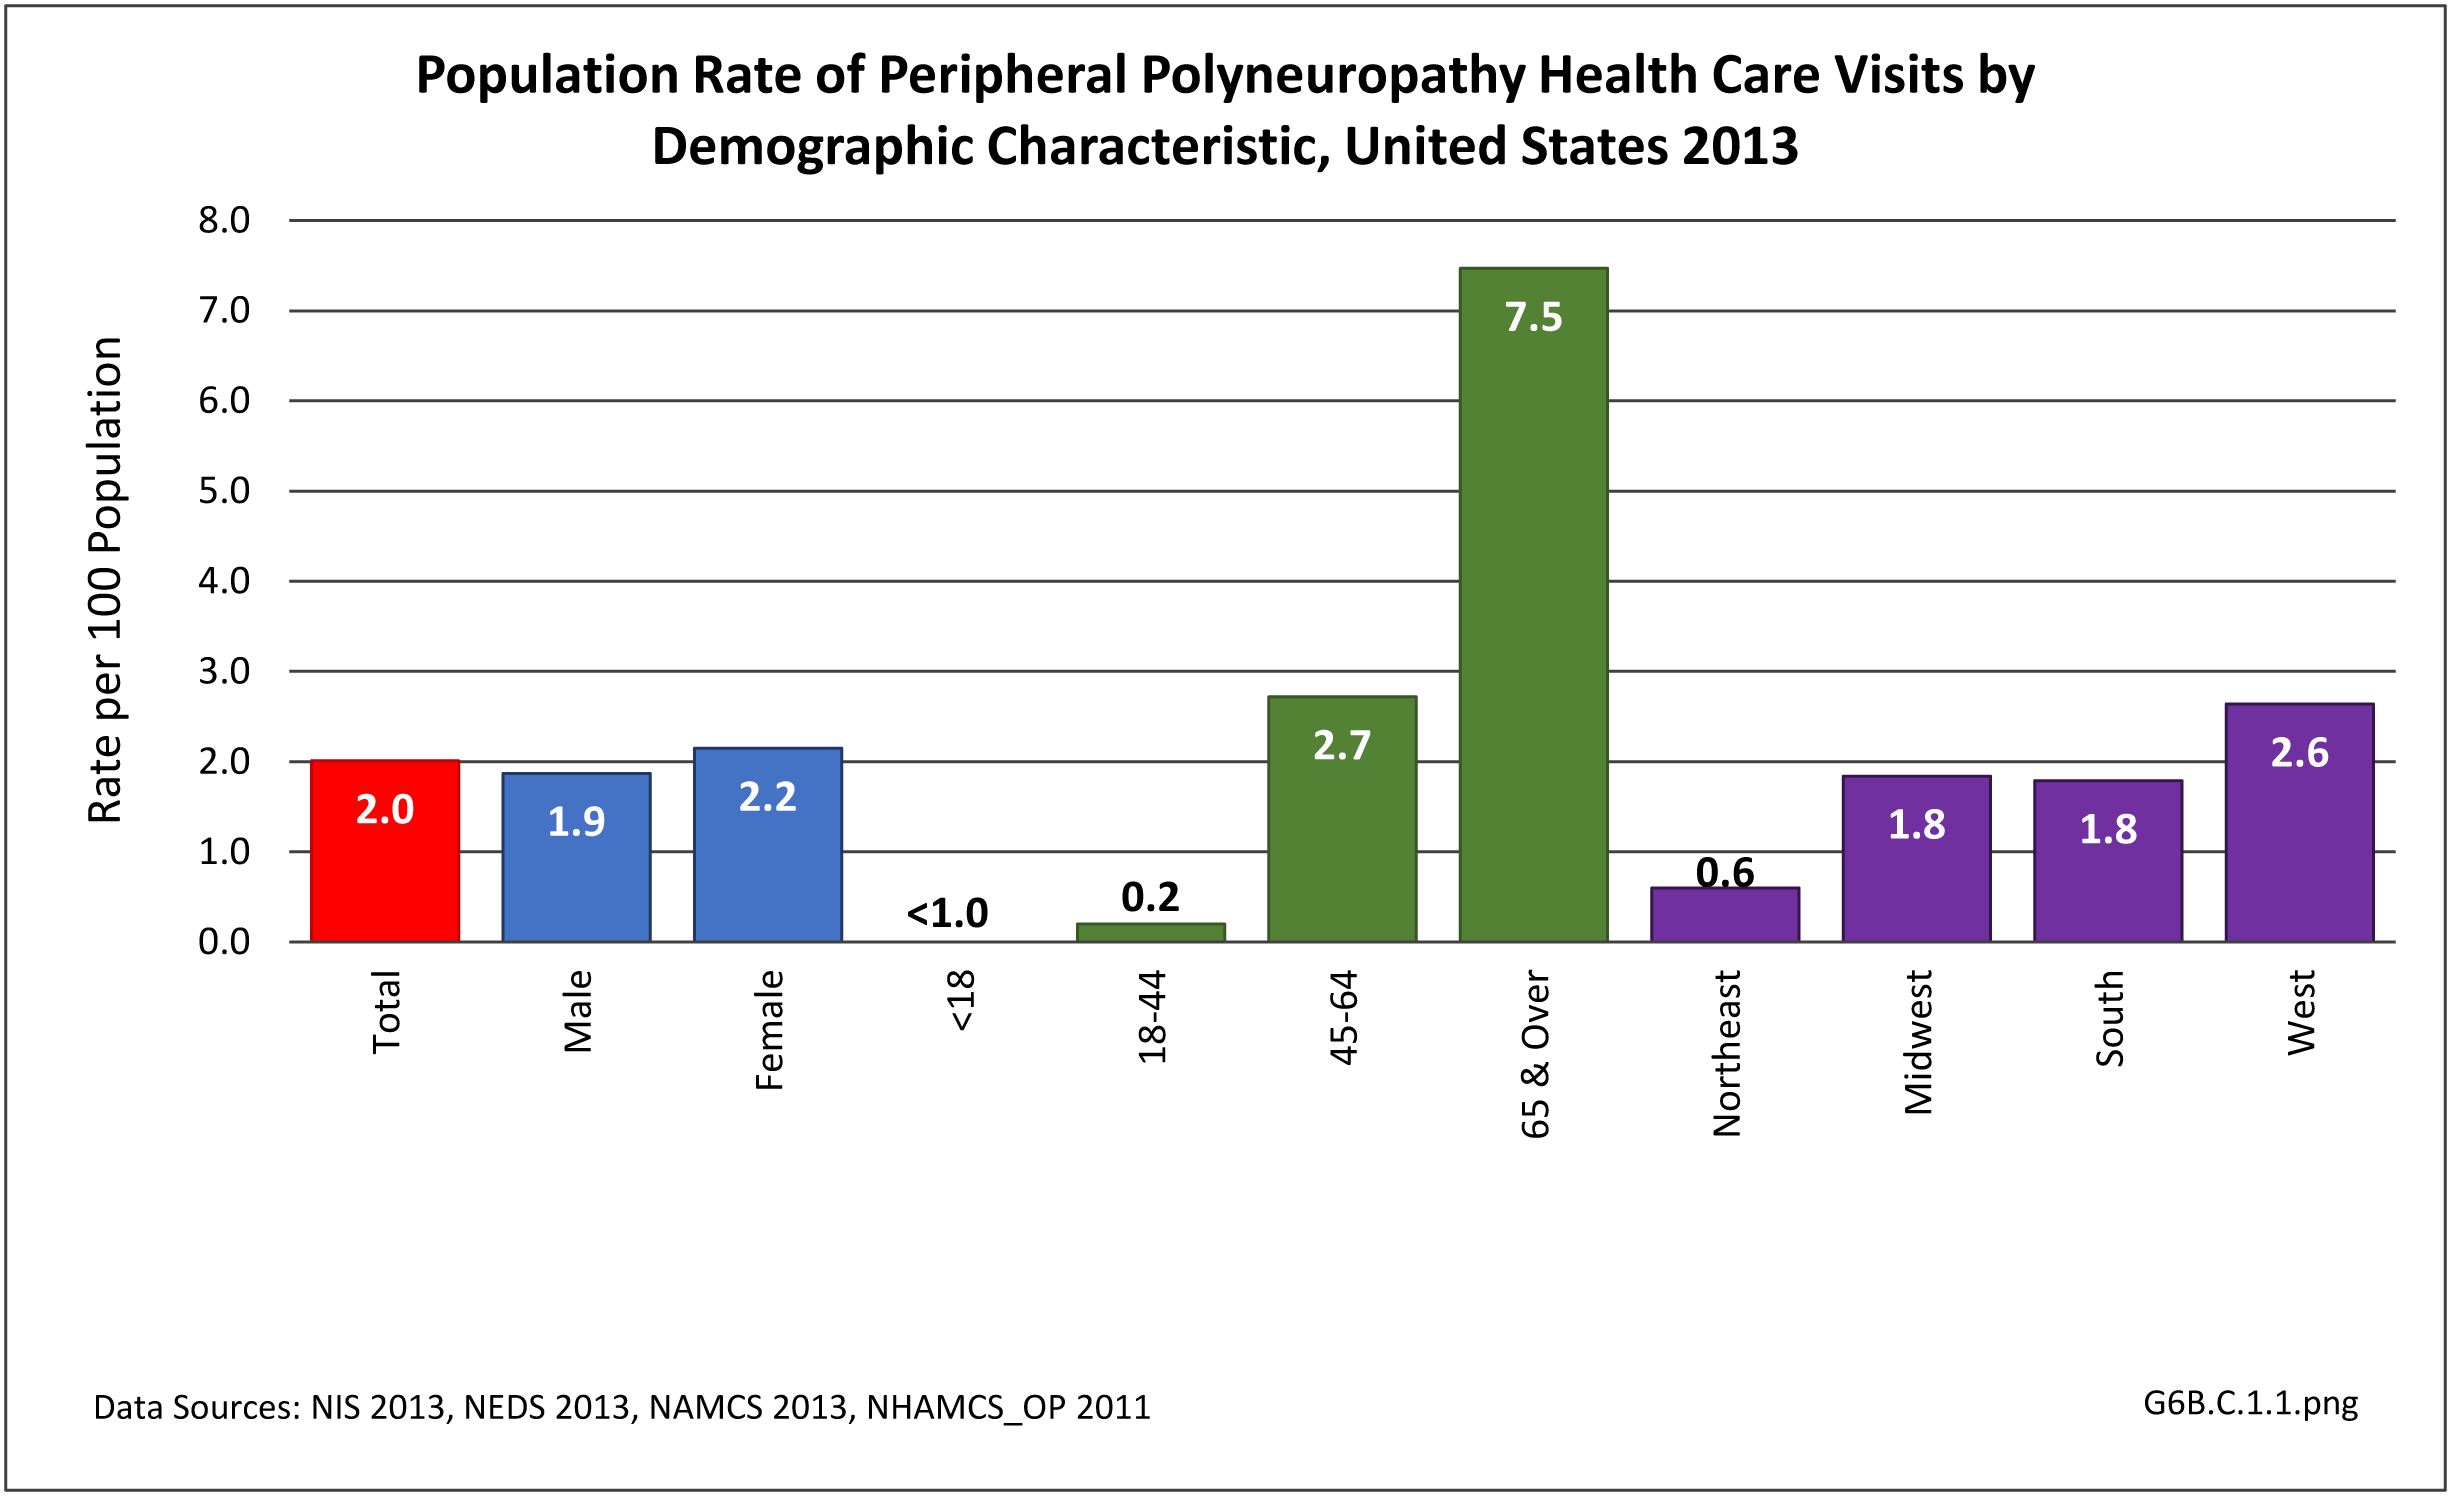 [1348]
 Using the definition of hereditary polyneuropathy versus acquired, diagnoses were evenly split between the two types. While visits to a physician’s office represented more than half (58%) of all health care visits with a peripheral polyneuropathy diagnosis in 2013, the share of hospital discharges with this diagnosis was much higher than that of physician office visits (3.0/100 versus 0.4/100). More than one million hospital discharges had a polyneuropathy diagnosis in 2013. (Reference Table 6B.1.5 PDF [1339] CSV [1340])
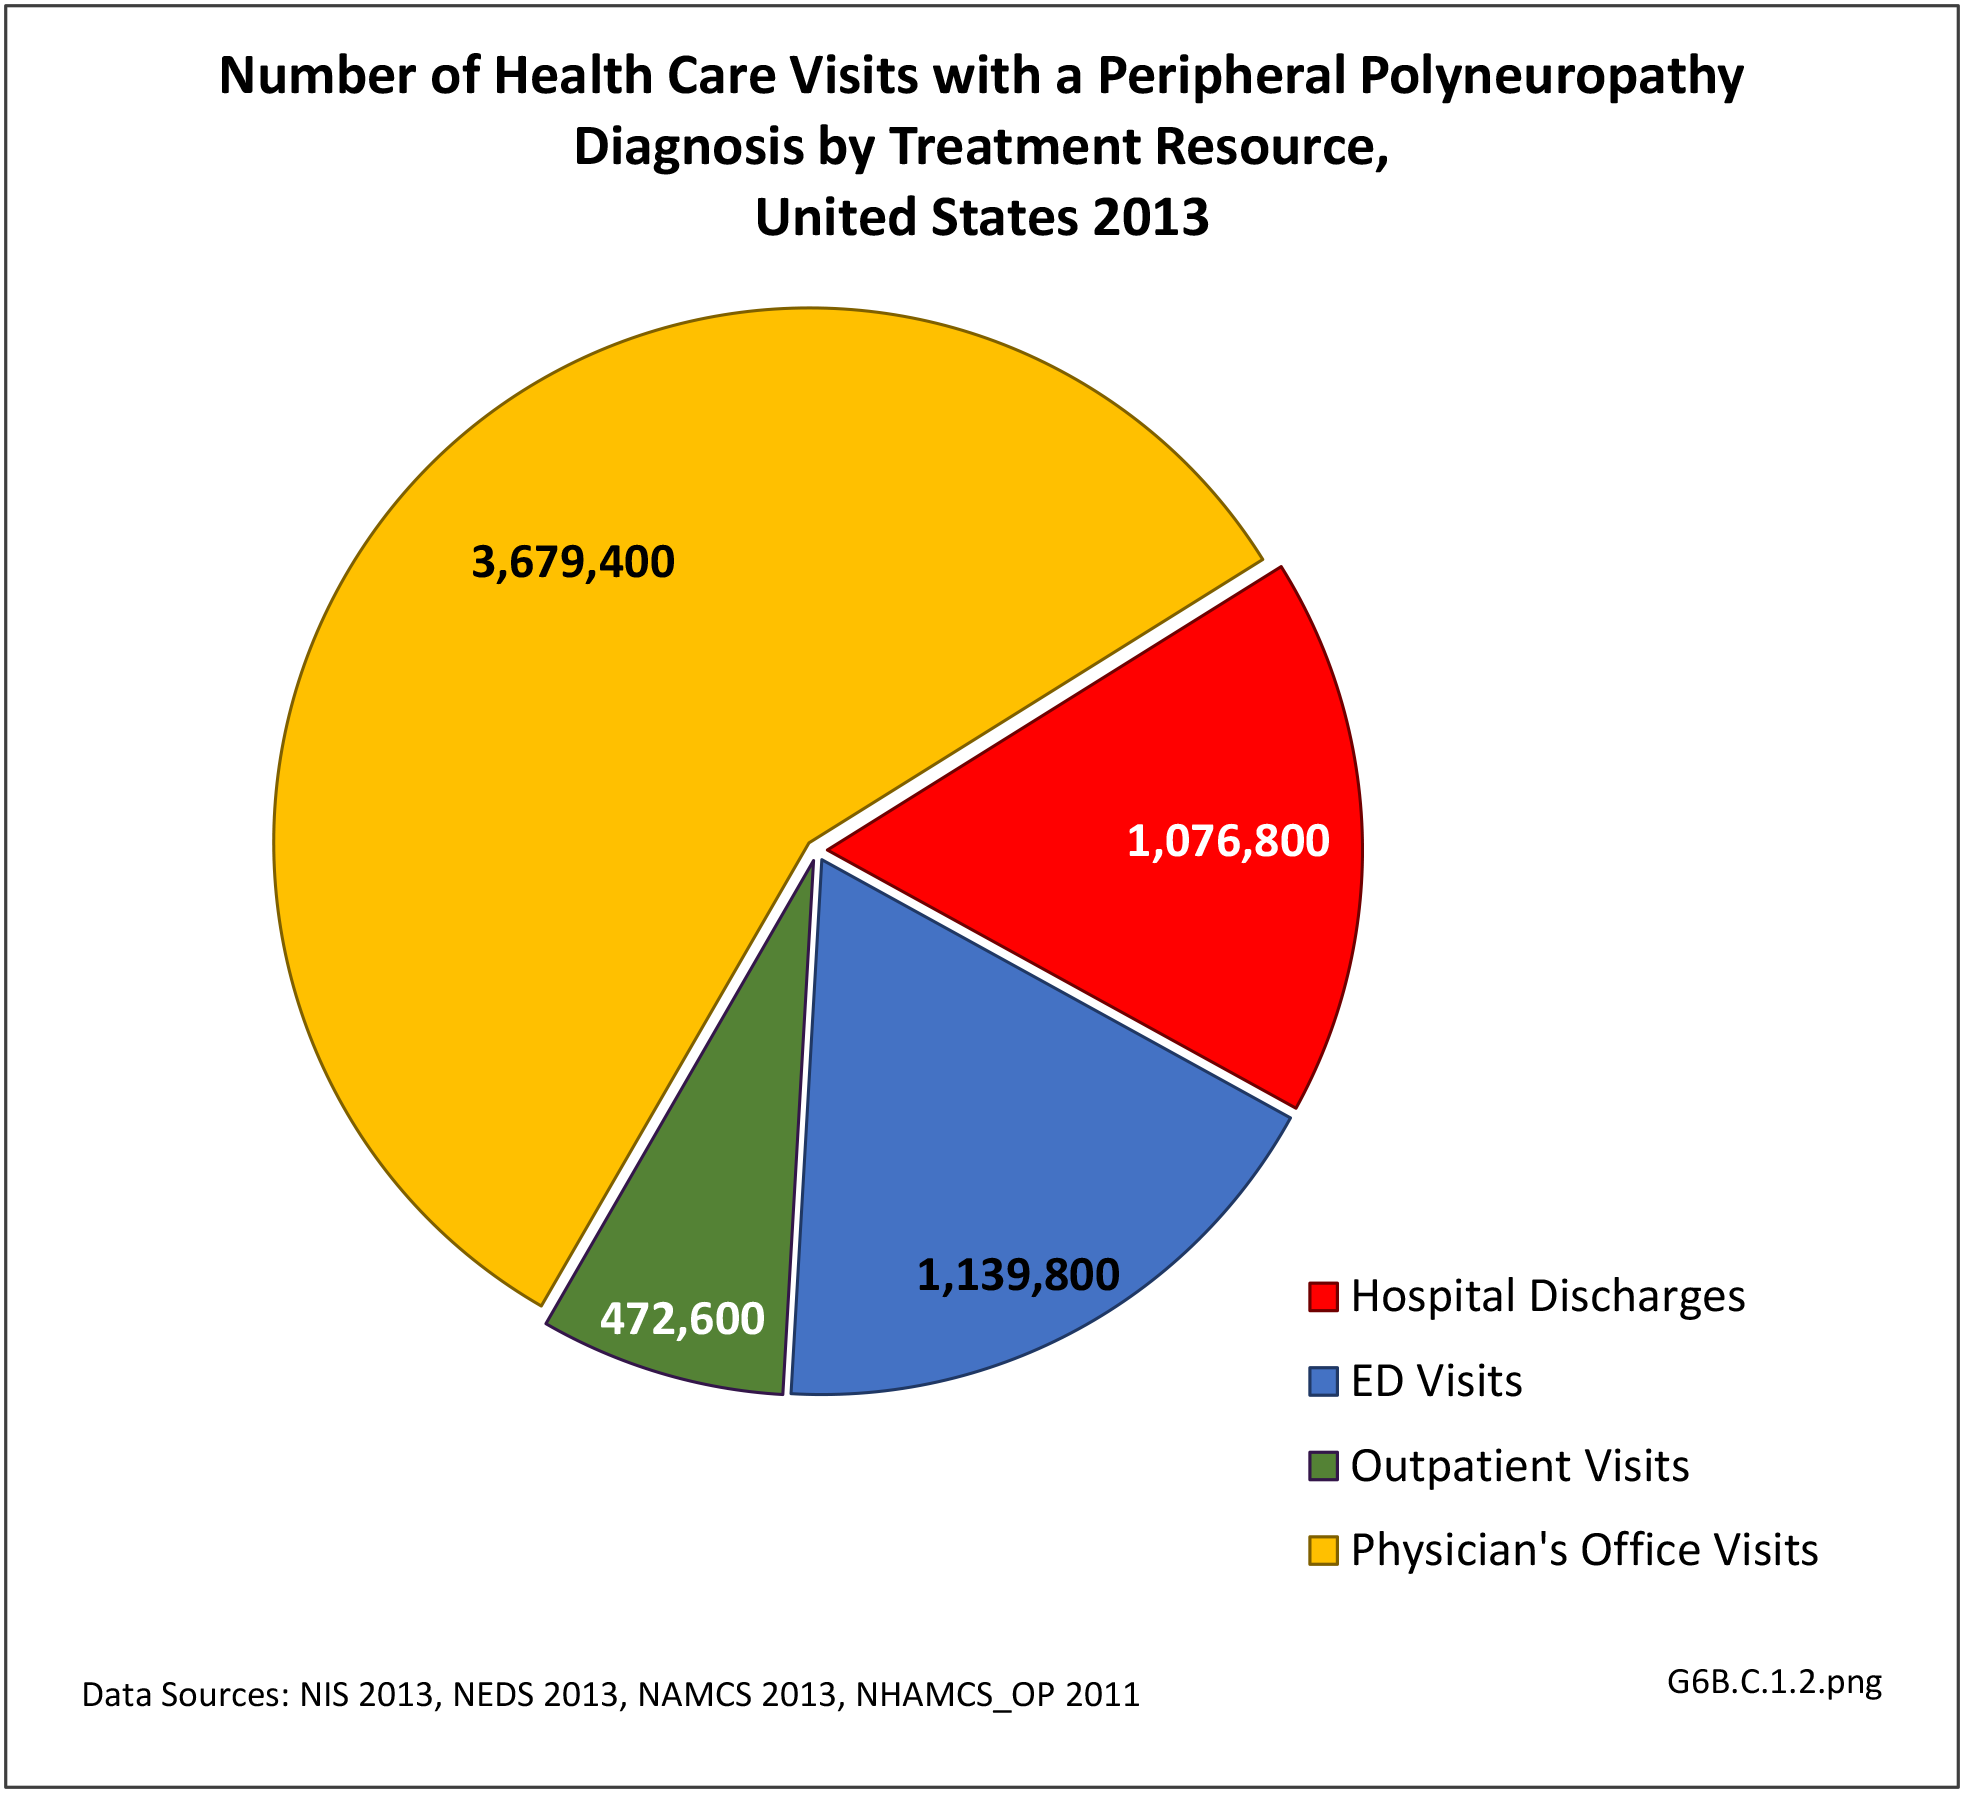 [1350]
 The prevalence of peripheral neuropathy increases with age1 and the underlying etiology is diferent among different age groups. In general, manifestations of peripheral neuropathy tend to be severe in the elderly. Diabetic peripheral neuropathy is a significant contributor to falls, fall-related injuries, and overall impaired mobility, compounding the normal decline seen with aging.2 It also impairs activities of daily living and quality of life in the elderly.3
Direct medical costs related to peripheral neuropathy includes costs for diagnostic procedures (EDx, blood, genetic tests, etc), prescription medications (especially for pain medication), rehabilitation costs (physical and occupational therapy and bracing), and costs for complications related to peripheral neuropathy like fractures, non-healing wounds, etc. According to a commercial claims database, there was a 46% increase in the annual cost per patient associated with visits to hospitals, emergency departments, doctors' offices and pharmacy claims after diabetic peripheral neuropathy was diagnosed. The greatest cost increase was associated with hospitalization.1
In 2013, mean hospital charges for discharges associated with peripheral neuropathy were $50,500 for an average stay of 5.8 days. Hospital charges, which totaled $54.4 billion, are not the actual cost due to differences in payment structures, plus the additional cost of professional fees and associated treatments noted above. In addition, nearly half (48%) of hospital discharges were discharged to additional care such as inpatient rehabilitation or skilled nursing facilities. Patients initially seen in an emergency department were, more often than not (61%), admitted to the hospital. (Reference Table 6B.2.1 PDF [1343] CSV [1344]and Table 6B.2.2 PDF [1345] CSV [1346])
Motor neuron diseases (MNDs) are a group of rare disorders affecting motor neurons (nerve cells) that transmit signals from the brain to the muscles in the body. They present with muscle weakness and wasting, resulting in impaired walking, fine motor skills, limitations in activities of daily living, swallowing, speech, and eventually breathing. Motor neuron diseases can be classified into acquired (non-inherited) or inherited. There are no direct tests to identify MNDs, with diagnosis often the result of ruling out other conditions that early symptoms can mimic. In addition, there is no cure or standard treatment for MNDs. Generally, treatment consists of addressing symptoms, compensating for impairments, and providing palliative and supportive care. Some MNDs stabilize for long periods of time, while some rapidly progress to death in a few years.
Amyotrophic lateral sclerosis (ALS), often known as Lou Gehrig’s disease, is the most common type of motor neuron disease. It is usually rapidly progressive, has an unclear cause, and lacks a definite cure. According to the ALS registry, prevalence is 4 to 5 per 100,000 people, affecting more than 13,000 people1 Prevalence has been increasing over time due to better identification of cases. It is a fatal condition with short life expectancy after diagnosis.
The diagnosis of MND is made from the physician's interpretation of symptoms, while using selective diagnostic tests to confirm the diagnosis and rule out other mimicking conditions like spinal stenosis, cervical myelopathy or peripheral neuropathy. Diagnostic tests may include an EDx evaluation, lumbar puncture and MRIs of the spine and occasionally the brain. As there is currently no definitive cure for motor neuron disease, supportive care and prevention of unnecessary complications is the mainstay of management. Supportive care includes physical, occupational and speech therapy, respiratory care, nutritional and psychological support. Interdisciplinary care in a specialized center has been shown to provide superior care with slightly better survival in patients with ALS.1 Care is provided primarily at outpatient clinics, however, patients with debilitating symptoms require hospital admissions that are often lengthy and costly.2 Palliative care is required at the advanced stages of ALS.
In 2013, 74,200 health care visits included a diagnosis of a motor neuron disorder. Because of the small number, the specific cause of the disorder could not be identified, and only hospital discharges and ED visits were of sufficient size to be included. An equal number of males and females were included, with the diagnosis more common among the aging population. Those 65 and over accounted for 60% of motor neuron disorder diagnoses, and ages 45 to 64 another 30%. Only hospital discharges were available by race/ethnicity, with non-Hispanic whites accounting for 74% of the diagnoses, compared to being 62% of the population. Geographic region in the US was not a major factor. (Reference Table T6B.1.1 PDF [1329] CSV [1330]; Table 6B.1.2 PDF [1331] CSV [1332]; Table 6B.1.3 PDF [1333] CSV; [1334] and Table 6B.1.4 PDF [1335] CSV [1336])
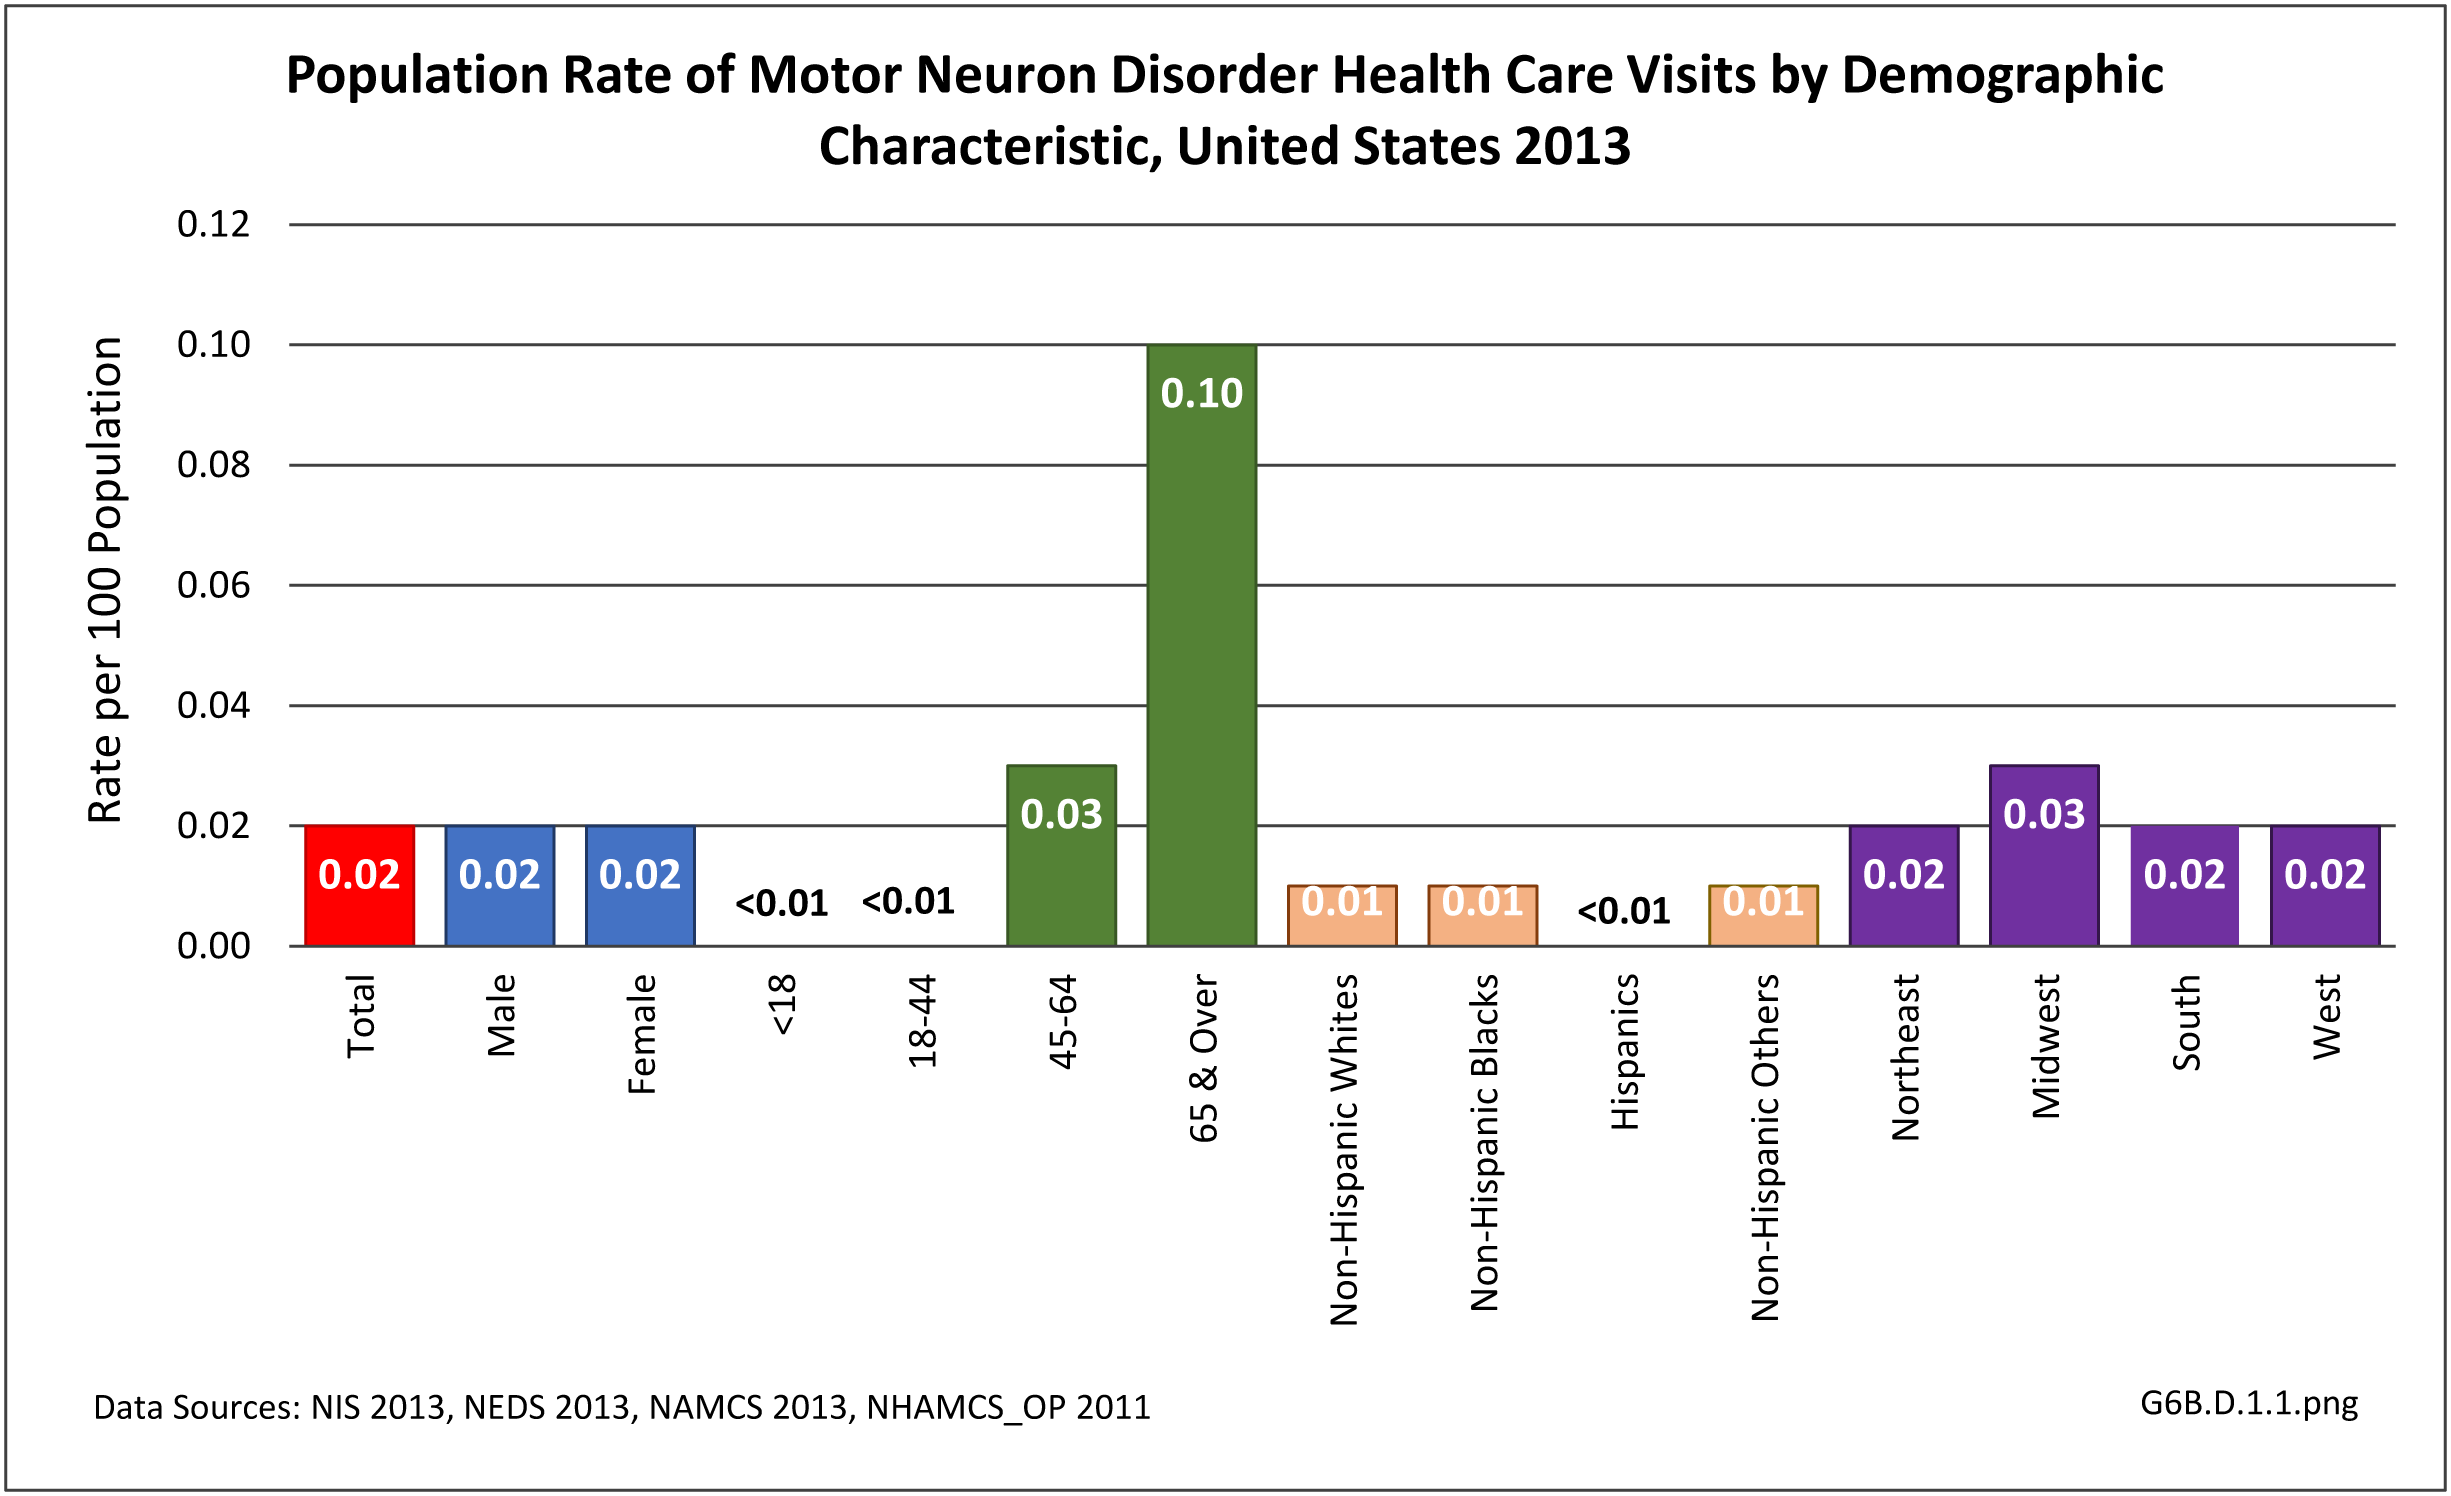 [1352]
 As previously noted, only discharges/visits from/to the hospital and emergency department had sufficient numbers to be analyzed; the two sites were evenly represented. (Reference Table 6B.1.5 PDF [1339] CSV [1340])
Incidence rates of ALS increase with age, peaking between 70 and 80 years. Amyotrophic lateral sclerosis is a fatal condition for most patients with mean life expectancy of about 3 years after diagnosis, although some patients live longer.
Poliomyelitis is a viral infection affecting the nervous system which causes motor neuron disease. Although it has been eradicated by vaccines developed in the 1950's, polio survivors can suffer from post-polio syndrome for several decades (mean of 36 years) with gradual weakness, fatigue and muscle wasting. A study published in 1994-1995 estimated there were about 1 million polio survivors in the U.S., with 443,000 reported having had paralytic polio. Considering 25 to 40 percent of polio survivors develop the post-polio syndrome, it is one of most prevalent motor neuron disease in the elderly population.1
It is difficult to estimate the economic costs related to motor neuron disorders due to their mixed presentation. However, due to the seriousness of these conditions, and the need for a broad range of treatments and supportive care, the burden of MNDs is significant compared to their prevalence. Nearly two-thirds (58%) of hospital discharges with a diagnosis of MND were discharged to additional care. Mean hospital charges for an average stay of 6.1 days were $55,000 (Reference Table 6B.2.1 PDF [1343] CSV [1344] and Table 6B.2.2 PDF [1345] CSV [1346])
Myopathies are a group of primary muscle disorders causing muscle weakness, occasionally stiffness, and rarely muscle pain. They can be classified into inherited or acquired myopathy. Acquired myopathy can be further divided into idiopathic (cause unknown), infectious, metabolic, inflammatory, endocrine, and drug induced based on the etiology. Depending on the involvement, the patient can present with difficulty with mobility, including difficulty with rising from a chair, stair negotiation, or walking, and impaired activities of daily living, such as dressing and personal care due to difficulty raising the arms. Sensation is not primarily affected although the pain is not uncommon.
Inherited Myopathy
Inherited myopathy has a genetic basis and is passed from parent to child. The muscular dystrophies are the most well-known form of inherited myopathy, with progressive weakness and degeneration of the muscles controlling movement. Duchenne muscular dystrophy is the most common form of muscular dystrophy, primarily affecting 1 boy in 3,300, and is caused by absence of dystrophin, a protein in the muscle cell membrane. Other muscular dystrophies include Becker muscular dystrophy, which is less severe than Duchenne MD; fascioscapulohumeral muscular dystrophy (FSH, FSHD), in which the muscles of the face, shoulder blades, and upper arms are most affected; and myotonic muscular dystrophy, characterized by progressive muscle wasting and weakness with prolonged muscle contractions (myotonia) and inability to relax certain muscles after use.
Acquired Myopathy
Inflammatory myopathy, the most common acquired myopathy, includes a group of myopathies with chronic muscle inflammation marked by weakness and, occasionally, muscle pain. It is reported to occur in 8.9 in 1,000,000 persons, with prevalence gradually increasing over the time due to improved diagnostic techniques.1 Other forms of acquired myopathy can be secondary to infection, drugs ortoxins, or systemic (typically endocrine) disorders. Polymyositis, dermatomyositis, and inclusion body myositis are the common inflammatory myopathies.
Neuromuscular Junction Disorders
Myathenia gravis is a disorder affecting neuromuscular junctions, the contact points between the muscles and nerves. It presents with fatigue, fluctuating weakness, typically affecting the muscles that control eye and eyelid movement, chewing, and talking, resulting in drooping of the eyelid (ptosis), difficulty swallowing (dysphagia) or speaking (dysarthria).
Patients with myopathy are likely to utilize ambulatory visits, specialist visits, and hospitalization more often than those without myopathy, according to a study of the patients with inflammatory myopathy in a large managed care system.1 Diagnostic tests, including EDx, blood and genetic testing and muscle biopsy, are often utilized to confirm clinical suspicions from history and physical examination, and to delineate the exact type and underlying etiology of myopathy. As cure is limited in most myopathies, treatment focuses on the supportive and symptomatic treatment. In the initial stages and/or milder forms of myopathy, treatment is usually at an outpatient clinic for physical, occupational, and speech therapy, and bracing if needed. In progressive and disabling myopathies, hospitalization is required to manage the secondary problems related to the myopathies such as respiratory failure.
There were 792,700 health care visits made in 2013 with a diagnosis of myopathy or neuromuscular junction disorder. As with some other neuromuscular conditions, the overall number of visits to outpatient clinics and physician’s offices were too small to include in demographic analysis, and affect rates of incidence by demographic characteristics except for males and persons age 44-65 visits to outpatient clinics. Gender and geographic region are not factors, but as with other neuromuscular conditions, the condition increases with age. Racial differences are difficult to determine due to small sample sizes and unreliable data. (Reference Table T6B.1.1 PDF [1329] CSV [1330]; Table 6B.1.2 PDF [1331] CSV [1332]; Table 6B.1.3 PDF [1333] CSV [1334]; and Table 6B.1.4 PDF [1335] CSV [1336])
 [1356]
 More than half (56%) of 792,700 2013 health care visits with a diagnosis of myopathy or neuromuscular junction disorder were to a physician’s office; however, data was not reliable at the level of sub-category conditions. The remainder of visits were spread between hospital discharges (13%), ED visits (13%), and outpatient clinics (18%). Acquired myopathy was the most common diagnosis with a hospital discharge, while neuromuscular junction disorder was most common in the ED.most common in the ED. (Reference Table 6B.1.5 PDF [1339] CSV [1340])
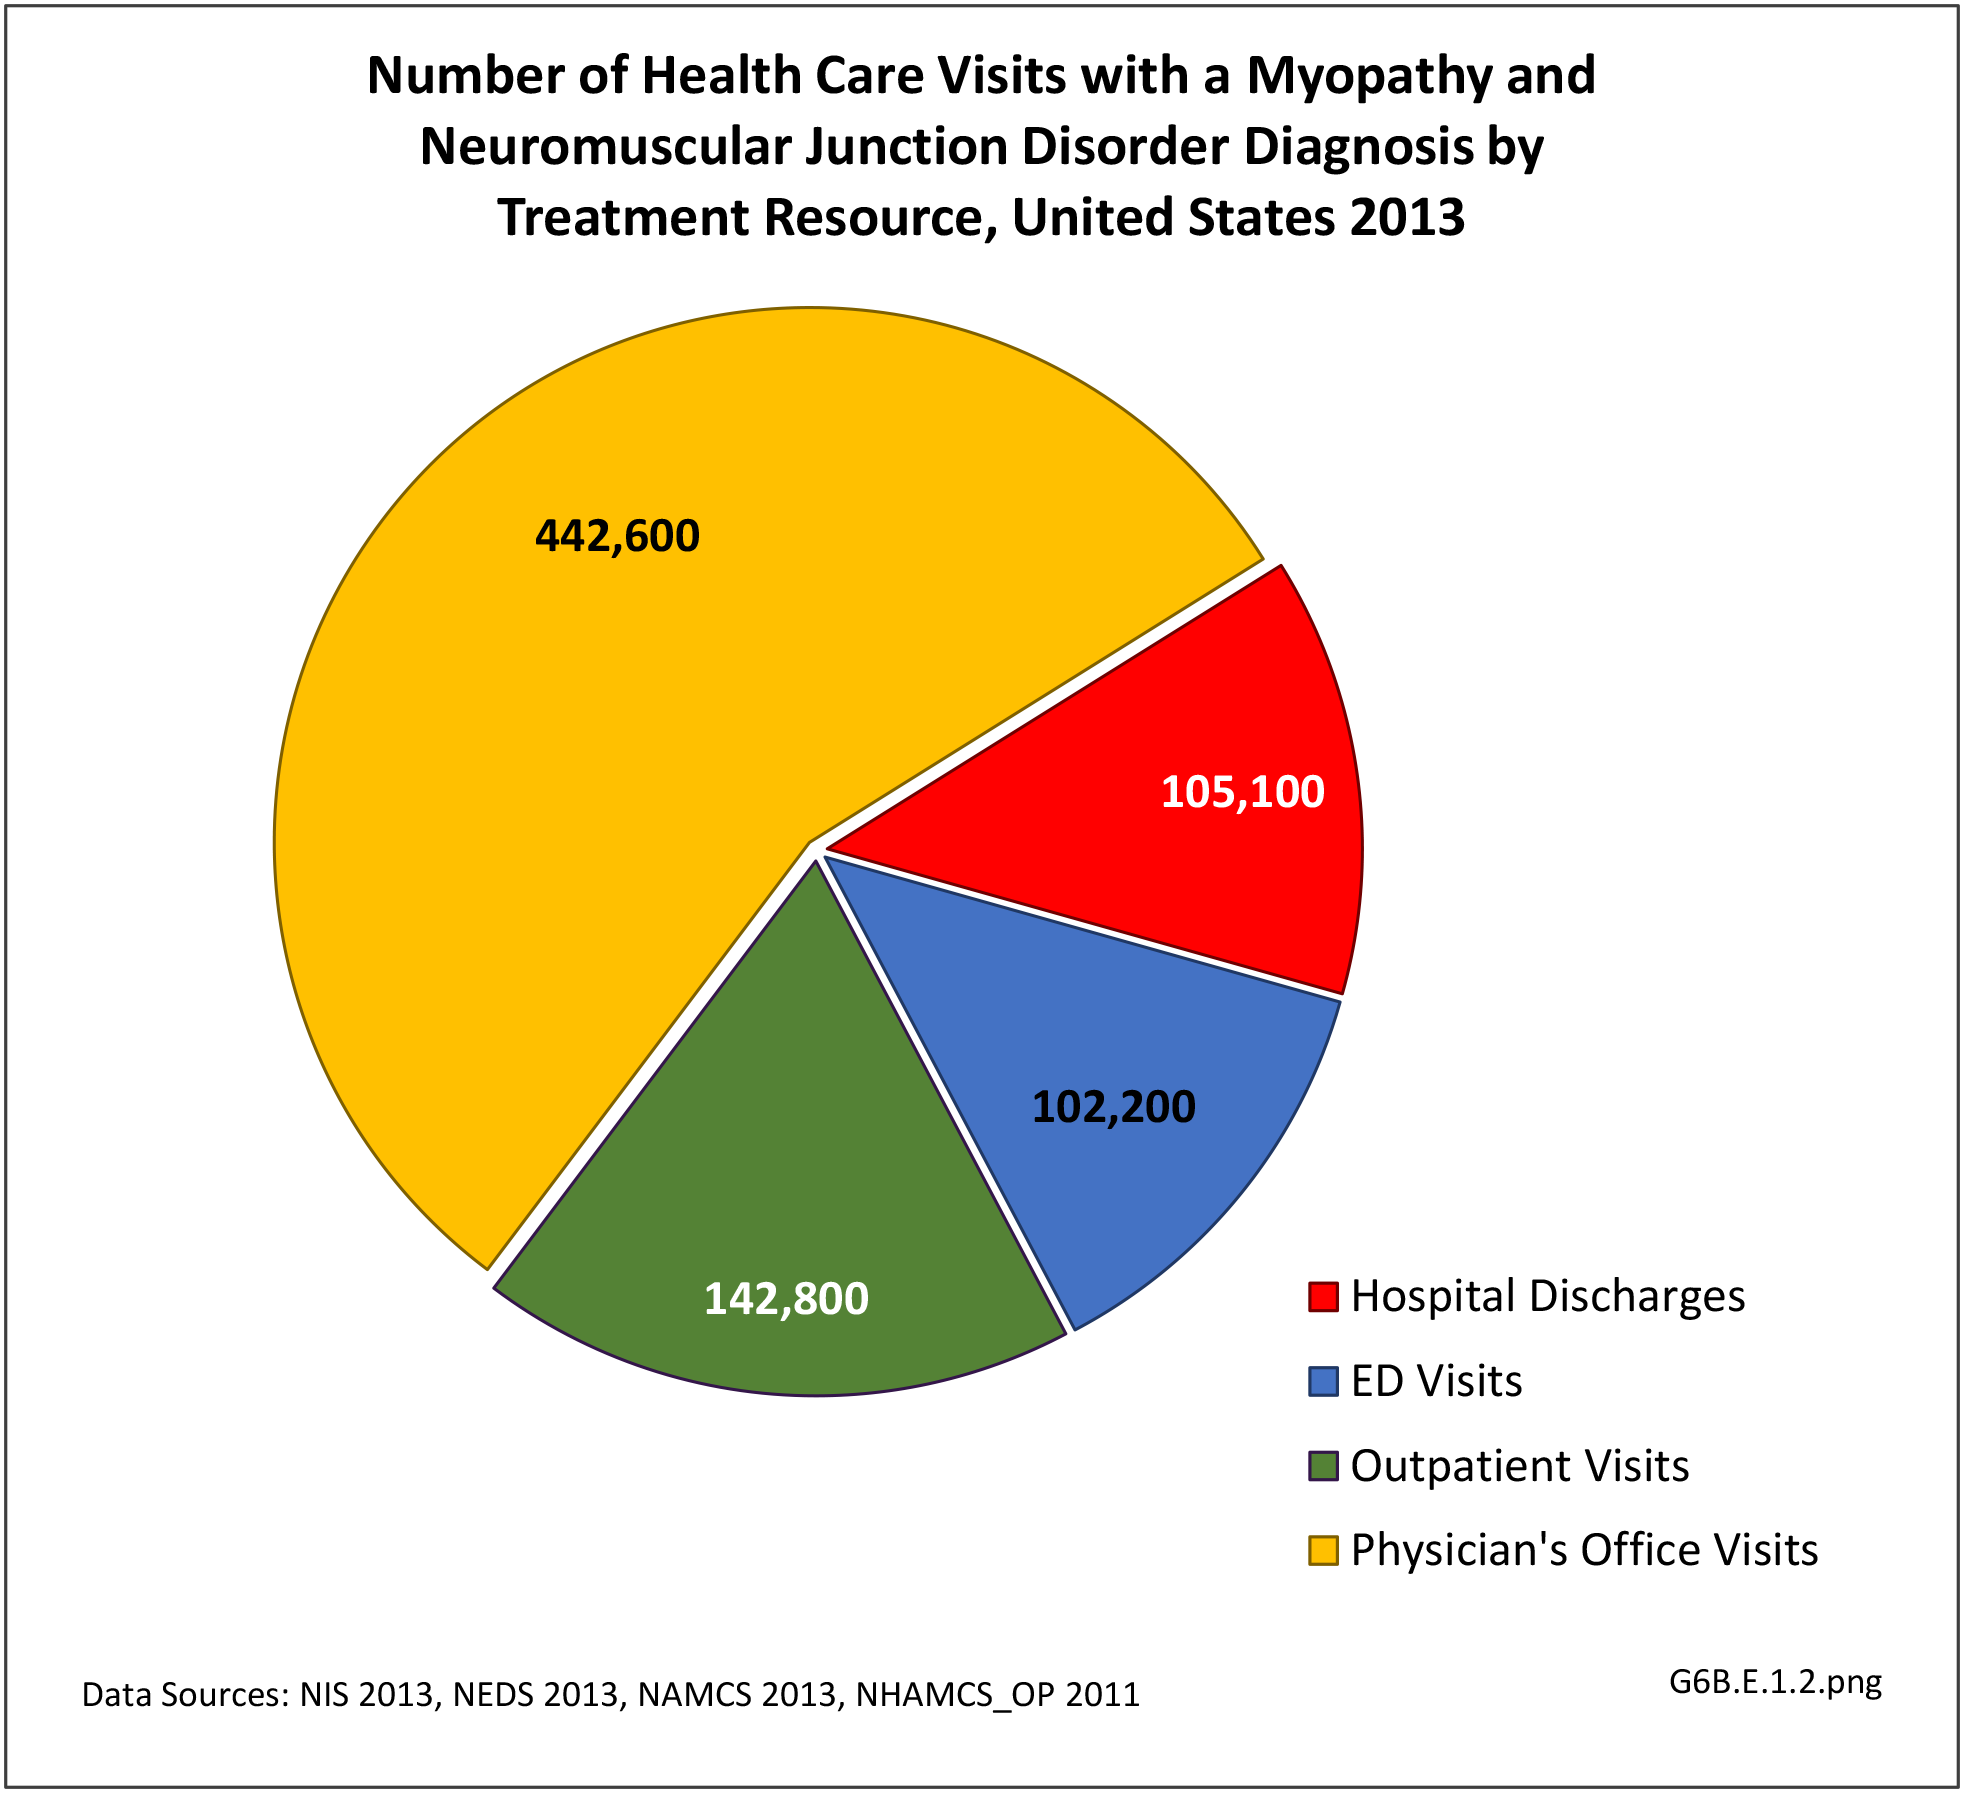 [1358]
 Some myopathies are more common in the elderly, such as inclusion body myositis and myopathy secondary to cholesterol lowering medication (statin myopathy).
Patients with myopathies survive longer with better care and the increasingly recognized negative impact of aging on physical function and quality of life. In addition to age associated loss of muscle mass and strength (sarcopenia), muscle weakness and fatigue from myopathy can limit independence due to mobility and ADL issues.1
Studies of health care costs and resource utilization in patients with inflammatory myopathy in managed health care revealed annual medical costs were higher among newly diagnosed patients and those with existing inflammatory myopathy compared to unaffected controls.1
The direct annual medical cost of Duchene's muscular dystrophy (MD) ranges from $20,000 to over $50,000 depending on the study methodology. Medical costs include direct cost related to the myopathy and secondary problems including cardiac, respiratory, nutritional and spine complications. Medical costs related to MD and its secondary problems both increase over time.2
Mean hospital charges in 2013 for the diagnosis of myopathy was $81,800 for a mean stay of 8.9 days. This was the longest stay and highest mean charges of all neuromuscular disease categories. (Reference Table 6B.2.1 PDF [1343] CSV [1344] and Table 6B.2.2 PDF [1345] CSV [1346])
Spinal cord injury (SCI) is damage to the spinal cord, the bundle of nerves running from the base of the brain (brainstem) to the upper part of the lumbar spine. SCI disrupts communication between the brain and the rest of the body below the level of the injury, and depending on the severity resulting in the inability to move limbs, loss of sensation, bowel and bladder function. Depending on the underlying mechanism of injury, SCI can be divided into traumatic and non-traumatic causes. It can be further classified by the level of injury: tetraplegia involving all four limbs or paraplegia involving legs only; and the severity of injury: complete vs incomplete, with incomplete tetraplegia being most common.
Traumatic Spinal Cord Injury
Significant trauma to the vertebral column encasing the spinal cord can result in spinal cord injury. In a person with a vulnerable bony spine, for example someone with osteoporosis or ankylosing spondylitis, weakness in the supporting structure, such as with rheumatoid arthritis or Down's syndrome, or narrowing of the spinal canal due to spinal stenosis, a minor trauma or injury can result in spinal cord injury. The common underlying cause of injuries include motor vehicle accidents, followed by falls, violence such as gunshot wounds or assault, sports injuries, and industrial accidents. The A [1359]merican Spinal Injury Association (ASIA) scoring system [1360] is widely utilized by healthcare providers for further classification of SCI based on the injury level and severity.
Non-traumatic spinal cord injury
Spinal cord injury also can be secondary to multiple sclerosis (MS), inflammatory conditions, compression by bony spurs or herniated discs, and metastatic cancer, all disrupting spinal cord function. MS is a central nervous system (brain and spinal cord) disorder that damages the myelin sheath surrounding the nerve cells and fibers, and can presents with symptoms of spinal cord dysfunction, as well as disruption of vision, speech or cognitive function. A condition known as transverse myelitis is an inflammation across both sides of one level, or segment, of the spinal cord resulting in temporary or permanent symptoms that include paralysis and loss of sensation, bowel and bladder control. The segment of the spinal cord where the damage occurs determines the parts of the body affected, much like with a traumatic SCI.
SCI is a life changing event affecting a younger population (average age at injury: 42 years old) and it is a cause of major disability. Annual incidence of spinal cord injury is approximately 54 cases per million in the US, with approximately 17,000 new cases of SCI each year. The prevalence is estimated to be 282,000 persons alive with a SCI in 2016.1 Patients are initially admitted to acute care units of hospitals for stabilization for an average length of stay of 11 days followed by inpatient rehabilitation with an average 35 day length of stay.1,2 As cure is limited in most cases of SCI, patients require continuous outpatient care including intermittent physical, occupational and speech therapy, pain management, and prevention of complications directly or indirectly related to SCI including deep vein thrombosis, pressure ulcers, pneumonia and urinary tract infections.
Males account for approximately 80% of new SCI cases each year, with nearly 1 in 4 (22%) injuries occurring to non-Hispanic blacks since 2010, nearly twice the proportion of non-Hispanic blacks in the general population (12%).2
Analysis by demographic variables is limited by data size for outpatient clinic and physician’s office visits. However, as previously noted, males have a higher rate of SCI health care visits, and age is clearly a factor beginning in middle age around 45. Geographic region does not appear to be a factor. Race/ethnicity is unclear due to missing data cells. However, with a rate of 0.30 per 100 persons compared to 0.25 for all races, SCI health care visits appear to be greater among non-Hispanic whites than in other races/ethnicities. (Reference Table T6B.1.1 PDF [1329] CSV; [1330] Table 6B.1.2 PDF [1331] CSV [1332]; Table 6B.1.3 PDF [1333] CSV; [1334] and Table 6B.1.4 PDF [1335] CSV [1336])
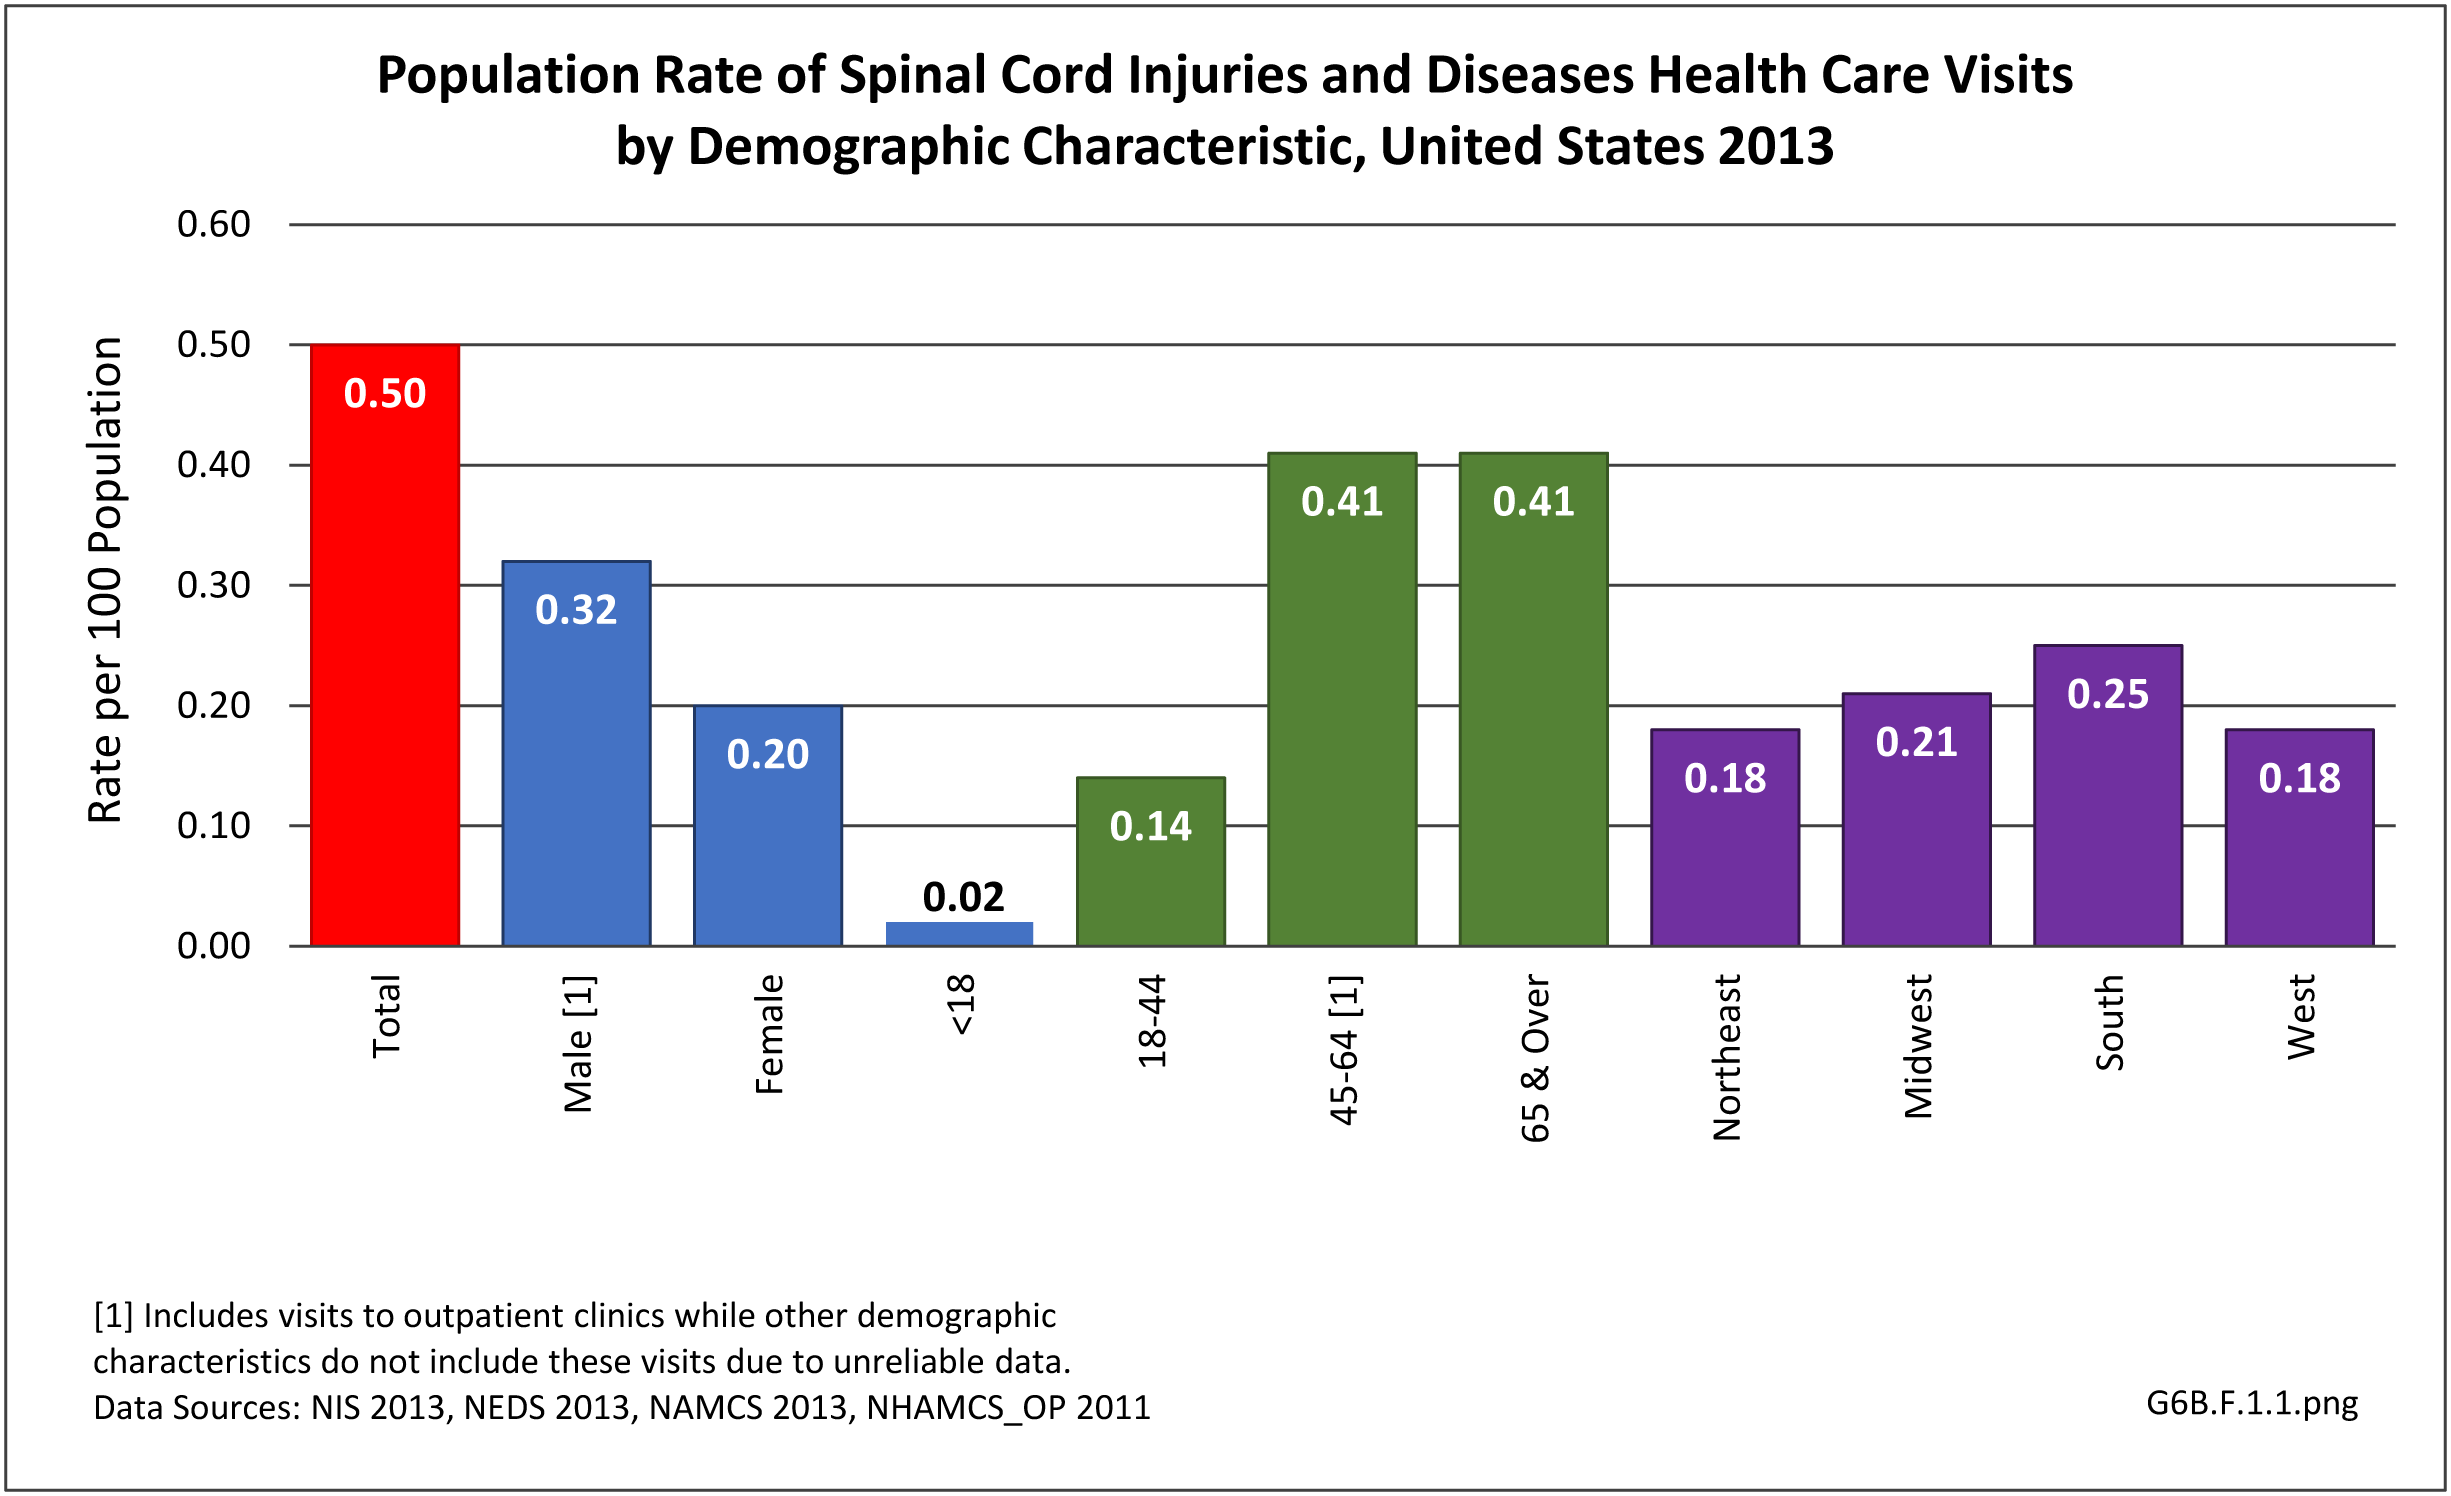 [1362]
 In 2013, spinal cord injury or disease was diagnosed in 1.56 million health care visits, representing 1 person in every 200 in the US. However, it is likely more than one visit per person would reduce this ratio. Visits to outpatient clinics and physician’s offices generally do not meet standards of reliability, but for hospital discharges and emergency department visits with a diagnosis of spinal cord injuries and diseases, a diagnosis of ‘other paralytic syndromes’ account for 75% of visits. Nearly half (47%) of visits are to physician’s offices, while 1 in 5 (20%) involves hospitalization. (Reference Table 6B.1.5 PDF [1339] CSV [1340])
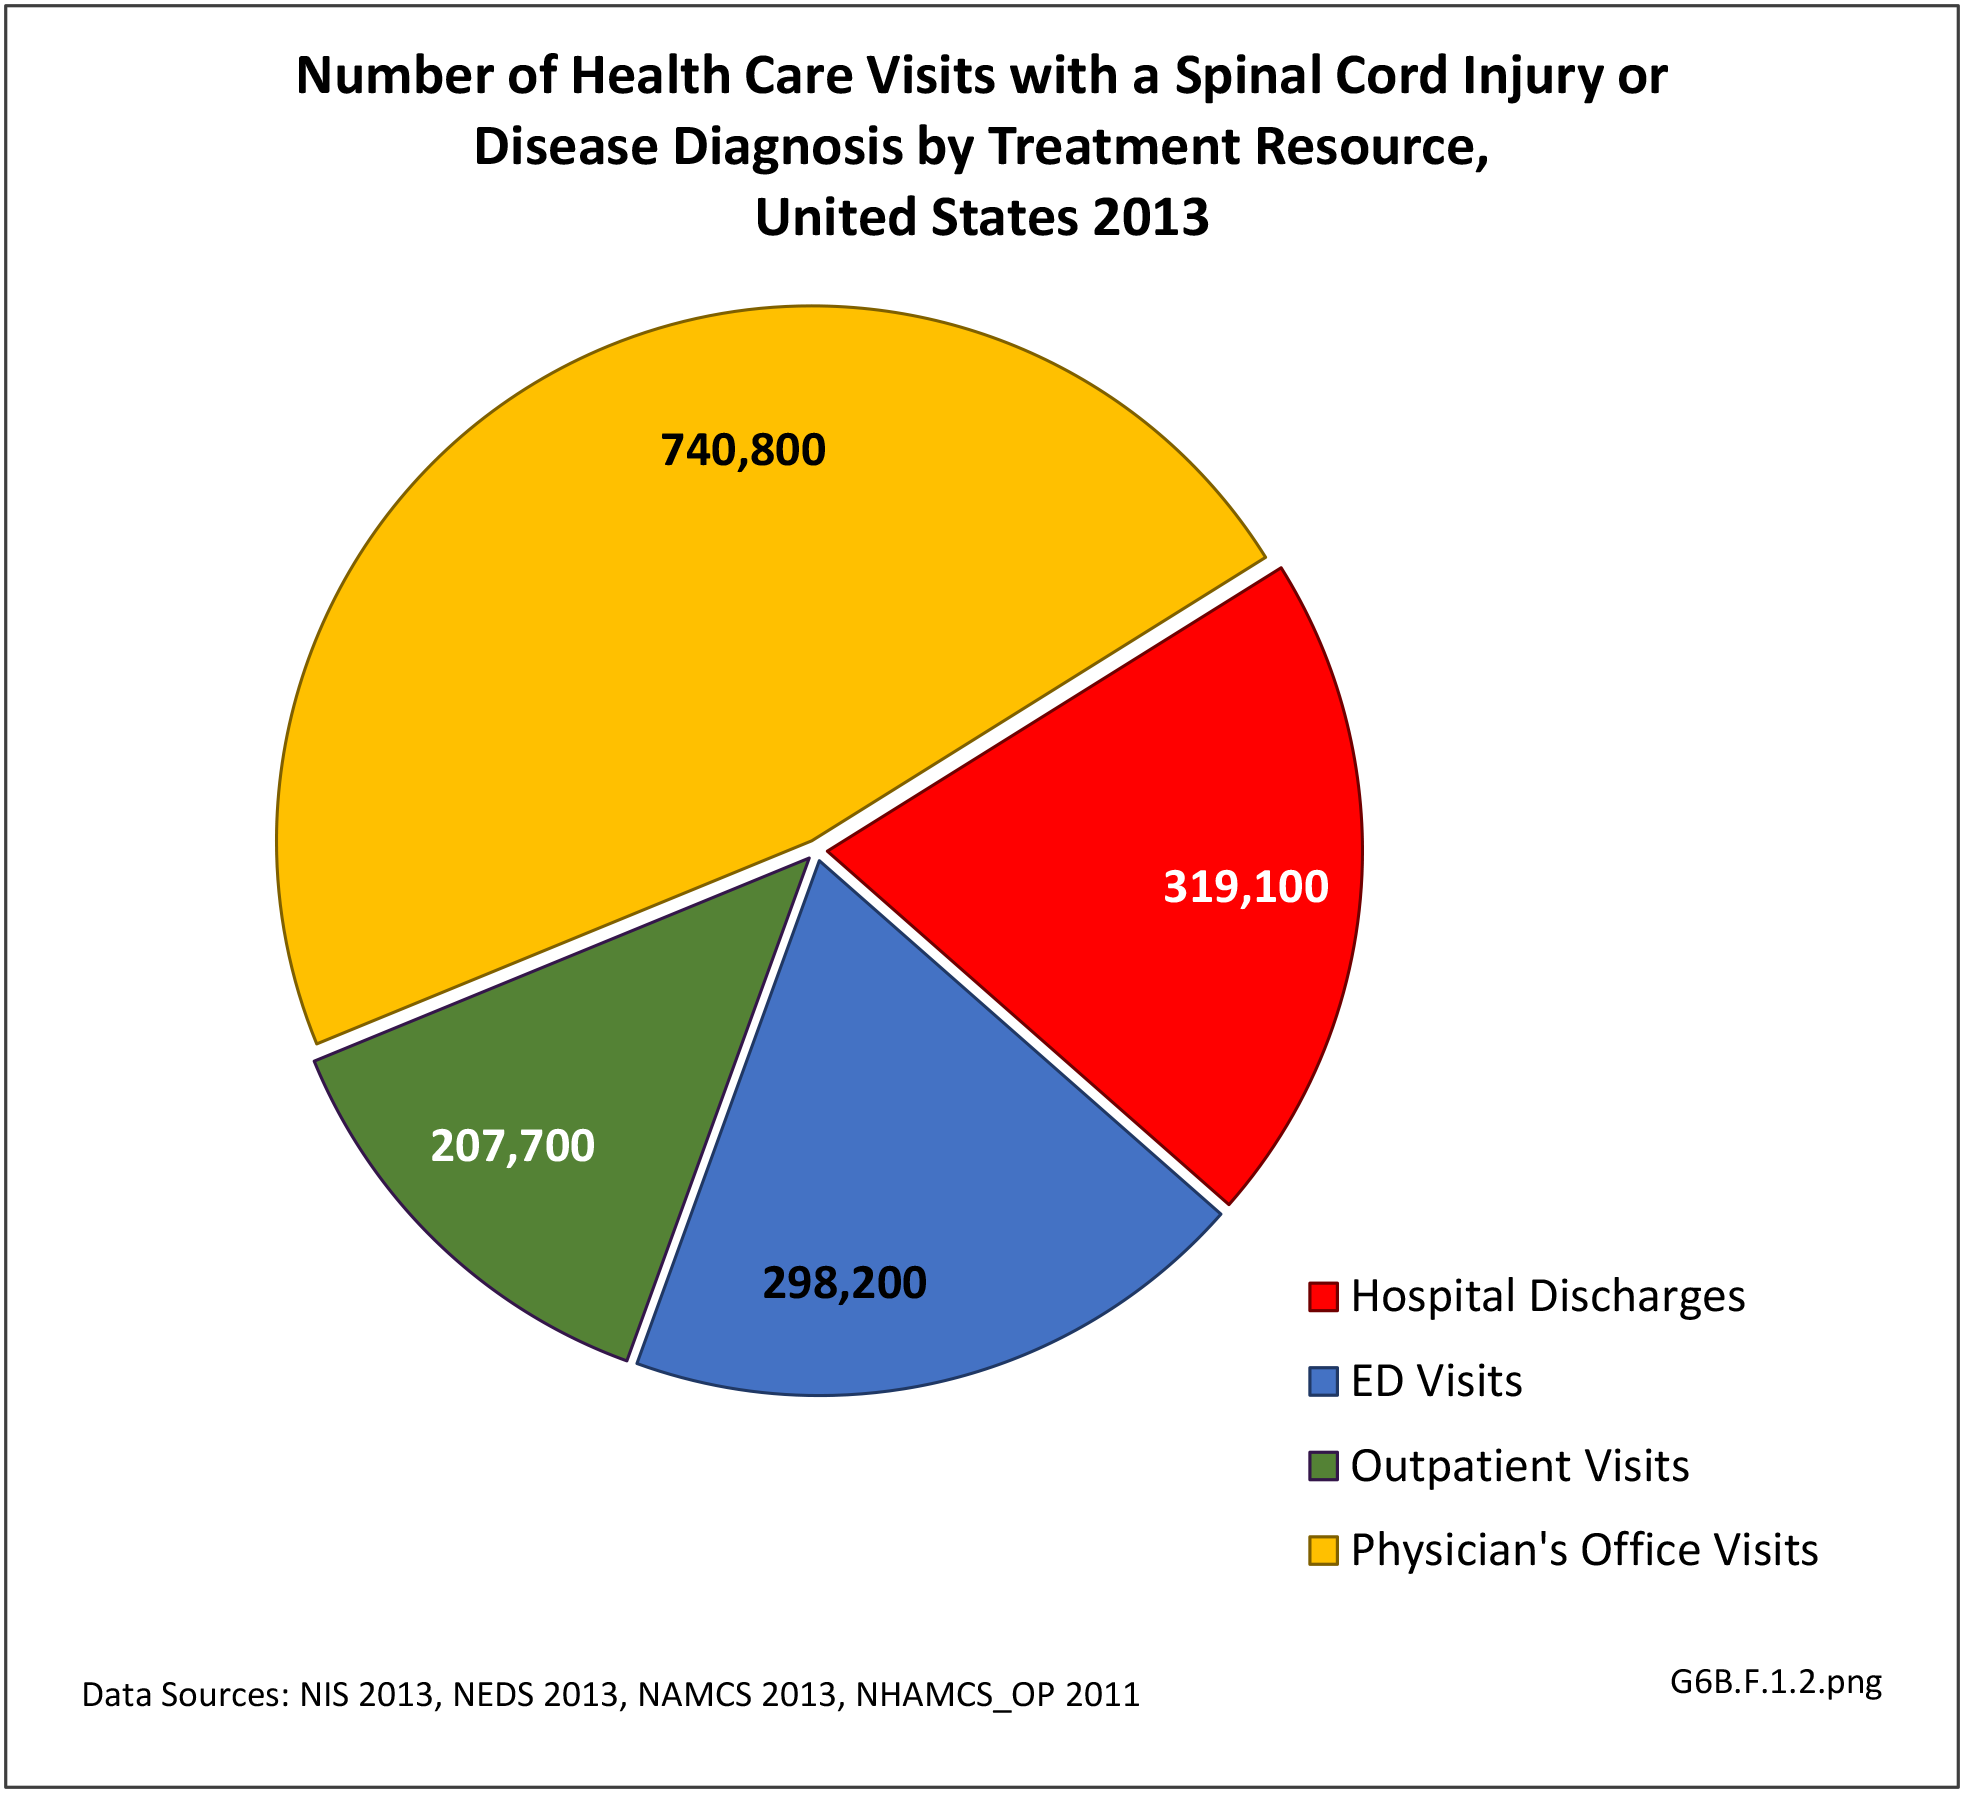 [1364]
The mean age at the time of spinal cord injury increased from 29 years in the 1970s to 42 years in 2016.1 Non-traumatic spinal cord injuries are increasing, in part, due to the aging of the population and the concurrent age-related health conditions with a greater likelihood of minor events causing a SCI, like falls in an arthritic or stenotic spine. There is a possibility non-traumatic SCI will surpass the incidence of traumatic SCI in the future.2 The lifespan for SCI survivors has not changed since the 1980’s, and remains significantly shorter than for healthy counterparts. In 2016, for persons who survived the first 24-hours post injury, life expectancy for a 20-year old with the lowest level SCI is 52.6 years and for a 20-year old with a high tetraplegia 35.7 years. Comparable life expectancy for a 60-year old at time of injury is 17.9 years for a low level injury and 8.1 years for a high level tetraplegia, respectively.1 SCI survivors report more health problems, with significant impacts on physical function and quality of life posing greater challenges in aging SCI survivors.3
Mean hospital charges in 2013 for hospital stays with a diagnosis of spinal cord injury or disease were $80,700, with a mean stay of just over 8 days. Total hospital charges in 2013 were $25.7 million. Due to the severity of spinal cord injuries and diseases, this is only a small part of overall health care costs that usually last a lifetime. (Reference Table 6B.2.1 PDF [1343] CSV [1344]and Table 6B.2.2 PDF [1345] CSV [1346])
The average expense for the first year of injury in 2015 dollars, including health care costs and living expenses, ranges from $347,900 for the lowest level of injury to $1.1 million for a high tetraplegia. Average yearly expenses for each subsequent year of survival range from $42,300 to $185,100. These costs do not include indirect costs such as lost wages, fringe benefits, and productivity, which were estimated to be over $72,000 per year.1 In addition, there is significant economic and emotional burden to spouses and other family members.
The overall burden of all neuromuscular conditions is difficult to assess due to the life-long care usually required following onset of the disease. However, comparison of the 1.9 million hospital discharges and 2.4 million emergency department visits for all health conditions provides some sense of the magnitude of burden.
Neuromuscular conditions were 5% of all hospital discharges and 2% of all emergency department visits in 2013. Discharge from the hospital to another form of care (short/intermediate/nursing home facility or home health care) occurred in 47% of discharges with a neuromuscular diagnosis, compared to 27% of discharges for all health care reasons. Among ED visits, 46% were admitted to the hospital when there was a neuromuscular diagnosis, compared to 14% for all health care reasons. Thus, it can be seen than neuromuscular conditions have a much higher level of long-term care than health conditions overall. (Reference Table 6B.2.1 PDF [1343] CSV [1344])
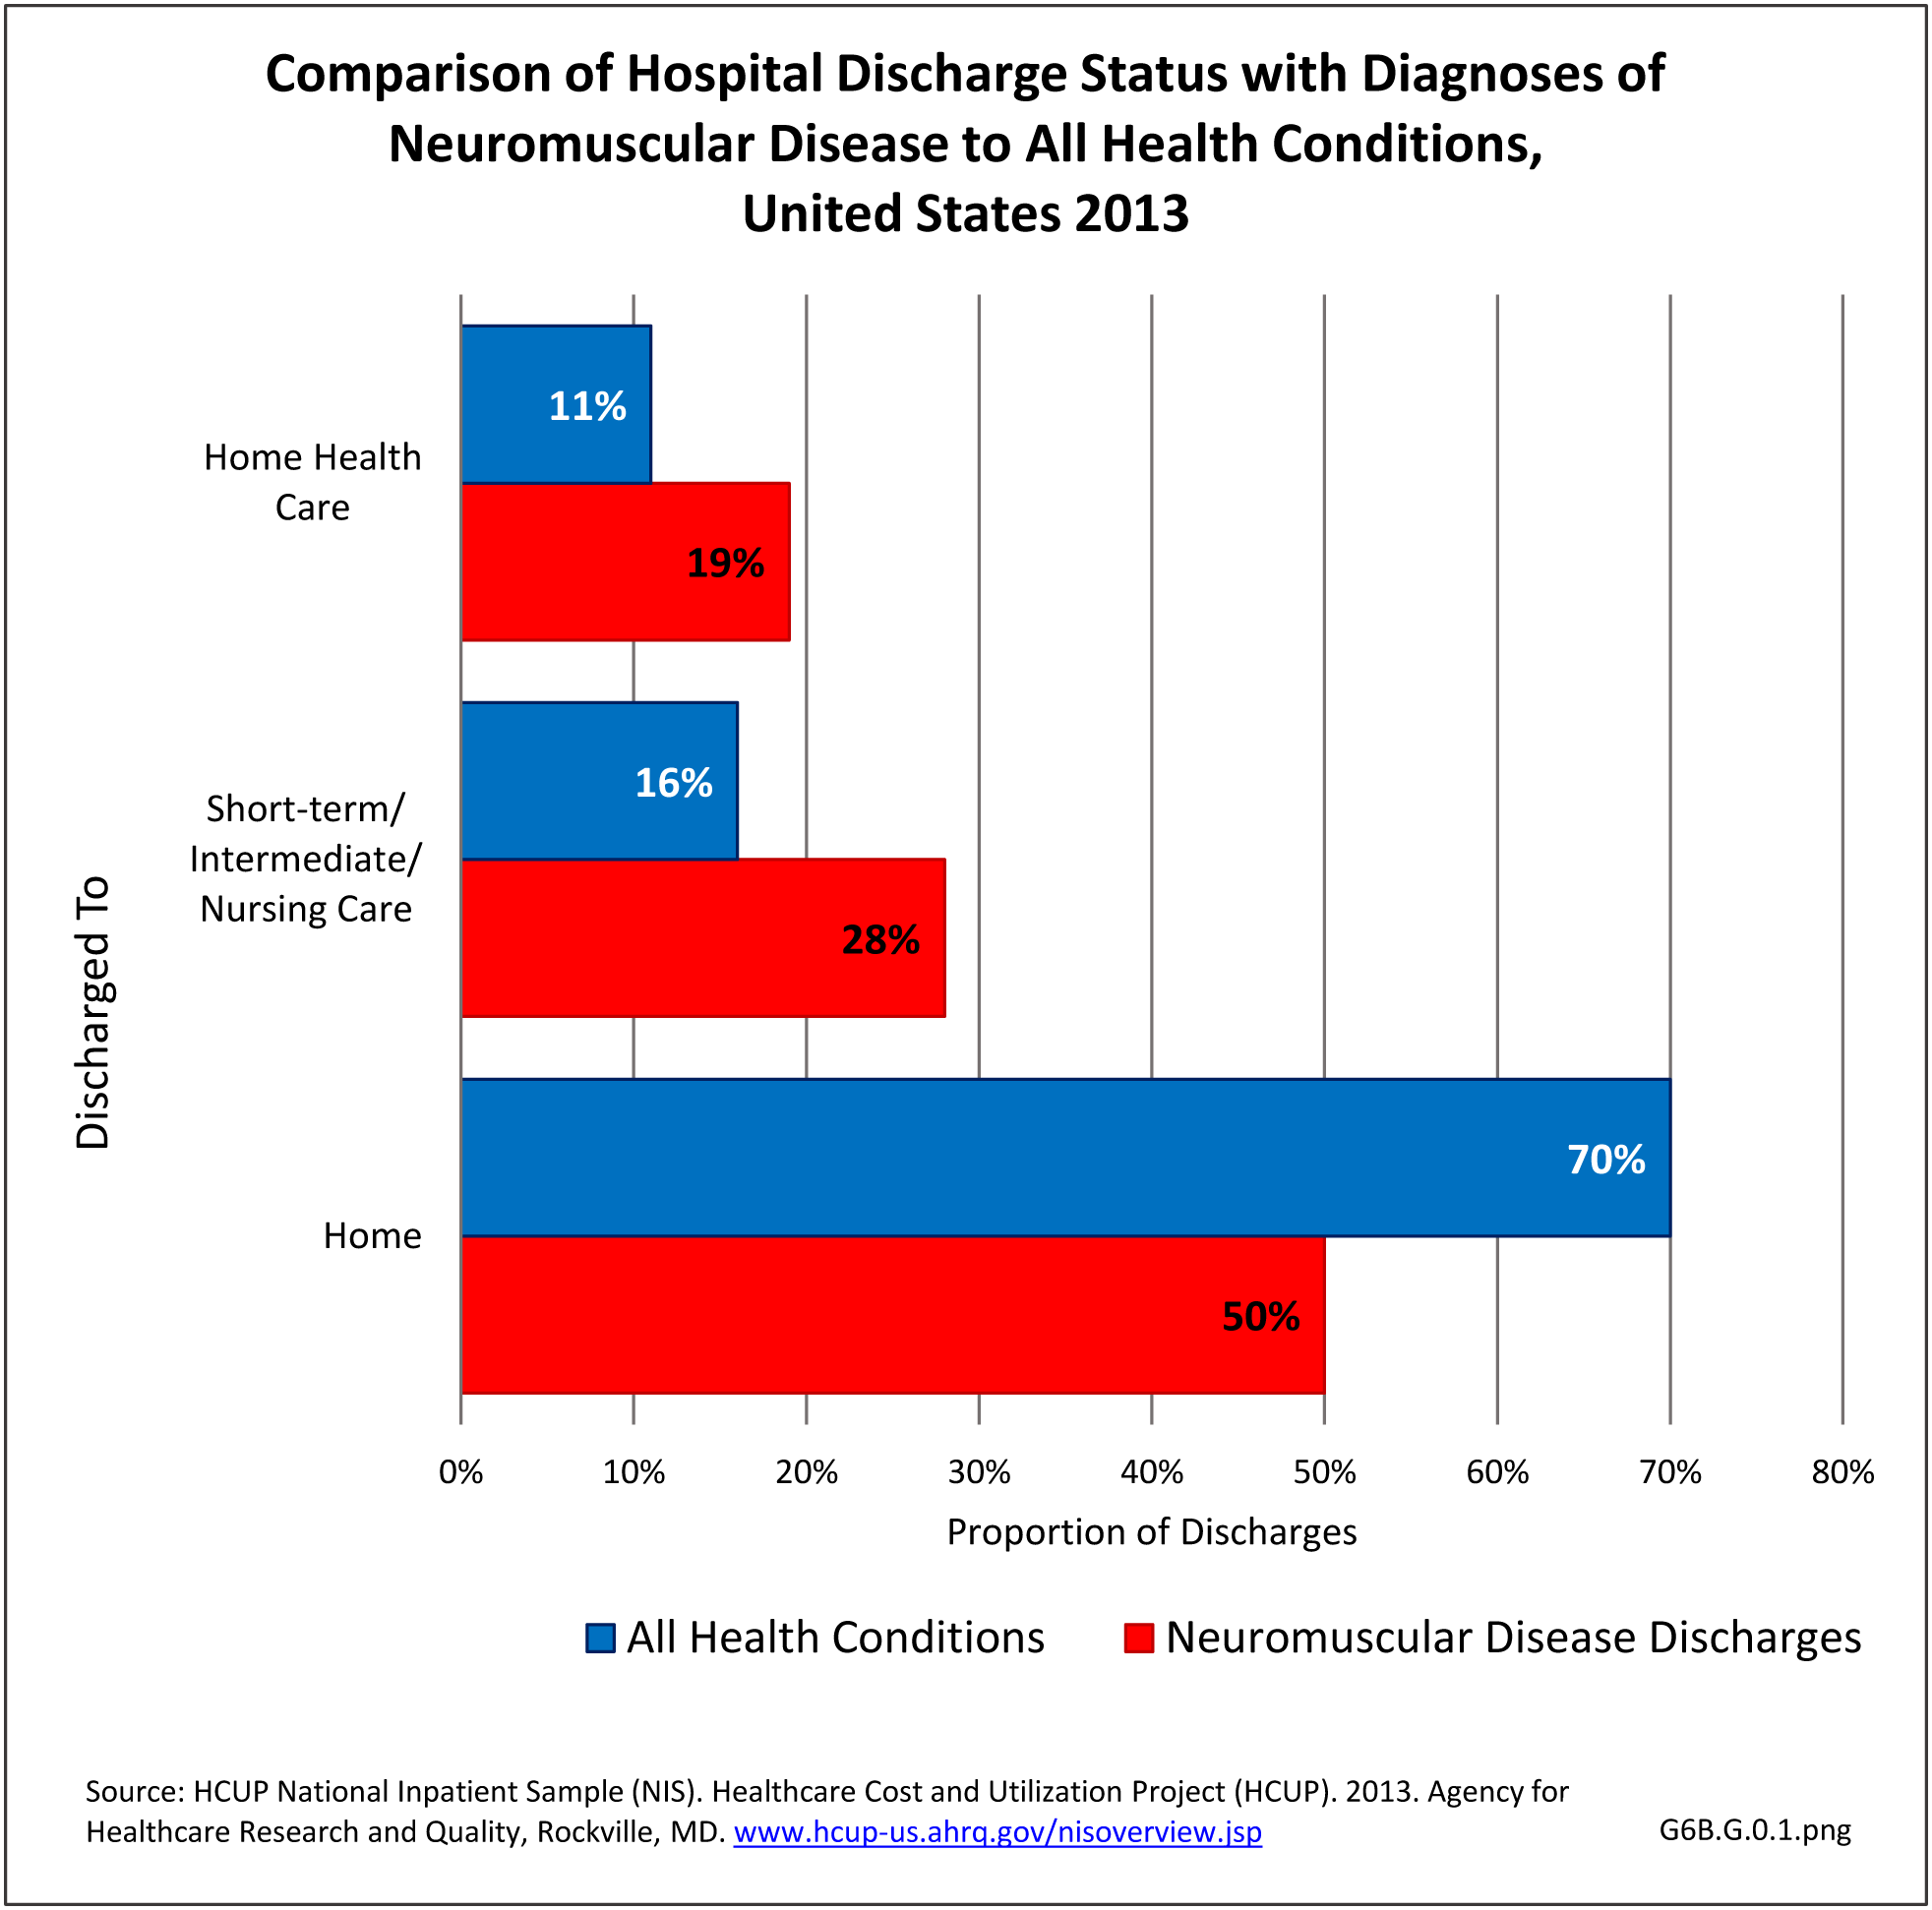 [1367]
 Mean hospital charges in 2013 for all discharges with a neuromuscular disease diagnosis were $59,100, 38% greater than mean charge for discharges with any health condition. Mean length of stay for persons with a neuromuscular disease were 26% longer than the mean stay for all hospitalizations (5.9 days versus 4.7 days. Total hospital charges for neuromuscular diseases in 2013 were $109.8 million, 7.2% of total hospital charges for all health conditions, even though discharges for a neuromuscular disease comprised only 5% of all hospitalizations. (Reference Table 6B.2.2 PDF [1345] CSV [1346])
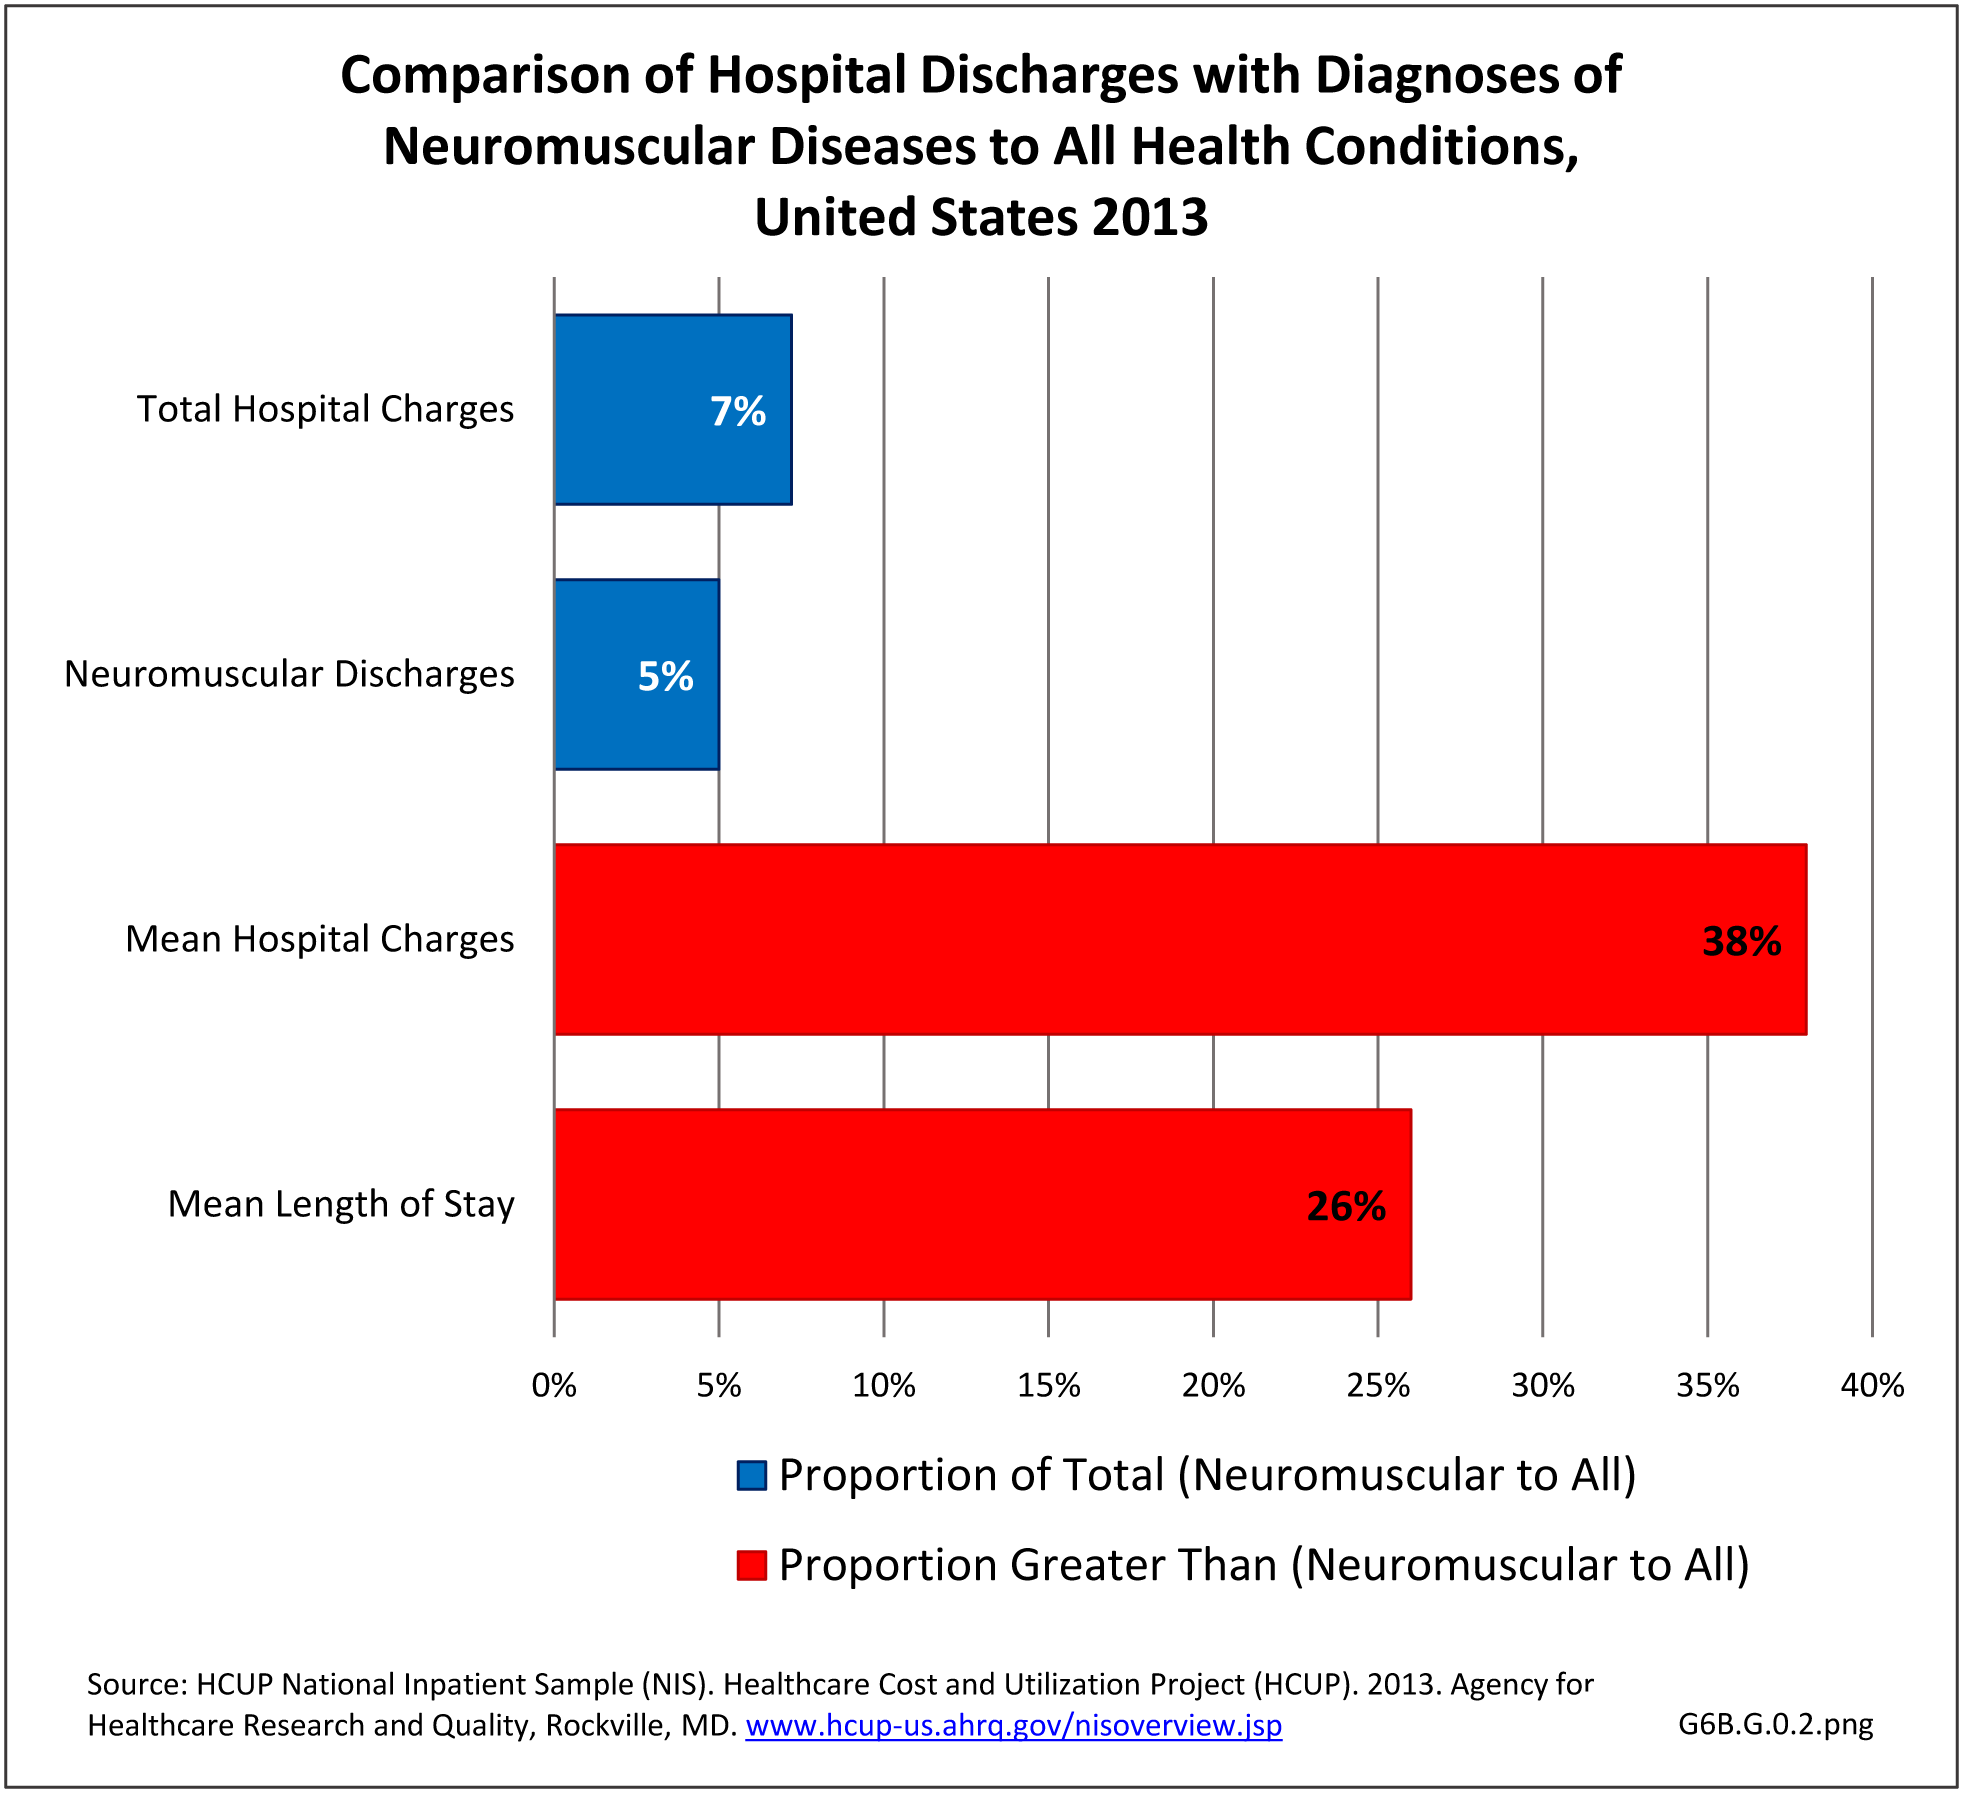 [1369]
 As discussed above, neuromuscular diseases become more prevalent as the population ages. The primary exception to this is spinal cord injuries or diseases, which occur in younger populations more than in the elderly. Total health care visits with a neuromuscular diagnosis reflected this trend in 2013, particularly in the middle age range of 45 to 64. Since many neuromuscular diseases are life-long conditions once they occur or are diagnosed, care will be ongoing throughout life.
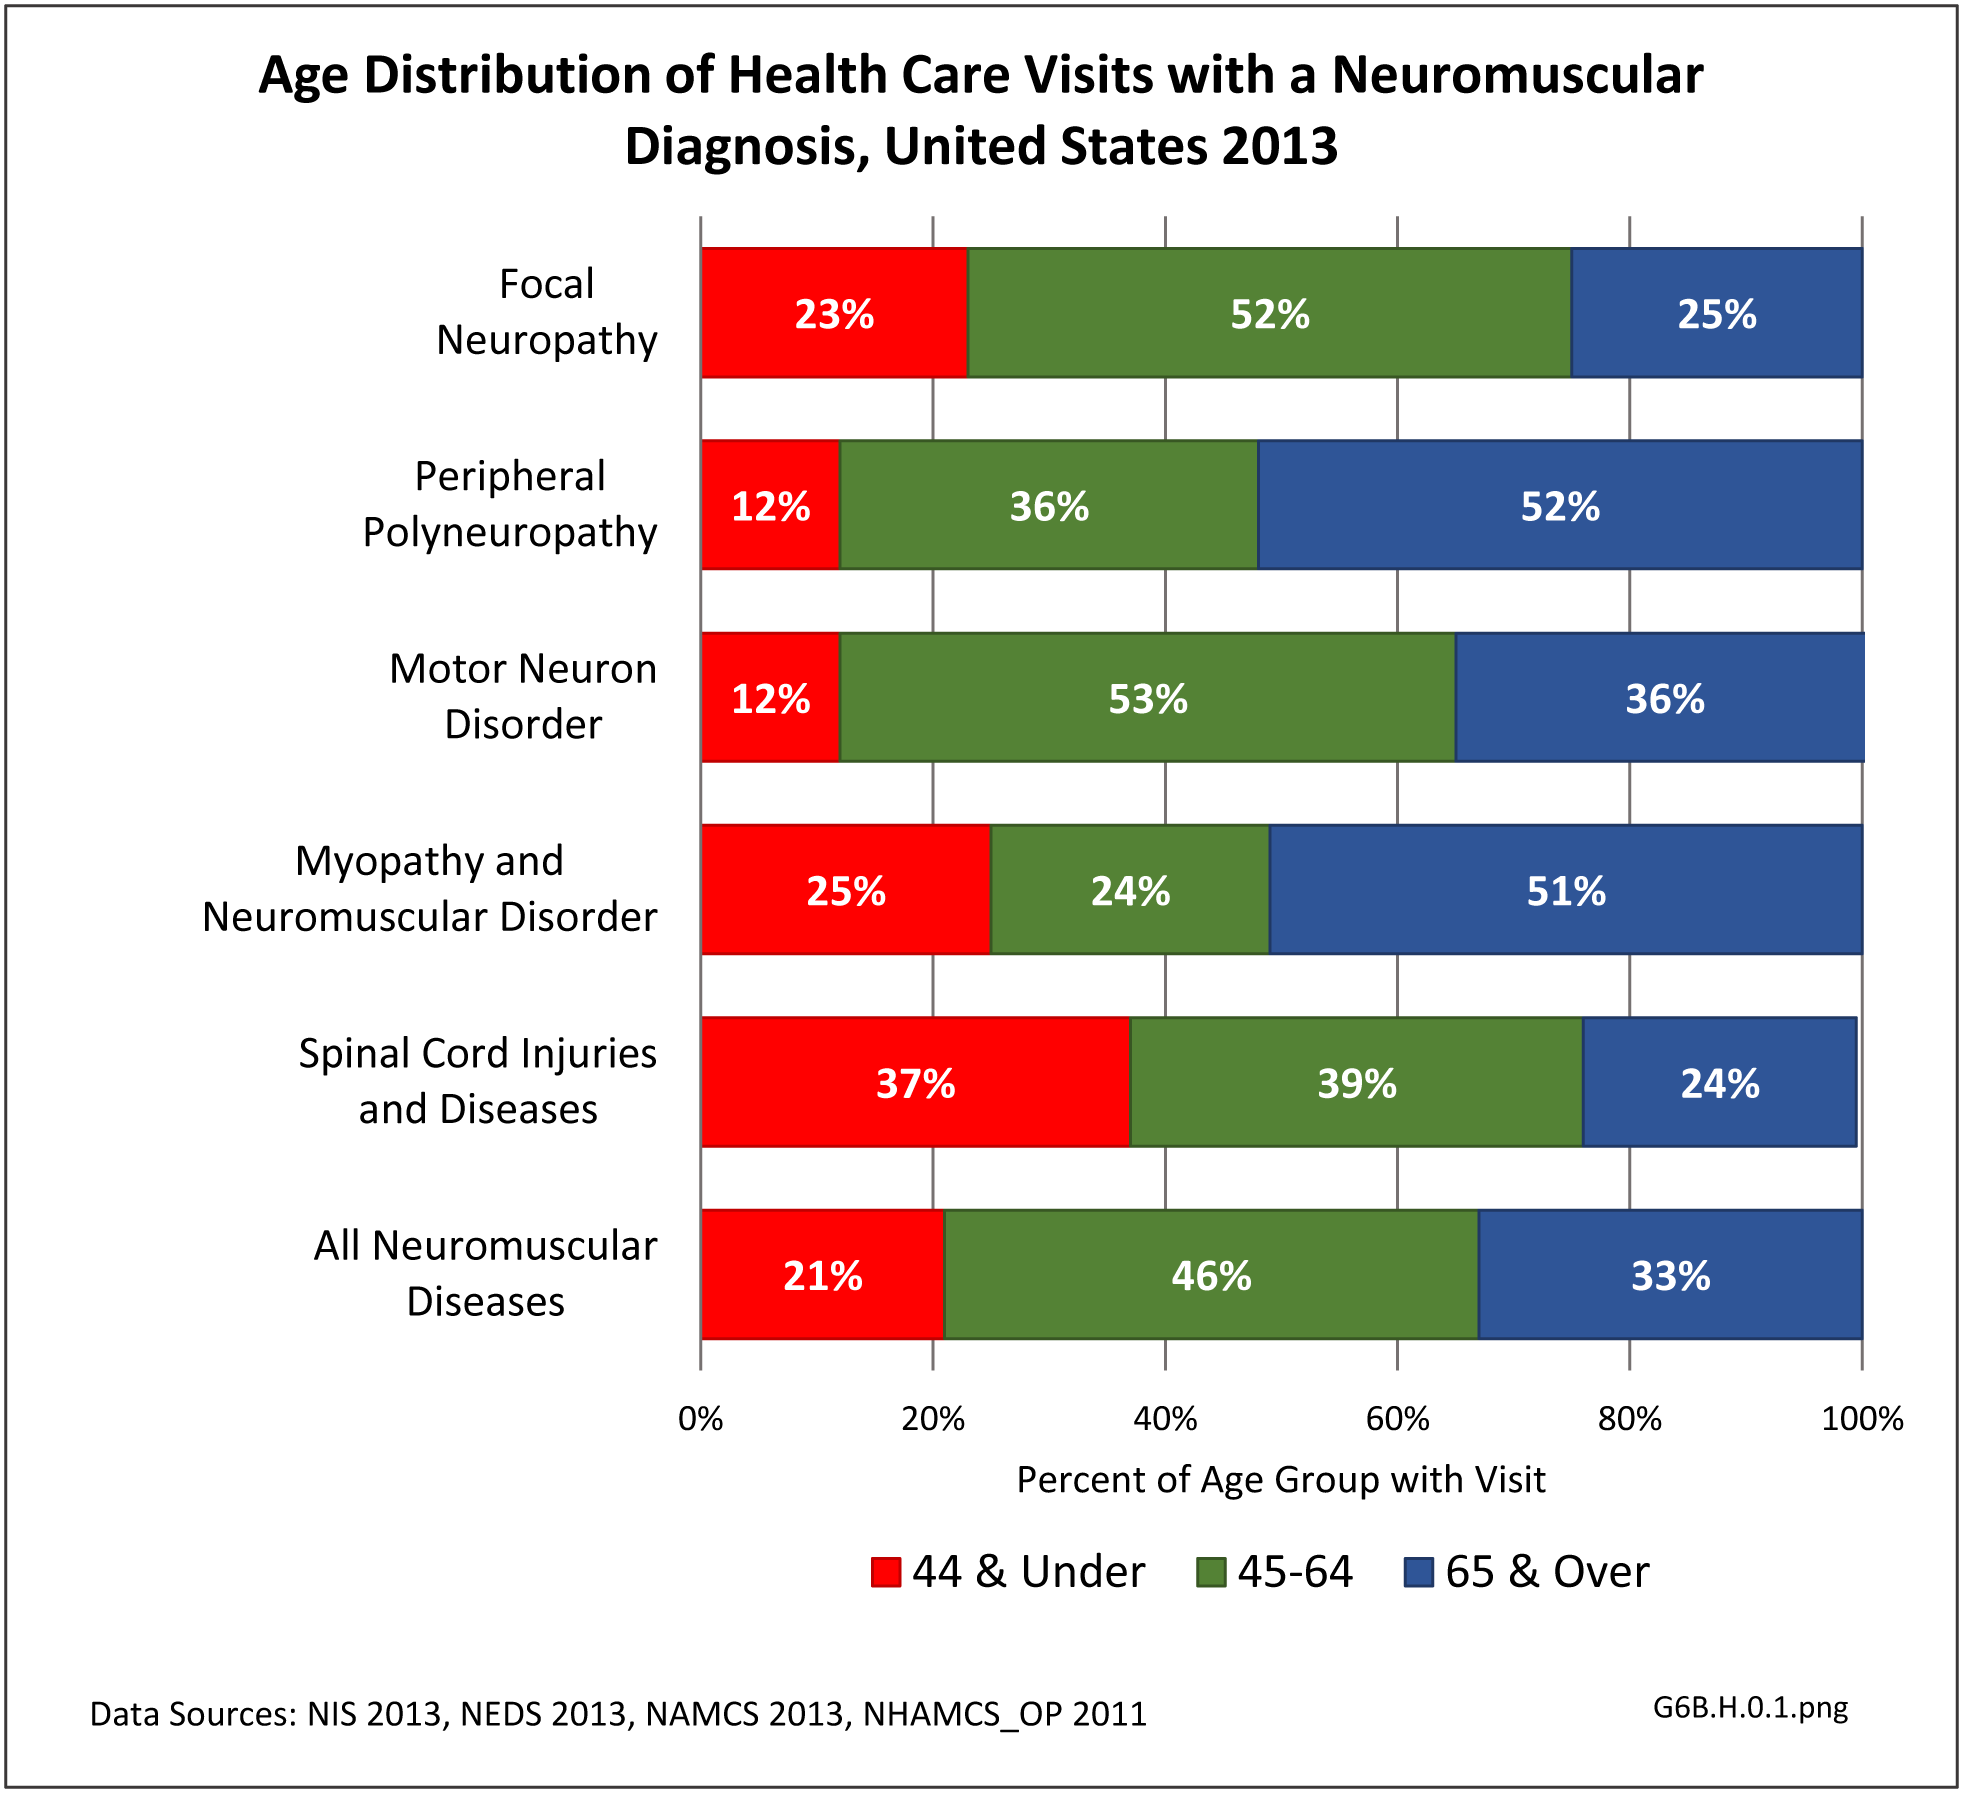 [1371]
 The true prevalence and burden of neuromuscular diseases is likely underestimated due to insufficient research in the area. These conditions often cause significant pain, motor impairment, loss of work and can lead to chronic disability. They may require lifelong rehabilitative care, utilizing many resources in the form of pain management, physical and occupational therapy, bracing, wound and nursing care. Quality of life can be severely affected.
These are an important group of diseases not only because of their direct impact, but also their indirect impact leading to other musculoskeletal conditions such as accelerated degenerative joint disease, scoliosis and osteoporosis. They have a high caregiver burden, and often lead to emotional strain on patients and families.
The datasets assessing hospital discharges are compelling in that patients with neuromuscular disease stay in the hospital longer, at a higher cost, and are discharged to places other than home more often. This does not tell the whole story, however, as many of these conditions are treated in the outpatient setting. Relying on diagnosis codes can also underestimate prevalence since many patients are admitted or treated in an outpatient setting based on symptoms, without a clear diagnosis. Often the diagnosis is clinical, and the correct diagnostic code not used.
There is a scarcity of research on cost effective health care model systems for those with neuromuscular disease despite increasing direct and indirect financial burdens on patients and their families. Despite the recent introduction of the patient-centered outcomes research institute,1 there is a shortage of outcome based research from the neuromuscular patient perspective.
Current postgraduate education and training of clinicians is limited in the management of chronic neuromuscular disease. This includes prevention of complications (for example, prevention strategies for falls specific to this population), and cost effective management at the community level (for example, home based interventions using information technology/telemedicine). There is a lack of training and resources available to primary care providers who manage patients with neuromuscular disease in typical community settings. The ever increasing demand on physicians to see high volumes of patients may also be impacting the quality of evaluations of neuromuscular diseases which typically require intense and lengthy historical intakes. Collaboration amongst interdisciplinary teams, rehabilitation specialists, health care leadership, public health stakeholders, researchers, and academic institutions to educate future healthcare providers in neuromuscular disease care could be improved.
One of the key challenges in the care of people with neuromuscular disease is that patients are living longer with these often chronic diseases. As other disabling musculoskeletal and non-musculoskeletal disorders occur in this population, it can be harder for individuals to maintain quality of life and independence. Pain management for patients with neuromuscular diseases can be challenging, especially with the current opioid epidemic.1 Better biopsychosocial approaches to pain management need to be developed and implemented.
The increasing demand from the aging population with neuromuscular disease and a shortage of trained health care providers may place an excessive burden on communities. Furthermore, access to comprehensive care will be difficult for individuals with moderate to severe neuromuscular disorders requiring an interdisciplinary approach, especially in less populated areas. Controlling costs of medical care without compromising quality is another great unmet need, but not one unique to neuromuscular disease.
ICD-9-CM codes used in this analysis can be viewed by clicking here [1372].
To view a crosswalk of ICD-9-CM codes with ICD-10-CM codes, click here [1373].
This section addresses the burden of musculoskeletal diseases on specific populations. Included are sex and gender, the aging population, children and adolescents, and differences found among ethnic and racial populations, and the populations of four geographic regions in the US.
Demographic shifts have changed the landscape of the United States. The growth in the number and proportion of older adults is unparalleled in US history. Aging baby boomers and longer life spans combined will double the population of older Americans (age 65 years or older) during the next 25 years to about 72 million. By 2030, older adults will account for roughly 20% of the US population.1
During the past century, there has been a change in the leading causes of death for all age groups, including older adults, from infectious diseases and acute illnesses to chronic diseases and degenerative illnesses. Nearly half (42%) of all Americans, and four of every five older Americans, have numerous chronic conditions.2 Treatment for this chronic-conditions population accounts for 90% of the country’s 3.5 trillion annual healthcare expenditures.2, 3
The ability to move (mobility) is essential to everyday life and central to health and well-being among older populations. Impaired mobility is associated with a variety of unfavorable health outcomes. As the proportion of older Americans continues to increase, aging and public health professionals have a role to play in improving mobility for older adults. Gaps exist in the assessment and measurement of mobility among older adults who live in the community, particularly those who have physical disabilities or cognitive impairments.
Older adults are prone to higher rates of nearly all musculoskeletal conditions than those found in younger people. In large part, these conditions can be attributed to wear and tear on bones and joints over a lifetime. However, some musculoskeletal conditions such as back pain are equally prominent in younger age populations, particularly those in their middle ages.
Arthritis is self-reported in 2015 at the highest rate among persons aged 75 years and older (51%), but by nearly as many in the 65 to 74-year age range (48%). Only 29% of persons age 45 to 64 years self-report they have a form of arthritis. Chronic joint pain has a similar reporting pattern as arthritis, but with somewhat lower rates – 47% among those 65 and older and 37% by those 45 to 64-years of age. Low back pain, on the other hand, was self-reported at the highest rate by persons aged 45 to 64-years (35%), closely followed by all people age 65 years and older (34%). Overall, 124.6 million people age 18 years and older self-reported one or more types of musculoskeletal conditions in 2015. (Reference Table 7B.1 PDF [1377] CSV [1378])
 [1380]
 The most common joint reported by the 73 million people over the age of 18 years with chronic pain in 2015 is the knee (47 million), followed by the shoulder (22 million). However, the rate per 100 persons in the various age groups reporting chronic pain in specific joints varies. Knee pain (32%) and hip pain (14%) are reported at the highest level by those age 75 and older, while shoulder (15%), fingers (15%), ankle (8%), wrist (9%), and toes (6%) are reported highest by persons age 65 to 74. The only site with the highest reported chronic pain by persons age 45 to 64 years is the elbow (7%). All age groups reported chronic pain in a mean of just over two joint sites. Overall, joint pain in the ankle, wrist, elbow, and toes is lower among those in the oldest age group compared to those 45 to 74 years of age, possibly due to this population segment being less active and placing lower stress on these joints. (Reference Table 7B.1 PDF [1377] CSV [1378])
 [1382]
 Self-reported limitations in performing activities of daily living from arthritis and back or neck problems affect about one in ten people. Limitations caused by arthritis increase steadily as the populations ages, while back and neck problems are relatively consistent after the age of 45. While overall persons age 18 to 45 reported few limitations, back and neck problems are the most common cause. (Reference Table 7B.1 PDF [1377] CSV [1378])
 [1384]
 Bed and Lost Workdays
People age 45 to 64 years accounted for 41% of the 54 million persons age 18 and over who reported bed days in 2015 due to musculoskeletal conditions, but 50% of the total bed days reported taken. A bed day is defined as one-half or more days in bed due to injury or illness, excluding hospitalization. The greater number of total bed days reported by this age group is due to a high mean of 24.8 days per person combined with large share of the population reporting bed days because of a musculoskeletal condition. (Reference Table 7B.1 PDF [1377] CSV [1378])
 [1386]
 This same age group also accounted for slightly more than half (51%) of the 36 million lost workdays due to musculoskeletal conditions reported by people age 18 years and older and in the workforce. People aged 65 years and older reported only 6% of total lost workdays because of the low number that are still in the workforce. (Reference Table 7B.1 PDF [1377] CSV [1378])
 [1388]
 Older adults will often experience musculoskeletal diseases affecting the spine, with spondyloarthritis and osteoporosis with vertebral fractures often the cause of pain and functional decline. Seniors with such problems may find themselves unable to push or pull large objects, or at times even to reach above their heads. They may have problems lifting grocery bags from the floor or completing household tasks. Bending at the waist may increase the risk for vertebral fractures in people with osteoporosis, reducing breathing capacity and predisposing older adults to chronic lung disease and pneumonias.
Self-reported back and neck pain rates peaked in the age range of 45 to 64 in 2015 and was reported at slightly lower rates for persons age 65 years and older. More than one in three people age 45 years and older reported back or neck pain. (Reference Table 7B.2 PDF [1389] CSV [1390])
 [1392]
 People aged 65 and older had the highest rate of healthcare visits for back and neck pain (43.7 per 100 persons) but accounted for only 26% of the 83 million total healthcare visits for back or neck pain in 2013. The rate of healthcare visits for people age 45 to 64 years was nearly as high (41.0 per 100 persons) and accounted for nearly one-half (48%) of total visits. While only 19.1 in 100 people ages 18 to 44 years had a healthcare visit in 2013 for back and neck pain, this age group comprised 30% of all visits. Total healthcare visits included hospital discharges, emergency department (ED) and outpatient clinic visits, and physician office visits. (Reference Table 7B.2 PDF [1389] CSV [1390])
 [1394]
 Those aged 45 to 64 years had the highest number of spinal fusion procedures performed for back or neck pain, with one in four, or 25.3%, of hospital discharges in this age group with a back or neck pain diagnosis having had a spinal fusion procedure performed. However, the highest rate of hospital discharges with a fusion procedure was among those under 18 years of age (74%), primarily due to the very small number of discharges for back pain in this age group. (Reference Table 7B.2 PDF [1389] CSV [1390])
 [1396]
 Most bed days reported due to back pain (90%) are accounted for by people under the age of 65. A higher number of younger people, those aged 18 to 45 years, report taking bed days than those aged 45 to 64, for spine pain. However, because they report a lower mean number of bed days than the older cohort (6.2 days versus 9.0 days) they account for a slightly smaller share of the total bed days for back pain. People aged 65 years and older account for only a small share of the people who report taking a bed day due to spinal pain (5%), but a larger mean number of days (14.9 days). (Reference Table 9B.2 PDF [1389] CSV [1390])
 [1398]
 Lost workdays due to spine pain or problems in 2015 were taken primarily by people aged 18 to 64 years (96%), the prime workforce ages, and split nearly equally between those under and over the age of 45 years. In 2015, 264 million workdays were reported lost due to back pain. (Reference Table 9B.2 PDF [1389] CSV [1390])
 [1400]
 This report includes a range of deformity conditions that affect the spine. The most common spinal deformity in older adults is acquired through multiple vertebral fractures resulting in kyphosis. Vertebral fractures are often not clinically identified and may show merely as height loss. Nonetheless, vertebral fractures greatly increase the likelihood of future fractures and mortality.1,2
The most familiar spinal deformity condition is that of curvature of the spine, which includes scoliosis, kyphosis, and lordosis. In addition to curvature of the spine, other spinal deformity conditions include spondylolisthesis, spinal infections, complications of surgery, and spondylopathies. Of the 23.4 million healthcare visits in 2013 for spinal deformity, 13 million had a diagnosis of spondylopathy, which refers to any disease of the vertebrae or spinal column associated with compression of peripheral nerve roots and spinal cord, causing pain and stiffness.
Two spinal deformity conditions stand out in the 65 and older cohort -- traumatic spinal fractures and curvature of the spine. People aged 65 years and older accounted for the largest share of healthcare visits in 2013 for vertebral compression fractures (49%), even though they represent only 14% of the population. This group also has a higher than expected share of healthcare visits for all spinal deformity diagnoses (32%). Of the 23.4 million visits in 2013 with a diagnosis of spinal deformity, 40% were made by people age 45 to 64 and 25% by those aged 65 and older. (Reference Table 9B.3 PDF [1401] CSV [1402])
 [1404]
 Arthritis is one of the most common chronic conditions found in the US population. It currently affects 54.4 million adults1 and is projected to reach 78.4 million, or 26% of the adult population by 2040.2 Arthritis is the most common cause of disability in the United States and is a major cause of work and activity limitations, which subsequently affects the economy. Pain from arthritis can substantially affect a person’s quality of life.
Arthritis and other rheumatic conditions (AORC) affect people in higher numbers as they age. Only 7 in 100 persons between the ages of 18 and 44 years report they have doctor-diagnosed arthritis. By the age of 65 years and older, this rate has increased to one in two with some form of arthritis. Although the rates of persons reporting limitations in performing activities of daily living are lower, there is a large disparity between younger persons and the aging. (Reference Table 7B.4.1 PDF [1405] CSV [1406])
 [1408]
 Bed days occur when a person spends at least one-half day in bed in the previous 12 months due to a health condition. On average in the years 2013 to 2015, 607.0 million bed days were reported by persons age 18 years and older due to arthritis. Only 4% of people aged 18 to 44 years reported arthritis-caused bed days. For all people aged 45 years and older, the rate was between 15% and 18%. (Reference Table 7B.4.1 PDF [1405] CSV [1406])
 [1410]
 Arthritis is most likely to be the cause of lost workdays among people between the ages of 45 and 64 years, with nearly 1 in 10 reporting workdays lost. On average in the years 2013 to 2015, 180.9 million workdays were reported lost due to arthritis, with people in the 45- to 64-year age group accounting for 62% of these days. This higher share of lost workdays for this group is likely due to the much higher participation in the workforce for this prime working age cohort. (Reference Table 7B.4.1 PDF [1405] CSV [1406])
 [1412]
 The prevalence of clinically diagnosed symptomatic knee osteoarthritis (OA) was calculated from the National Health Interview Survey 2007–2008 and the proportion with advanced disease (Kellgren-Lawrence grades 3–4) was derived using the Osteoarthritis Policy Model, a validated simulation model of knee osteoarthritis. About 14 million persons have symptomatic knee OA, with advanced OA comprising over half of those cases. This includes more than 3 million African American, Hispanic, and other racial/ethnic minorities. Adults under 45 years of age represented nearly 2 million cases of symptomatic knee OA and individuals between 45 and 65 years of age 6 million more.3
 [1414]
 Despite the frequency of severe pain often experienced with arthritis and other rheumatic conditions, these illnesses account for only 21% of the nearly 30 million hospital discharges in 2013. Visits to a physician’s office, emergency department, or outpatient clinic account for most healthcare visits related to arthritis and other rheumatic conditions (AORC), with nearly 100 million ambulatory visits in 2013. Among the 6.4 million hospital discharges for an AORC in 2013, age was a factor in increasing rates of hospitalization. Fewer than 1 in 100 persons ages 18 to 44 years had a hospital discharge with a diagnosis of an AORC, while 9 in 100 aged 65 years and older were discharged with an AORC diagnosis. However, among all AORC conditions, the distribution of healthcare visits by age varied by age group. (Reference Table 7B.4.2 PDF [1415] CSV [1416])
 Among Adults Age 18 and Older, by Age, United States 2013") [1418]
[1418] Osteoarthritis is the primary form of arthritis to affect older persons and begins to show increasing rates for people in their 40s and 50s. Joint pain, the other common problem, results in healthcare visits among people aged 45 to 64. By the age of 65 years, multiple forms of arthritis are often diagnosed and categorized as other rheumatic conditions. (Reference Table 9B.4.2 PDF [1415] CSV [1416])
Age is not a factor in the length of hospital stay or mean charges with a diagnosis of an AORC. In general, the type of AORC is also not a factor in length of stay or charges. Hospital charges are a rough estimate of hospital cost, and do not include doctor’s fees. (Reference Table 9B.4.3 PDF [1419] CSV [1420])
Joint replacement procedures are often performed when arthritis has become severe and debilitating. Most procedures are performed on people aged 65 and over, with the exception of spine replacement procedures. (Reference Table 9B.4.4 PDF [1421] CSV [1422])
 [1424]
 Osteoporosis develops when more bone is lost (resorbed) than is replaced in the normal bone remodeling process. Several factors contribute to the development of osteoporosis, but the exact reason why the remodeling process becomes unbalanced is unknown. Factors that often lead to osteoporosis include aging, physical inactivity, reduced levels of estrogen, excessive cortisone or thyroid hormone, smoking, and excessive alcohol intake. Loss of bone calcium accelerates in women after menopause.
Bone loss occurs most frequently in the spine, lower forearm above the wrist, and upper femur or thigh, the site where hip fractures usually occur.
Osteopenia or low bone mass: A value for bone mineral density more than 1 standard deviation (SD) below the young healthy female adult mean, but less than 2.5 SD below this value.1
Osteoporosis: A value for bone mineral density 2.5 SD or more below the young healthy female adult mean.1
Young female adult mean and standard deviation (SD): For the femoral neck, the mean and SD were based on data for 20- to 29-year-old non-Hispanic white females from the Third National Health and Nutrition Examination Survey (NHANES III).2 For the lumbar spine, the mean and SD were based on data for 30-year-old white women from the dual-energy x-ray absorptiometry (DEXA) densitometer manufacturer.3
Other races: People from racial and ethnic groups other than non-Hispanic white, non-Hispanic black, or Mexican American. This group consists primarily of Hispanic descent other than Mexican American, Asian, Native American, and multiracial persons, among others.
Prevalence estimates of osteoporosis or low bone mass at the femoral neck or lumbar spine (adjusted by age, sex, and race/ethnicity to the 2010 Census) for the non-institutionalized population age 50 years and older from the National Health and Nutrition Examination Survey 2005–2010 US Census population counts to determine the total number of older US residents with osteoporosis and low bone mass. There were over 99 million adults 50 years and older in the US in 2010. Based on an overall 10.3% prevalence of osteoporosis, the authors estimated that in 2010, 10.2 million older adults had osteoporosis. The overall low bone mass prevalence was 43.9%, from which they estimated 43.4 million older adults had low bone mass. Of these, 7.7 million were non-Hispanic white (prevalence of 10.2%), 0.5 million non-Hispanic black (prevalence of 4.9%), and 0.6 million Mexican American adults (prevalence of 13.4%) had osteoporosis and another 33.8 million, 2.9 million, and 2.0 million had low bone mass (prevalence 44.9%, 29.7%, and 43.2%), respectively. 4 (Reference Table 7B.5.1 PDF [1425] CSV [1426])
 [1428]
 [1430]
 Osteoporosis often is not the principal diagnosis code related to a healthcare visit because the condition is usually an underlying cause of another condition, particularly fragility fractures that often occur after a fall or other seemingly minor incident. Often in such healthcare visits, osteoporosis may not even be listed as a condition. Still, in 2015, primary osteoporosis was listed in 1.87 million hospital discharges and emergency department visits as a reason for the visit in the population aged 50 and over. Fragility fractures occurred in 1.48 million visits for people aged 50 years and older. (Reference Table 7B.5.1 PDF [1425] CSV [1426])
Age is a factor in both primary osteoporosis diagnosis and in the occurrence of fragility fractures with most occurring in people after the age of 70. A prior fracture in women aged 50 years and older is the most important risk factor for hip fractures. More than three-fourths (76%) of primary osteoporosis diagnoses were for people ages 70 years and older. However, in 2013, 8% of osteoporosis diagnoses was for people aged 50 to 59 years, and 16% among those aged 60 to 69 years.
Among fragility fractures, 79% were for people aged 70 years and older, with the remainder split among those aged 50 to 69. The site of the fracture was particularly important with respect to age. The oldest group, those 70 years and older, were prone to fractures of the hip and vertebrae. Fractures of the wrist and ankle or foot occurred across all people over the age of 50. (Reference Table 7B.5.1 PDF [1425] CSV [1426])
 [1432]
 Approximately 30% of older women will fall annually, and this risk may be higher in women with other chronic conditions.5,6 Several studies have used survey data to analyze falls, while other studies have limited their analysis to falls seen in emergency departments, in older women, or falls that resulted in fracture or hip fracture.
Falls prevalence may vary by race/ethnicity. In a survey-based cross-sectional study of self- reported falls from 6,277 women 65–90 years of age. The independent association of race/ethnicity and recent falls was examined, adjusting for known risk factors. Compared to whites, Asian (OR 0.64, CI 0.50–0.81) and black (OR 0.73, CI 0.55–0.95) women were much less likely to have ≥1 fall in the past year, adjusting for age, comorbidities, mobility limitation and poor health status. Asians were also less likely to have ≥2 falls (OR 0.62, CI 0.43–0.88). This may contribute to their lower rates of hip fracture.7
Fractures are associated with significant increases in health services utilization compared to pre-fracture levels. Relative to the prior 6-month period, rates of acute hospitalization are between 19.5 (distal radius/ulna) and 72.4 (hip) percentage points higher in the 6 months after fractures. Average acute inpatient days are 1.9 (distal radius/ulna) to 8.7 (hip) higher in the post-fracture period. Fractures are associated with large increases in all forms of post-acute care, including post-acute hospitalizations (13.1% to 71.5%), post-acute inpatient days (6.1% to 31.4%), home healthcare hours (3.4% to 8.4%), and hours of physical (5.2% to 23.6%) and occupational therapy (4.3% to 14.0%). Among patients who were initially community dwelling at the time of the initial fracture, 0.9% to 1.1% were living in a nursing home 6 months after the fracture. These rates rose by 2.4% to 4.0% one year after the fracture.8
Since 1980, there has been a nearly 15% decrease in the prevalence of chronic disability and institutionalization among people aged 65 years and older. A reduction in disability translates directly into cost savings since it is seven times more expensive to care for a disabled senior versus a healthy one. Major activity limitations are a common cause of nursing home admissions. While the most common cause of limitations is arthritis, affecting nearly 50% of people older than 65 years and an estimated 60 million by 2020.9
Vertebral and hip osteoporotic fractures result in a 20% increase in mortality, usually observed in the 12 months after the fracture. Men, who are generally older at the time of the hip fracture, have a 30% mortality rate after the fracture. Moreover, comorbidities such as cardiovascular disease contribute to a higher mortality rate.
A population-based study in Olmsted County, MN, found that within the first seven days after hip fracture repair, 116 (10.4%) of participants experienced myocardial infarction and 41 (3.7%) subclinical myocardial ischemia. Overall, the 1-year mortality was 22%, with no difference between those with subclinical myocardial ischemia and those with no myocardial ischemia. One-year mortality for those with a myocardial infraction was significantly higher (35.8%) than for the other two groups.10 The relative mortality after vertebral fracture varies from 1.2 to 1.9 in different reports,3,11 but the excess deaths occur late, rather than early, after vertebral fractures.12
For older adults, falls and associated injuries threaten health, independence, and quality of life. More than a third of people aged 65 years and older who live independently fall each year; falls are the leading cause of injury-related deaths and hospital emergency department visits.
On average, more than 8.7 million injury episodes, of which 3.1 million were fall related, for which people sought medical treatment were self-reported by individuals in 2013-2015. The majority of injuries occurred to people between the ages of 18 and 64 years, the ages that comprised 83% of the over-18-year population in the United States. Sprains and strains (31%) were the most frequent injury reported for which medical care was sought, but 18% suffered fractures, 18% severe contusions, and 14% open wounds.
Falls are the primary cause of musculoskeletal injuries as the population ages. Approximately three out of four injuries among people aged 65 years and older for which a person is hospitalized or visits an emergency department is the result of a fall. Trauma, such as auto accidents and other accidents involving machinery or moving objects, is a major cause of musculoskeletal injuries among people ages 18 to 44 years, particularly for injuries where care is received in an emergency department. Other causes of injuries, including sports injuries, are seen in emergency departments for one in three (33%) injuries to people aged 18 to 44 years and one in two (51%) for people under the age of 18. (Reference Table 9B.6 PDF [1436] CSV [1437])
 Injuries for Hospital Discharges and Emergency Department Visits, by Age, United States 2013-2015") [1439]
[1439] Osteogenic sarcoma (OS) exhibits a bimodal distribution, the significant second peak in incidence occurs in the seventh and eighth decades of life. Osteosarcoma in the elderly can also be attributed to Paget’s disease or previous radiotherapy. The expectation that these elderly patients may not tolerate aggressive modern chemotherapy means that those patients who develop OS after the age of 40 years are excluded from current trials of treatment. As a result, remarkably little is known about the outcome for this age group.1
The overall incidence of tumors of the musculoskeletal system is lower than many types of cancers. This is particularly true for primary cancers of the bones and joints, although bones and joints are frequently a site of secondary, or metastasized, cancers. The occurrence of cancers of the bones and joints affects all ages and is one of the primary cancers in young people. Myeloma, cancer of the bone marrow, is a disease of the elderly, with nearly two-thirds of cases found in persons age 65 and over. Soft tissue cancers affect all ages, but the occurrence increases with age. (Reference Table7B.7 PDF [1440] CSV [1441])
 [1443]
 Key challenges in the area of musculoskeletal health in older adults are significant. Along with the dramatic increase in the number of older adults is the expectancy that healthy adults will maintain mobility and activity. However, prolonged life expectancy and years of stress on bodies is greatly increasing the likelihood of development of arthritis and osteoporosis, among other conditions, over the years. These conditions often lead to pain, disability, and reduce the ability to remain active and perform activities of daily living. New research to address causes and reduce disability caused by conditions common in the aging population is needed.
A growing body of work on health-related knowledge translation1 reveals significant gaps between what is known to improve health, and what is done to improve health.
A gap in medical care continues to occur after an osteoporosis related fracture in older adults. Furthermore, the decreasing rate of treatment for osteoporosis after hip fracture is noted in the US by Solomon and colleagues.2 The latest quality measures by the National Commission on Quality Assessment (2017) indicate that treatment for osteoporosis after a fracture in an older woman has increased. Evaluation measured as a bone density test is performed in 72.7% of health management organizations (HMOs) and 82% of Preferred Provider Organizatons (PPO). Actual osteoporosis treatment is reported as 46.7% of HMOs and 39.1% of PPOs. This is a substantial increase over prior annual findings.
System-based quality improvement programs such as the American Orthopaedic Association’s “Own the Bone [1444]” have been successful with raising awareness and spearheading improvement in increasing treatment rates for osteoporosis after a fracture.3,4,5
Another area with a gap in medical care is in the prevention in falls. Falls are common in older individuals, affecting as many as 30% of older women. Injuries from falls include fractures and blunt head trauma, and result in increased mortality. Women with self-reported osteoarthritis (OA), in particular, have an increased risk of falls, and in spite of elevated bone mass, remain at risk of fractures.6 In 2017, the cost of fall injuries totaled as much as $49.5 billion, depending on methods used to identify a fall, the national healthcare database used, and study design.7 As the population ages, the financial toll for older adult falls is projected to reach $67.7 billion by 2020.8
Falls result in more than 2.8 million injuries treated in emergency departments annually, including over 800,000 hospitalizations and more than 21,000 deaths. Every 11 seconds, an older adult is treated in the emergency room for a fall. Every 19 minutes, an older adult dies after a fall.8
In conclusion, musculoskeletal disorders are prevalent, and often of serious consequences in older adults. A greater awareness in osteoporosis care after a fracture can be helped through bone density testing. The use of osteoporosis therapy afater fracture will result in a higher quality of life and prevention of disability among America’s seniors.
Previous sections in this text clearly demonstrate the large percentage of healthcare visits that are attributable to musculoskeletal conditions. Most of the data used to establish these estimates concern adult patients. Unfortunately, there is significantly less information regarding the burden of these conditions in young patients.
Studies, however, do support that pediatric musculoskeletal conditions similarly account for a significant portion of visits to medical providers. For instance, de Inocencio reported that greater than 6% of total visits to pediatric clinics were for musculoskeletal pain.1 Schwend reported that approximately one third of pediatric medical problems are related to the musculoskeletal system.2 In a population-based study in Ontario, Canada, Gunz reported that 1 in 10 children made a healthcare visit for a musculoskeletal problem and that 13.5% of all visits for musculoskeletal disease were made by patient’s age 0 to 19 years.3 Four in 1,000 children are reported by parents as having difficulty with activities of daily living due to musculoskeletal conditions. A search of the National Health Interview Survey [1446] (NHIS) child sample revealed that musculoskeletal conditions accounted for 1.6% of parent-reported health conditions in 73.5 million healthcare visits for children and adolescents age 0 to 17 years in the US from 2013 to 2015. This proportion was greatest at 2.4% in the 14- to 17-year-old age group. (Reference Table 7C.0 PDF [1447] CSV [1448])
The evaluation and treatment of these pediatric musculoskeletal conditions resulted in approximately 94.8 million missed school days per year from 2013 to 2015, accounting for 27.5% of all missed school days. Musculoskeletal conditions are surpassed only by respiratory infections and developmental delay as a cause of missed school days. Children aged 5 to 9 years old missed the highest number of school days due to musculoskeletal pain. (Reference Table 7C.0.1 PDF [1449] CSV [1450])
 [1452]
 Children with musculoskeletal conditions also commonly have other medical problems. According to the National Health Interview Survey from 2013 to 2015, these are most commonly respiratory conditions followed by developmental delay. Of children with musculoskeletal conditions, 48% also have a diagnosed respiratory condition and 36% have developmental delay. (Reference Table 7C.0.2 PDF [1453] CSV [1454])
Despite the significant contribution made by musculoskeletal conditions in the total US healthcare burden, research for pediatric musculoskeletal conditions is grossly underfunded. Of the $3.25 billion in National Institutes of Health (NIH) research funding for all pediatric conditions in 2013, only $46.8 million, or 1.4% of total pediatric medical research funding, went toward pediatric musculoskeletal research. Even under the umbrella of funding specifically for musculoskeletal research, pediatric-specific research is under-represented. Of the $424.4 million in funding for the National Institute of Arthritis and Musculoskeletal and Skin Disease (NIAMS) in 2013, this same $46.8 million represented only 11% of total musculoskeletal research dollars.4
 [1456]
 In order to perform a comprehensive review of the burden of musculoskeletal disease in children and adolescents, all conditions that are direct musculoskeletal diagnoses or have musculoskeletal implications were considered for this section. This chapter was divided into separate clinically relevant sections to better understand the burden of each. These sections include musculoskeletal infections, deformity, trauma, neuromuscular conditions, syndromes with musculoskeletal implications, sports injuries, neoplasms, skeletal dysplasias, rheumatologic conditions, medical problems with musculoskeletal implications, and pain syndromes.
Healthcare visits and hospitalization data are derived from diagnostic codes for each of the conditions presented. These codes are available in the ICD-9-CM Codes [1457] section of this topic. Total healthcare visits are the sum of cases seen in physicians’ offices (National Ambulatory Medical Care Survey), outpatient clinics (National Hospital Ambulatory Medical Care Survey), emergency departments (Nationwide Emergency Department Sample), and hospital discharges (Nationwide Inpatient Sample). The largest database used is the Healthcare Cost and Utilization Project [1458] (HCUP) Nationwide Emergency Department Sample (NEDS), which estimates approximately 32.5 million weighted visits of children and adolescents through the age of 20 years. These four databases were analyzed for the ages 0 through 20 years, with subsets of data by age groups under 1 year, ages 1 to 4 years, 5 to 9 years, 10 to 13 years, 14 to 17 years, and 18 to 20 years.
 [1460]
 Each database includes multiple variables to define diagnoses, ranging from three possible diagnoses in the physicians’ office and outpatient clinic data sets to 25 possible diagnoses in the HCUP National Inpatient Sample (NIS) database. If a diagnosis code is listed in any of the possible diagnosis variables, the record is coded as presenting with that condition. If the diagnosis code is listed in the first diagnosis variable, it is coded as the primary diagnosis. However, the databases do not permit diagnostic verification. The first diagnosis listed may not be the primary reason for the visit, but a contributing cause. Further, there is the potential for overlap in diagnosis of related conditions. It is also possible diagnoses codes used for reimbursement purposes may be inaccurate. Therefore, these numbers provide only a guide to the impact of major childhood musculoskeletal conditions.
Injuries include two categories: sports injuries and injuries due to a traumatic event. Sports injuries are identified by type of sports activity using the United States Consumer Product Safety Commission’s National Electronic Injury Surveillance System [1461] (NEISS), with annual injuries averaged across the years of 2014 to 2016. Because sports injuries cases are not analyzed by ICD-9-CM codes, they may duplicate trauma injury cases cited from the previously discussed databases.
The 11 categories of musculoskeletal conditions that follow represent the most common healthcare reasons for which children and adolescents are seen in doctors' offices, emergency departments, and hospitals. Many of these conditions, such as the skeletal dysplasias, are relatively rare, diagnosed infrequently in the healthcare system, and have little data available on prevalence and burden. Though rare, they may result in significant morbidity and often require lifelong medical interventions and, therefore, warrant discussion.
In 2013, more than 18 million children and adolescents age 20 years and younger received treatment in medical centers, physicians’ office, and hospitals for a condition that included a musculoskeletal-related condition. More than 65% were for the treatment of traumatic injuries. The second most common diagnosis is a pain syndrome, accounting for more than 1 in 10 visits (15%). Pain syndromes include amplified musculoskeletal pain and benign limb pains, along with less common juvenile primary fibromyalgia syndrome, reflex sympathetic dystrophy, and benign hypermobility syndrome. The third most frequent diagnosis is sports injuries, accounting for just over 10% of all visits. The discussion of sports injuries utilizes a unique database that is not based on ICD-9-CM codes; it is likely there is overlap between traumatic injuries and sports injuries. (Reference Table 7C.1.1 PDF [1463] CSV [1464])
 Related Diagnosis for Any Diagnoses, United States 2013") [1466]
[1466] More than two-thirds (70%) of visits by children and adolescents for a condition that included a musculoskeletal-related condition were to physicians’ offices or outpatient clinics. Hospital discharges accounted for less than 3% of total visits. Healthcare visits that included a musculoskeletal-related condition represented 7% of visits made by children and adolescents for any reason but were more than 15% of all visits to the emergency department. (Reference Table 7C.1.1 PDF [1463] CSV [1464])
 Discharges/Visits for Any Diagnoses by Source, United States 2013") [1468]
[1468] Among the 246 million healthcare visits by children and adolescents in 2013, 14.4 million had a primary diagnosis of a musculoskeletal-related condition. The greater proportion (64%) were for the treatment of traumatic injuries, with the second and third most common primary diagnoses being sports injuries (13%) and pain syndrome (12%). Although all other musculoskeletal-related conditions accounted for 13% of total healthcare visits for a musculoskeletal-related condition, they nevertheless remain serious health concerns for children and adolescents. (Reference Table 7C.1.2 PDF [1469] CSV [1470])
 [1472]
 Again, many visits were to physicians’ offices and outpatient clinics (70%), while visits to an emergency department with a primary musculoskeletal-related condition diagnosis accounted for 29% of visits. Hospital discharges accounted for less than 1% of total visits with a primary musculoskeletal diagnosis. Healthcare visits that included a primary diagnosis of a musculoskeletal-related condition represented 6% of visits made by children and adolescents for any reason but were 13% of all visits to the emergency department. (Reference Table 7C.1.2 PDF [1469] CSV [1470])
 [1474]
 Musculoskeletal infections included in this section are osteomyelitis, septic arthritis, soft tissue infections (myositis), Lyme disease, and tuberculosis. Osteomyelitis and septic arthritis are the most common form of pediatric musculoskeletal infections, and most often occur in the first decade of life in previously healthy children. Infectious myositis refers to conditions causing inflammation in muscles and may be part of a systemic (whole body) infection, especially a viral infection. Lyme disease is caused by a bite from a deer tick and is less common than osteomyelitis and septic arthritis. It is more prevalent in the Northeastern and Midwestern regions of the United States.1 Tuberculosis (TB) has become much less common in the United States over the last few decades but has increased in incidence in developing countries secondary to immunodeficiency and multidrug resistance. TB infections involve the musculoskeletal system in 2% to 5% of cases.2
Community-acquired Staphylococcus aureus (CA-SA) is the most common infecting organism in pediatric musculoskeletal infections and is typically treated with a first-generation cephalosporin, such as cefazolin. Over the past decade, methicillin-resistant Staphylococcus aureus (MRSA) has become prevalent and requires treatment with second-line antibiotics such as clindamycin or vancomycin.3 As MRSA infections have become more prevalent, the disease course for patients with these infections have become much more severe, with greater systemic disease requiring multimodal and multidisciplinary treatments including medical, surgical, and critical care. Patients are often hospitalized for extended periods and most require continued care with long-term antibiotic treatment after discharge. Multiple surgical debridements are often required. Complications of musculoskeletal infections include growth deformity, fractures, and arthritis, and may result in long-term morbidity and dysfunction.
Musculoskeletal infections were diagnosed in 61,400 children and adolescent healthcare visits in 2013, of which 41,800 had a primary diagnosis of musculoskeletal infection. Of this total, 14,000 children and adolescents were hospital discharges, with 8,300 hospitalizations for a primary diagnosis of a musculoskeletal infection. (Reference Table 7C.1.1 PDF [1463] CSV [1464] and Table 7C.1.2 PDF [1469] CSV [1470])
Males were more likely to be hospitalized with a musculoskeletal infection than females. The most common age group was between 5 and 9 years old. Musculoskeletal infections as a primary diagnosis accounted for 1.6% of hospital discharges for any musculoskeletal-related condition, but only 0.1% of hospital discharges for all healthcare reasons for children and adolescents age 20 years and younger. (Reference Table 7C.2 PDF [1475] CSV [1476])
 Infection Diagnosis, by Sex and Age, United States 2013") [1478]
[1478] Total charges averaged $76,900 for a mean 8.5-day stay when children and adolescents were hospitalized with a diagnosis of musculoskeletal infection along with other medical conditions. With a primary diagnosis of infection, the stay was shorter (5.9 days), and mean charges were less at $48,300. Total hospital charges for all primary musculoskeletal infection discharges in 2013 were $400.9 million. (Reference Table 7C.2 PDF [1475] CSV [1476])
 Infection Diagnosis, by Sex and Age, United States 2013") [1480]
[1480] Deformity in children and adolescents is subdivided into five sections: upper extremity, lower extremity, hip and pelvis, spine, and other/unspecified.
Upper extremity deformity includes diagnoses such as polydactyly, syndactyly, and reduction deformities such as amyelia and longitudinal deficiencies of the upper extremity, and other congenital deformities such as synostosis, Madelung deformity, and Apert syndrome. A complete listing of deformity codes can be found in the ICD-9-CM Child and Adolescents Codes [1457].
Lower extremity deformity includes diagnoses such as polydactyly, syndactyly, and reduction deformities such as amyelia and longitudinal deficiencies of the lower extremity, genu varum, genu valgum, and other congenital developmental deformities such as clubfoot and flatfoot.
Hip and pelvis deformity include diagnoses such as coxa valga, coxa vara, slipped capital femoral epiphysis, pelvic deformity, Legg Calves Perthes disease, and developmental dysplasia of the hip. Hip deformity is among the most common developmental deformities in childhood. Developmental dysplasia of the hip is estimated to occur in between 1 in 100 to 1 in 1000 newborns.1
Spine deformity includes anomalies of the spinal cord such as syringomyelia and diastomatomyelia, as well as deformities of the vertebral column such as scoliosis, kyphosis, spondylolysis, spondylolisthesis, and congenital spinal anomalies.
Other and unspecified deformities include deformities of the chest wall such as pectus excavatum and pectus carinatum, as well as nonspecific deformity diagnoses.
Deformity of the spine represented the largest share of hospitalizations (40.7%) in 2013, followed by the lower extremity at 29% and upper extremity at 19.1%. (Reference Table 7C.3 PDF [1481] CSV [1482])
 Deformity Diagnosis, by Body Site, United States 2013") [1484]
[1484] Musculoskeletal deformities were diagnosed in 1.7 million children and adolescent healthcare visits in 2013, of which 958,900 had a primary diagnosis of musculoskeletal deformity. Among the total with any diagnoses of deformity, 108,100 children and adolescents were hospital discharges, with 27,500 hospitalizations for a primary diagnosis of a musculoskeletal deformity. (Reference Table 7C.1.1 PDF [1463] CSV [1464] and Table 7C.1.2 PDF [1469] CSV [1470])
Females had a slightly higher rate of overall deformity diagnoses with hospitalization, accounting for 52% of primary diagnosis. Neonates had a high rate of musculoskeletal deformity for any diagnosis with hospitalization (24.4%) but accounted for only 0.1% of primary hospitalizations of all musculoskeletal diagnoses. Primary diagnosis of musculoskeletal deformity with hospitalization was highest between the ages of 10 and 17 years.
 Deformity Diagnosis, by Sex and Age, United States 2013") [1486]
[1486] Musculoskeletal deformity as a primary diagnosis accounted for 5.5% of hospitalizations for any musculoskeletal condition diagnosis, but only 0.4% of hospitalizations for any healthcare reason for children and adolescents age 20 years and under. (Reference Table 7C.3 PDF [1481] CSV [1482])
Total charges averaged $70,700 for a mean 6.3-day stay when children and adolescents were hospitalized with a diagnosis of musculoskeletal deformity along with other medical conditions. With a primary diagnosis of deformity, the stay was shorter (4.1 days), but mean charges were much higher at $100,200, primarily due to the higher charges for children and adolescents age 10 years and older. Total hospital charges for all primary musculoskeletal deformity discharges in 2013 were $2.76 billion. (Reference Table 7C.3 PDF [1481] CSV [1482])
 Deformity Diagnosis, by Sex and Age, United States 2013") [1488]
[1488] Traumatic injury is the leading cause of death in children and adolescents, accounting for 20,000 deaths per year in the United States.1 Although most musculoskeletal injuries are not life threatening, they do account for approximately 10% to 25% of injuries in this age group.2
The pediatric musculoskeletal system is different from that of an adult, and, therefore, the assessment, treatment, and outcome of injuries is different. Pediatric bone is more elastic, and with a capacity for growth, there exists superior remodeling capability. Because of this, many fractures that require surgical treatment in adults may be treated nonoperatively in children. On the other hand, injury to the growing child can result in growth deformity that can lead to long-term morbidity and the need for reconstructive treatments. This section subdivides pediatric musculoskeletal trauma into six sections: upper extremity, lower extremity, hip and pelvis, spine and trunk, birth trauma, and nonaccidental trauma (child abuse). (Reference Table 7C.4 PDF [1490] CSV [1491])
Trauma resulting in musculoskeletal injury was diagnosed in 11.8 million children and adolescent healthcare visits in 2013, of which 79% (9.3 million) had a primary diagnosis of musculoskeletal injury. Only a small number were serious enough to require hospitalization. Among any trauma musculoskeletal injury diagnoses, 215,200 children and adolescents were hospitalized, with 65,600 having a primary diagnosis of a musculoskeletal injury. (Reference Table 7C.1.1 PDF [1463] CSV [1464] and Table 7C.1.2 PDF [1469] CSV [1470])
Males had higher injury rates with hospitalization than females for both any diagnoses (60% of injuries) and as a primary diagnosis (67% of injuries). Hospitalization for musculoskeletal injuries were highest among adolescents age 14 years and older. Neonates under the age of one year had a high rate of musculoskeletal injury for any diagnosis with hospitalization, primarily due to a diagnosis of birth trauma (99%), but a much lower rate of hospitalization with a primary trauma diagnosis (0.5% of musculoskeletal diagnoses in this age bracket).
 [1493]
 Musculoskeletal injury as a primary diagnosis accounted for 13% of hospitalizations for any musculoskeletal condition diagnosis, and 1.0% of hospitalizations for any healthcare reasons for children and adolescents age 20 years and younger. For all but the youngest age, which is skewed by birth trauma, primary diagnosis of trauma accounted for 13.5% to 21.9% of all hospitalization for any musculoskeletal diagnoses. (Reference Table 7C.4 PDF [1490] CSV [1491])
Trauma to the upper extremity account for half (50%) of all trauma healthcare visits by children and adolescents. This was followed by lower extremity trauma (38%). Spine and trunk injuries were 8%, with hip and pelvis injuries at 2%. A diagnosis of birth trauma was less than 1% of all healthcare visits but accounted for more than half (53%) of hospital discharges for musculoskeletal trauma diagnoses. Child abuse was reported in 1% of all healthcare visits for trauma. (Reference Table 7C.1.1 PDF [1463] CSV [1464])
 [1495]
 Total charges averaged $37,100 for a mean 4.2-day stay when children and adolescents were hospitalized with a diagnosis of musculoskeletal injury along with other medical conditions. With a primary diagnosis of musculoskeletal injury, the stay was shorter (3.1 days), but mean charges were higher at $46,300, likely due to the high number of birth trauma cases. Mean charges were highest for older adolescents (18 to 20 years) followed by neonates. Total hospital charges for all primary musculoskeletal injury discharges in 2013 were $3.04 billion. (Reference Table 7C.4 PDF [1490] CSV [1491])
 [1497]
 Common pediatric neuromuscular conditions include cerebral palsy, myelomeningocele (spina bifida), muscular dystrophy, spinal muscular atrophy, hereditary motor sensory neuropathies, Friedrich ataxia, and Rett syndrome. This is a heterogeneous group of disorders with varying degrees of severity and involvement. Although some children and adolescents with these diagnoses can lead a relatively normal life and participate in normal activities, many are completely dependent on their care provider. Most patients lie somewhere between the two ends of this range and require varying amounts of care for their condition. The overall burden of these diagnoses is not limited to number of visits or admissions. These diagnoses also carry significant indirect costs including, but certainly not limited to, lost wages by the caregiver who is unable to go to work; out-of-pocket costs for necessities such as therapy, bracing, and wheelchairs; and the significant emotional impact on the family and care provider.
Neuromuscular conditions were diagnosed in 554,500 children and adolescent healthcare visits in 2013, of which 214,600 had a primary diagnosis of a neuromuscular condition. About 1 in 10 (11%) children and adolescents with any neuromuscular diagnoses were hospitalized (61,200), but fewer than 2% (4,100) with a primary neuromuscular diagnosis had a hospital discharge. (Reference Table 7C.1.1 PDF [1463] CSV [1464] and Table 7C.1.2 PDF [1469] CSV [1470])
Males were slightly more likely to be hospitalized than females for both any neuromuscular diagnoses and as a primary diagnosis. Children ages 6 to 10 years had the highest rate of hospitalization, both with any diagnoses and as a primary diagnosis. Rates of hospitalization declined past 9 years old.
 [1499]
 Neuromuscular conditions as a primary diagnosis accounted for 0.8% of hospitalizations for any musculoskeletal condition diagnosis and only 0.1% of all hospitalizations for any healthcare condition. (Reference Table 7C.5 PDF [1500] CSV [1501])
Cerebral palsy was diagnosed in two-thirds (65%) of hospital discharges. Spina bifida and muscular dystrophy represented 18% and 7% of discharges, respectively.
 [1503]
 Total charges averaged $75,700 for a mean 6.7-day stay when children and adolescents were hospitalized with a diagnosis of a neuromuscular condition along with other medical conditions. With a primary neuromuscular diagnosis, the stay was longer (7.2 days), and mean charges were higher at $92,000. Mean charges and length of stay were highest for the youngest patients, neonates. Total hospital charges for all primary neuromuscular discharges in 2013 were $377.2 million. (Reference Table 7C.5 PDF [1500] CSV [1501])
 [1505]
Syndromes with musculoskeletal implications include those diagnoses that may result in or be associated with musculoskeletal problems or deformities. The most common syndromes with musculoskeletal implications include Marfan syndrome, Ehlers Danlos syndrome, Down syndrome, and neurofibromatosis. These patients may have musculoskeletal problems including scoliosis, pectus deformities, hip dysplasia, and flatfeet. Patients with neurofibromatosis may have congenital pseudarthrosis of the tibia. Many of these patients will require treatment for these musculoskeletal problems. Treatment, however, must be tailored to each individual patient as these syndromes often affect multiple body systems and require involvement of multiple medical disciplines.
Syndromes with musculoskeletal implications were diagnosed in 383,200 children and adolescent healthcare visits in 2013, of which 126,300 had a primary diagnosis of one of these conditions. About 1 in 10 (9%) children and adolescents with any syndrome with musculoskeletal implications diagnoses were hospitalized (29,800), but less than 1.2% (600) with a primary diagnosis of a syndrome with musculoskeletal implications had a hospital discharge. (Reference Table 7C.1.1 PDF [1463] CSV [1464] and Table 7C.1.2 PDF [1469] CSV [1470])
Male were more likely than females to have a hospital discharge with any syndrome with musculoskeletal implications diagnoses as well as a primary diagnosis. Infants and young children under the age of 5 years had the highest rate of hospitalization for any diagnoses of syndromes with musculoskeletal implications. The number of hospitalizations with a primary diagnosis was too small for analysis by age.
 [1507]
 Any diagnoses of syndromes with musculoskeletal implications accounted for 5.4% of hospitalizations for any musculoskeletal condition diagnosis, and 0.4% of all hospitalizations for any healthcare condition. Hospitalizations with a primary diagnosis were 0.1% of all musculoskeletal diagnoses. (Reference Table 7C.6 PDF [1508] CSV [1509])
Total charges averaged $78,500 for a mean 7.9-day stay when children and adolescents were hospitalized with a diagnosis of a syndrome with musculoskeletal implications condition along with other medical conditions. The number of hospitalizations with a primary diagnosis of a syndrome with musculoskeletal implications was too small for analysis of hospital charges. (Reference Table 7C.6 PDF [1508] CSV [1509])
 [1511]
 Athletic participation by children and adolescents increased dramatically between 1997 and 2008,1 with participation declining slightly since the 2008 peak.2 Over the past several years, participation in some sporting activity has slowly increased with 69% of children playing a sport at least one day during the year in 2017. However, team sports participation regularly continues to slowly decline with only 37% of children consistently participating in a team sport.3
Since the late 1990s, athletic specialization has increased, resulting in earlier focus on single sports. As a result, there has been a commensurate increase in pediatric sports-related injuries, both acute and related to chronic overuse.4 Pediatric and adolescent athletes are anatomically and physiologically different from adult athletes, and therefore are at risk to sustain different injuries. Coordination and mechanics are less developed in pediatric athletes, placing them at greater risk for injuries related to falls and collisions. Growing athletes are at risk for most of the same injuries as adult athletes but are uniquely susceptible to injuries about the physeal (growth plates in bones that undergo endochondral ossification) and growth cartilage. Not only do these physeal and apophyseal injuries5 require unique treatments, but they may also result in growth derangement that can lead to deformity and have long-term consequences. Adolescent female athletes also have been shown to have a two- to nine-fold greater risk of knee injuries, which may be related to age and gender-specific differences in anatomy, neuromuscular control, and hormone levels.6 Common pediatric sports-related injuries include anterior cruciate ligament (ACL) and meniscal tears, tibial eminence fractures, osteochondritis desiccans lesions, patellofemoral instability, Osgood Schlatter syndrome, little league shoulder and elbow, pelvic avulsion fractures, and distal radius epiphysitis.
On average across the years from 2014 to 2016, 1.6 million injuries per year related to team or individual sport activities occurred to children and adolescents age 20 years and younger. Data reported is from consumer product-related injuries occurring in the United States from a statistically valid sample of emergency departments collected by the United States Consumer Product Safety Commission, National Electronic Injury Surveillance System. Data shown for sports injuries are not included in the overall total for musculoskeletal conditions among children and adolescents, on the assumption it duplicates numbers found in the emergency department database based on ICD-9-CM codes and used in the trauma injuries section.
 [1513]
 Males report injuries at twice the rate as females (64% of injuries), with the highest number of injuries occurring in the junior high (10 to 13 years) and high school (14 to 17 years) ages. (Reference Table 7C.7.1 PDF [1514] CSV [1515])
Team sports, both organized and informal, accounted for just under one-half (46%, or 740,200 injuries) of all sports-related injuries reported. Basketball had the highest number of team sport related injuries at 33% and was closely followed by football at 31%.
 [1517]
 Team sport injuries to males were three times the number reported for females (75%). The only sport in which female injuries outnumber male injuries is volleyball. Nearly half (45%) of team sport injuries to children and adolescents occurred during the high school years (age 14 to 17 years), with another 34% in the junior-high age range of 10 to 13 years. (Reference table 7C.7.1 PDF [1514] CSV [1515])
The most common musculoskeletal injury incurred was a sprain or strain, accounting for 47% of team sport injuries. Volleyball had the highest proportion of sprains and strains, followed by basketball. Baseball led in contusion injuries, while fractures occurred most frequently in football, followed by soccer and hockey (including field, ice, and roller hockey). Only 1% of team sport injuries were serious enough to result in hospitalization. (Reference table 7C.7.2 PDF [1518] CSV [1519])
 [1521]
 Individual sports injuries accounted for 54% of total injuries reported (872,900). Almost one in five injuries (18%) occurred while riding bicycles or other nonmotorized wheeled equipment such as tricycles and scooters. These injuries occurred most frequently to children ages 10 to 13 years. Injuries on playground equipment were the second highest type of individual sport injuries, accounting for 15% of all injuries. Playground equipment injuries occurred almost exclusively to children younger than 14 years old and most commonly in children aged 5 to 9 years old. Skating injuries (which includes roller and ice skates, inline skates, and skateboards) were the cause of 11% of individual sport injuries.
 [1523]
 Females accounted for a larger share of individual sport injuries (45%) than in team sports. Still, the only activities in which females had a significantly higher number of injuries than males were in gymnastics/cheerleading/dancing as well as track and field. (Reference Table 7C.7.1 PDF [1514] CSV [1515])
Fractures and sprains/strains each accounted for one-third of all individual sport activity injuries (36% and 36% respectively). However, the type of musculoskeletal injury varied substantially with the type of activity. Fractures resulted from playground equipment injuries more than one-half the time (57%), with a high share of fractures in snow sports (44%) and skating injuries (42%) as well. Sprains/strains occurred in almost two-thirds of track and field injuries (62%), and there were a higher share of sprains/strains occurring in fitness training (59%) and gymnastics/cheerleading/dancing (57%) as well. The most common type of injury reported from bicycle/wheeled equipment was contusions (44%). Nearly 3% of individual sport injuries resulted in hospitalization. (Reference table 7C.7.2 PDF [1518] CSV [1519])
 [1525]
Pediatric musculoskeletal neoplasms are relatively rare. They can be categorized as either benign or malignant, as has been done for this document. Musculoskeletal neoplasms are often also categorized by the type of tissue they produce or from which they are derived.
The most common types of tumors that affect the musculoskeletal system are cysts, bone-producing tumors, cartilage tumors, fibrous tumors, soft tissue tumors, and peripheral neuroectodermal tumors. Most benign tumors, such as nonossifying fibromas, result in little or no disability and require no treatment. Other benign tumors may require surgical intervention. Painful or prominent osteochondromas may require surgical excision. Simple bone cysts can weaken the bone, increase fracture risk, and may require surgical treatment in order to resolve the cyst and prevent or treat fracture. Other benign tumors include lipomas, fibrous dysplasia, enchondromas, osteoid osteoma, and osteoblastomas.
The most common malignant tumors of the pediatric musculoskeletal system are osteosarcoma, Ewing sarcoma/peripheral neuroectodermal tumor, rhabdomyosarcoma, and synovial cell sarcoma. Osteosarcoma is the most common malignant bone tumor in patients under 20 years of age, with an incidence of approximately 29 per 1 million people. Ewing sarcoma is the second most common pediatric malignant musculoskeletal tumor and is part of the Ewing family of tumors, which includes peripheral neuroectodermal tumors. Most of the tumors in the family have a genetic translocation.1 Long-term survival of patients with both tumors has drastically improved with the routine use of chemotherapy.
For additional information on musculoskeletal tumors in children, you can refer to the Tumors [1529] section of this report.
Neoplasms, including both benign and malignant, were diagnosed in 155,500 children and adolescent healthcare visits in 2013, of which 43,100 had a primary diagnosis of a neoplasm. About one in seven (5%) of children and adolescents with any neoplasm diagnoses were hospitalized (23,000), but fewer than 1% of hospital discharges had a primary diagnosis of neoplasm (3,600). (Reference Table 7C.1.1 PDF [1463] CSV [1464] and Table 7C.1.2 PDF [1469] CSV [1470])
Slightly more males than females had a hospital discharge with any or a primary neoplasm diagnosis. For each year from birth until 18 years, there is an increasing incidence of neoplasm prevalence resulting in hospitalization.
 [1531]
 Any diagnoses of neoplasm accounted for 4.4% of hospitalizations for any musculoskeletal condition diagnosis, and 0.4% of all hospitalizations for any healthcare condition. Hospitalizations with a primary diagnosis of neoplasm accounted for 0.7% of all musculoskeletal diagnoses and only 0.1% of hospitalizations for any health condition diagnosis. Benign neoplasms accounted for 59% of neoplasm diagnoses, but 87% of hospitalized diagnoses are malignant. (Reference Table 7C.8 PDF [1532] CSV [1533])
 [1535]
 Total charges averaged $48,500 for a mean 4.6-day stay when children and adolescents were hospitalized with any diagnosis of neoplasm along with other medical conditions. With a primary neoplasm diagnosis, the stay was slightly longer (6.4 days), and mean charges were higher at $93,100. Mean length of stay was highest for children less than one year of age; however, hospital charges were highest for children ages 5 to 9 years old. Total hospital charges for primary neoplasm diagnosis discharges in 2013 were $335.2 million. (Reference Table 7C.8 PDF [1532] CSV [1533])
 [1537]
Skeletal dysplasias, also referred to as osteochondrodysplasias, are a heterogeneous group of disorders that affect the growth and development of bone and cartilage. There is great variability of severity and involvement ranging from neonatal lethality to mild growth differences noted incidentally in adulthood. Hundreds of such dysplasias have been described, but most are so rare that true incidence is difficult to estimate.1 The most common diagnoses included in this category are chondrodysplasia, achondroplasia, hypochondroplasia, dwarfism, congenital absence of rib, osteogenesis imperfecta, osteopetrosis, as well as other dysplasias. The overall incidence of skeletal dysplasias is two to five per 10,000 live births.2 Despite their relative rarity, many patients with these disorders require extensive medical and surgical treatments throughout their childhood and into adulthood.
Skeletal dysplasias were diagnosed in 235,800 children and adolescent healthcare visits in 2013, accounting for the primary diagnosis in 47,500 of these visits. (Reference Table 7C.1.1 PDF [1463] CSV [1464] and Table 7C.1.2 PDF [1469] CSV [1470])
Males were slightly more likely to be hospitalized for both any musculoskeletal diagnosis as well as a primary diagnosis of dysplasia. Children from age 1 to 4 were most likely to be hospitalized with any diagnosis while children from 1 to 4 years and 10 to 17 years were equally likely to be hospitalized with a primary diagnosis of skeletal dysplasia. (Reference Table 7C.9 PDF [1538] CSV [1539])
 [1541]
 Skeletal dysplasias as a primary diagnosis accounted for 0.3% of hospitalizations for any musculoskeletal diagnosis and 0.02% of hospitalizations for any condition. However, it is often the case that the primary diagnosis would reflect the problem associated with the condition rather than the condition itself. For example, with platyspondyly (flattened spinal bones), curvature of the lower back (lordosis) would be the diagnosis rather than dysplasia.
Total charges averaged $106,100 for a mean 10-day stay when hospitalized with a diagnosis of skeletal dysplasia with other medical conditions. With a primary diagnosis of skeletal dysplasia, the average stay was 8.6 days and cost $96,500. Mean length of stay and charges were highest in neonates. Total charges in 2013 were $144.8 million. (Reference Table 7C.9 PDF [1538] CSV [1539])
 [1543]
 An estimated 300,000 children in the Unites States are diagnosed with juvenile arthritis or another chronic rheumatologic condition such as systemic lupus erythematosus, juvenile dermatomyositis, or linear scleroderma.1 These conditions generally require chronic care and, without appropriate treatment, can lead to significant disability.
Juvenile idiopathic arthritis (JIA) (formally called juvenile rheumatoid arthritis [JRA] or juvenile chronic arthritis [JCA]) is estimated to affect 1 in 1,000 children in the United States.2 JIA is diagnosed in a child younger than 16 years of age with at least six weeks of persistent arthritis. There are seven distinct subtypes, each having a different presentation and association to autoimmunity and genetics.3 Certain subtypes are associated with an increased risk of inflammatory eye disease (uveitis). Understanding the differences in the various forms of JIA, their causes, and methods to better diagnose and treat these conditions in children is important to future treatment and prevention. Among all subtypes, approximately half of children with JIA still have active disease after 10 years.4
There are several other causes of acute or chronic arthritis in children that do not meet the diagnostic criteria of JIA, including, but not limited to, rheumatic fever, Reiter syndrome/reactive arthritis, and the arthritis associated with inflammatory bowel disease.
Approximately 15% to 20% of cases of systemic lupus erythematosus (SLE) in the United States occur in children younger than 18 years of age. SLE is a chronic autoimmune condition characterized by the production of autoantibodies leading to immune complex formation and end organ damage. For reasons that remain unclear, pediatric SLE is associated with increased disease severity, increased short- and long-term morbidity, and mortality as compared to adult-onset SLE.5
Juvenile dermatomyositis is a chronic inflammatory condition characterized by inflammation of the skin and muscle. Estimated incidence of the disease in the United States is 0.5 per 100,000 people; the prevalence is not known.2
The sclerodermatous conditions are defined in part by the common clinical feature of tightening or hardening of the skin. Systemic scleroderma, also called diffuse cutaneous systemic scleroderma, is rare in childhood, accounting for only 2% to 3% of all cases of this condition, which has an estimated prevalence of 24 cases per 100,000 people. Linear scleroderma is the most common subtype of scleroderma diagnosed in the pediatric population. It is characterized by a linear streak of sclerosis typically involving an upper or lower extremity. 2
In 2006, the CDC Arthritis Program finalized a case definition for ongoing surveillance of pediatric arthritis and other rheumatologic conditions (SPARC) using the current ICD-9-CM diagnostically based data systems.6 In response to the variations in conditions that some felt should be included but were not, CDC generated estimates are not included in the case definition.
Rheumatologic conditions were diagnosed in 529,500 children and adolescent healthcare visits in 2013, of which 390,400 had a primary diagnosis of a rheumatologic condition. Only 2% of children and adolescents with any rheumatologic diagnoses were hospitalized (11,900), while less than 1% (3,700) with a primary diagnosis of a rheumatologic condition had a hospital discharge. Over one-half (58.3%) of children and adolescents with a rheumatologic condition diagnosis were seen in physicians’ offices. (Reference Table 7C.1.1 PDF [1463] CSV [1464] and Table 7C.1.2 PDF [1469] CSV [1470])
Females were hospitalized with a rheumatologic condition at nearly three times the rate of males, both for any diagnoses and as a primary diagnosis. As children age, there is a higher incidence of a rheumatologic condition diagnosis.
Any diagnoses of a rheumatologic condition accounted for 2.4% of hospitalizations for any musculoskeletal condition diagnosis, and 0.2% of all hospitalizations for any healthcare condition. Hospitalizations with a primary diagnosis of a rheumatologic condition were 0.7% of all musculoskeletal diagnoses and 0.1% of hospitalizations for any health condition diagnosis. (Reference Table 7C.10 PDF [1544] CSV [1545])
 [1547]
 Total charges averaged $47,500 for a mean 5.1-day stay when children and adolescents were hospitalized with any diagnosis of a rheumatologic condition along with other medical conditions. With a primary rheumatologic diagnosis, the stay was shorter (4.4 days), and mean charges slightly lower at $42,500. Males as well as children 18 to 20 years old had slightly longer average hospital stays and average hospital charges. Total hospital charges for primary rheumatologic condition diagnosis discharges in 2013 were $157.3 million. (Reference Table 7C.10 PDF [1544] CSV [1545])
 [1549]
 Many medical problems have musculoskeletal implications. This section discusses some of the more common of those diagnoses, including hemophilia, sickle cell disease, and endocrine and metabolic disorders such as rickets and lysosomal storage disorders.
Hemophilia is a genetic disorder characterized by abnormal blood clotting secondary to congenital deficiency of clotting factors VIII or IX. It may result in musculoskeletal problems by way of intramuscular hemorrhage and hemophilic arthropathy. Hemophilic arthropathy occurs through spontaneous bleeding into a weight-bearing joint, resulting in cartilage degeneration and arthrosis as well as asymmetric growth stimulation and deformity.
Sickle cell disease is inherited in an autosomal dominant fashion and is characterized by production of abnormal hemoglobin. This results in reduced oxygen delivery to tissues and can lead to multiple musculoskeletal manifestations, including painful bone infarcts, osteomyelitis, avascular necrosis, and vertebral compression fractures.
Metabolic bone diseases, such as rickets, occur due to abnormal calcium and phosphate metabolism. Rickets occurs in many forms, including vitamin D deficiency, vitamin D resistance, hypophosphatemia rickets, and renal osteodystrophy. Regardless of the cause, the result is inadequate calcification of bone and cartilage, resulting in bone pain and deformity.
The most common lysosomal storage disease is Gaucher’s disease, an autosomal recessive condition characterized by a deficiency in the enzyme beta-glucocerebrosidase. In Gaucher’s disease, there is an accumulation of glucocerebrosides, which contain glucose, in the tissues. This results in musculoskeletal manifestations that include bone deformity secondary to bone marrow infiltration, avascular necrosis, bone pain, pathologic fracture, and osteomyelitis.
Medical problems with musculoskeletal implications were diagnosed in 566,700 children and adolescent healthcare visits in 2013, of which 24% (134,000) had a primary diagnosis of a medical problem with musculoskeletal implications condition. One in ten children and adolescents with any medical problem diagnoses were hospitalized (54,700), while 3.5% (4,700) with a primary diagnosis had a hospital discharge. (Reference Table 7C.1.1 PDF [1463] CSV [1464] and Table 7C.1.2 PDF [1469] CSV [1470])
Males and females were hospitalized with a medical problem with musculoskeletal implications in about the same numbers, but with a primary diagnosis, males were more likely to be hospitalized. The highest rate of hospitalization, when compared to other MSK conditions, was for adolescents age 14 to 20 years of age.
 Implication Diagnosis, by Sex and Age, United States 2013") [1552]
[1552] Any diagnoses of a medical problem with musculoskeletal implications accounted for 10.9% of hospitalizations for any musculoskeletal condition diagnosis, and less than 1% of all hospitalizations for any healthcare condition. Hospitalizations with a primary diagnosis of a medical problem with musculoskeletal implications were less than 1% of all musculoskeletal diagnoses and 0.1% of hospitalizations for any health condition diagnosis. However, it is often the case that the primary diagnosis would reflect the problem associated with the condition rather than the condition itself. For example, a child with rickets is going to be hospitalized for a lower extremity deformity rather than for rickets. (Reference Table 7C.11 PDF [1553] CSV [1554])
Rickets accounted for 45.5% of all healthcare visits for medical problems with musculoskeletal implications, but 72% of the hospitalized cases. (Reference Table 7C.1.1 PDF [1463] CSV [1464])
Total charges averaged $119,200 for a mean 11.9-day stay when children and adolescents were hospitalized with any diagnosis of a medical problem with musculoskeletal implications along with other medical conditions. With a primary medical problem with musculoskeletal implications diagnosis, the stay was shorter (3.2 days), and mean charges about a fourth that of medical problems as a contributing condition ($29,500).
 Implication Diagnosis, by Sex and Age, United States 2013") [1556]
[1556] When hospitalized with any diagnosis of a medical problem with musculoskeletal implications along with other medical conditions, neonates and children less than 1 year of age had significantly longer stays and higher charges than other age groups, primarily due to cases of rickets. Total hospital charges for primary medical problem with musculoskeletal implications diagnosis discharges in 2013 were $138.7 million. (Reference Table 7C.11 PDF [1553] CSV [1554])
 [1558]
 Musculoskeletal pain syndromes, including amplified musculoskeletal pain or juvenile fibromyalgia, chronic regional pain syndrome (reflex sympathetic dystrophy), benign hypermobility, and benign limb pains, are common diagnoses in the pediatric population. A systematic review examining the prevalence of chronic musculoskeletal pain found a range of prevalence rates between 4% and 40% in children. Rates were generally higher in girls and increased with age.1 It is estimated that 5% to 8% of new patients presenting to North American pediatric rheumatologists have a musculoskeletal pain syndrome.2
Amplified musculoskeletal pain can be localized or diffuse. Diffuse pain involving at least three major body parts for at least 3 months is seen in the diffuse type. Fibromyalgia is a subset of diffuse amplified musculoskeletal pain. Patients also typically have sleep disturbance and other somatic complaints, such as headaches and abdominal pain. Reflex sympathetic dystrophy (RSD), now called complex regional pain syndrome (CRPS), is a form of amplified pain in which autonomic dysfunction develops in an extremity, often following injury or trauma. The affected limb becomes swollen, discolored, and cold, and the area can be very painful with light touch (allodynia). The recommended treatment for these conditions includes restoring normal sleep patterns, a therapy program with a focus on exercise and desensitization, and cognitive behavioral therapy. Some patients require treatment in an in-patient setting. For further information see Childhood RND Educational Foundation, Inc., available at StopChildhoodPain.org [1559].
Benign limb pains, sometimes referred to as “growing pains,” are most common in children age 2 to 5 years. Children with benign limb pains tend to complain of pain at night, often awaking from sleep due to pain. These symptoms tend to resolve with age.
Benign hypermobility is diagnosed in patients who have hypermobile joints3, without an underlying connective disuse disorder. This condition is common, affecting 8% to 20% of White populations. Anterior knee pain and back pain are more common in hypermobile vs non-hypermobile individuals.2
Pain syndromes were diagnosed in more than 2.7 million children and adolescent healthcare visits in 2013, of which 63% (1.8 million) had a primary diagnosis of a pain syndrome. Less the 1% of children and adolescents with any pain syndrome diagnoses were hospitalized (20,000), while a tiny fraction (1,700) with a primary diagnosis had a hospital discharge. Two-thirds (65%) of children and adolescents with a pain syndrome diagnosis were seen in physicians’ offices. (Reference Table 7C.1.1 PDF [1463] CSV [1464] and Table 7C.1.2 PDF [1469] CSV [1470])
Females were hospitalized with a pain syndrome diagnosis in slightly higher numbers than males, both for any diagnoses and as a primary diagnosis. Pain syndrome diagnoses increase as a contributing diagnosis in older children, but as a primary diagnosis was greatest between 14 and 17 years old followed by 5 to 13 years old.
 Pain Syndrome Diagnosis, by Sex and Age, United States 2013") [1561]
[1561] Any diagnoses of pain syndrome accounted for just over 4% of hospitalizations for any musculoskeletal condition diagnosis, and 0.3% of all hospitalizations for any healthcare condition. Hospitalizations with a primary diagnosis of pain syndrome were 0.3% of all musculoskeletal diagnoses and a tiny portion of hospitalizations for any health condition diagnosis. (Reference Table 7C.12 PDF [1562] CSV [1563])
Total charges averaged $48,900 for a mean 6.1-day stay when children and adolescents were hospitalized with any diagnosis of a pain syndrome along with other medical conditions. With a primary pain syndrome diagnosis, the stay was shorter (3.1 days), and mean charges about half that of pain syndrome as a contributing condition ($25,800).
Sex was not a significant factor in length of hospital stay and average charges for a medical problem with a musculoskeletal pain syndrome diagnosis. In patients with a primary diagnosis of a pain syndrome, the average length of hospital stays (4.5 days) and average cost ($40,000) was highest among patients ages 10 to 13. Total hospital charges for primary pain syndrome diagnosis discharges in 2013 were $43.9 million. (Reference Table 7C.12 PDF [1562] CSV [1563])
 Pain Syndrome Diagnosis, by Sex and Age, United States 2013") [1565]
[1565]
An estimated 25,000 patients were seen in hospitals and emergency departments in 2013 for treatment of developmental dysplasia (DDH) of the hip.1 While DDH can often be successfully treated in childhood, it is now understood that even with successful treatment, residual effects can have a huge impact on the musculoskeletal burden of osteoarthritis in adulthood. One in four people are likely to develop symptomatic hip osteoarthritis in their lifetime.2 Thus, total hip arthroplasty is one of the most common musculoskeletal surgeries performed in the United States, with 343.6 thousand procedures performed in 2013.3 It is now also recognized that the underlying etiology of hip arthritis is often related to childhood developmental hip conditions such as Developmental Dysplasia of the Hip, Legg Calves Perthes disease, and Slipped Capital Femoral Epiphysis.4 A United States study of patients less than 50 years of age noted radiographic findings of developmental dysplasia of the hip in 23%.5. Long term outcome studies of surgeries to treat residual hip dysplasia in adults shows 74% native hip survival at 18 years.6 This long term impact of developmental hip conditions and the ability of hip hip preservation surgeries to prevent or delay onset of arthritis underscore the importance of early diagnosis and long term follow up into adulthood.
Other conditions commonly thought of as only affecting children, such as cerebral palsy, osteogenesis imperfecta, and spina bifida, are now being seen more than ever in adults thanks to the tremendous progress in care leading to longer life expectancy. Remarkably, some people with Duchenne’s muscular dystrophy are now surviving into early adulthood. Concomitant with this success has come a host of new issues concerning the transition of care to adulthood and the aging process.
Adults with these conditions are disproportionately affected by the aging process. Some issues are clear. For example, those with mobility challenges have difficulty participating in fitness regimens, leading to more sedentary lifestyles and secondary issues such as obesity, diabetes, and heart disease. Other issues are less clear. Adults with aftereffects of childhood musculoskeletal disorders have more difficulty accessing preventative care. Even more subtle are issues related to lack of providers skilled in treating adults with the sequela of childhood issues and psychosocial challenges.
The medical community needs to investigate whether the needs of patients are being met and if they are reaching full potential as productive adults. The margin of function which allows individuals to live independently is often very small. Early or more pronounced reduction in function associated with aging may make the difference in whether a care giver is required for activities of daily living or there is independent living.
Research into the Health-Related Quality of Life, prevalence of disease, potential to avoid disease, and availability of care, including preventative care, is required.
In 2013, total hospital charges for children and adolescents age 20 years and younger with a primary musculoskeletal-related diagnosis were $7.4 billion. Musculoskeletal trauma (41%) and deformity (37%) were the major contributors to total hospital charges, but all conditions contribute to the overall economic impact of musculoskeletal conditions in this age group. Furthermore, while musculoskeletal condition hospital charges represent 5.2% of total charges for all medical conditions for the age 20 years and younger age group, the number of discharges represent only 2% of total hospital discharges for any medical condition in this age group, indicating that musculoskeletal conditions may be more expensive to treat than many other childhood conditions. (Reference Table 7C.13 PDF [1568] CSV [1569])
 Related Diagnosis, United States 2013") [1571]
[1571] It is important to note that the overall cost of musculoskeletal conditions in the 20 years and younger population is much greater than just hospital charges. First, the $7.4 billion includes only hospitalizations with a primary, or first, diagnosis in the databases, representing less than 2% of 2013 healthcare visits with any musculoskeletal condition diagnosis. Not included in this burden are expenditures for visits to emergency departments, outpatient clinics, and physicians’ office, as well as other medical care expenditures such as physical therapy, rehabilitation, and medications.
 [1573]
 While gender is not a factor in the distribution of hospital charges, age is a major contributor. Children in the middle years of childhood, especially ages 10 to 13 years, have a higher share of total hospital charges (16%) due to musculoskeletal conditions than any other age group. Musculoskeletal condition hospital charges are also a higher share for those age 14 to 17 years (14%) and ages 5 to 9 years (8.6%).
 [1575]
 To fully understand the burden of musculoskeletal diseases on children and adolescents, it is mandatory that data be available on prevalence, healthcare needs, cost associated with treatment, limitations due to musculoskeletal conditions, and overall impact these conditions have on the lives of children and adolescents. The HCUP KID, HCUP NIS, and HCUP NEDS databases provide a tremendous asset in understanding hospitalizations for this analysis, but they, too, have limitations. First among these is the inability to truly determine primary cause for visits, as multiple diagnosis codes may be included with each record, with no way of knowing which is the primary diagnosis. In addition, many healthcare visits are to a physician’s office, and the database for these visits National Ambulatory Medical Care Survey (NAMCS) is small and often contains insufficient cases (<35) for reliable analysis even when merging several years of data. This is particularly true for the very young patients (0 to 5 years) and for rare conditions. Injuries occur in enough numbers that this is not a problem. However, many other conditions had low numbers.
A second key challenge is ensuring that children with chronic medical and musculoskeletal problems have access to care, particularly for those with Medicaid or other government-funded insurance. Low physician reimbursement by government insurance results in fewer physicians who are willing or able to care for these patients, making access to needed specialty care difficult. Additionally, pediatric subspecialists who take care of musculoskeletal conditions are typically located at large children’s hospital in more populous cities, further reducing access to care for those in rural areas. Because of the unique nature of pediatric musculoskeletal problems and treatments, many adult subspecialists who may be more accessible are unable or unwilling to treat pediatric patients.
A third challenge is the need to track pediatric patients into adulthood to determine lifelong burden of their pediatric musculoskeletal disease. Once a child turns 18 years, the system loses them as they become more mobile and move on to other caregivers. Further, they may lose parental insurance or their Medicaid coverage. A better way to obtain long-term follow-up on their history and long-term outcomes of treatment of pediatric musculoskeletal disease is needed.
Poor bone health is being recognized as a key problem in pediatric musculoskeletal disease, one that will last a lifetime. Key factors leading to poor bone health are Vitamin D deficiency and childhood obesity. The current healthcare data system makes it very difficult to quantify the burden of these problems because they are infrequently evaluated as the primary diagnosis. Additionally, patients are rarely admitted or discharged for treatment specific for these diagnoses. In the future, methods for estimating the incidence of these diagnoses more accurately and assessing their contribution to musculoskeletal disease is necessary. Education of the individual, family, and society about the burden of obesity and Vitamin D deficiency is necessary to improve overall bone health in the United States.
Quality of life assessments in children and adolescents that allow better measure of the personal impact of pediatric musculoskeletal disease is lacking. In assessment of musculoskeletal disease for adults, lost wages and lost workdays are used to quantify burden. There is no corresponding way to measure burden in children. Currently, it is quantified indirectly by measuring lost wages and lost workdays for the child’s caregiver. Better methods for quantifying indirect burden of pediatric musculoskeletal disease is needed.
Better long-term follow-up data on pediatric musculoskeletal conditions is needed. Once patients reach adulthood, it becomes difficult for the physician who cared for their musculoskeletal conditions to keep track of them. This results in difficulty understanding adult manifestations of pediatric musculoskeletal conditions. On a global basis, the disability-adjusted life year (DALY), developed in the 1990s as a way of comparing the overall health and life expectancy of different countries, is used as a measure of overall disease burden expressed as the number of years lost due to ill-health, disability or early death. Disabilities incurred in childhood, expressed in the DALY, would provide greater understanding of the lifelong burden of these conditions.
MUSCULOSKELETAL INFECTIONS
Osteomyelitis: 730.0, 730.1, 730.2, 730.8, 73090, 73091, 73092, 73093, 73094, 73095, 73096,73097
Septic arthritis: 711.0, 711.4
Soft tissue infections (infective myositis): 72800, 72886
Lyme disease: 08881
Tuberculosis: 015
DEFORMITY
Upper Extremity:
Polydactyly: 75500, 75501
Syndactyly: 75510, 75511, 75512
Reduction deformities: 755.2
Other congenital anomalies upper limb: 755.5, 736.0, 736.1, 736.2, 73690, 75489, 75681, 75689
Lower Extremity:
Polydactyly: 75502
Syndactyly: 75513, 75514
Reduction deformities: 755.3
Other congenital anomalies lower limb: 755.6
Congenital deformities: 754.4, 754.59, 754.6, 754.7, 72781, 73400, 736.7, 736.8
Hip and Pelvis:
Congenital deformity of hip joint: 75561, 75562, 75563
Hip joint acquired: 736.3, 73220, 73860
Developmental dysplasia: 754.3
Spine and Pelvis:
Of spinal cord: 742.5
Of vertebral column: 737, 73850, 73200, 75420, 756.1
Other and Unspecified:
Congenital deformities: 754.8, 75540, 75580, 75590, 75682, 75690, 75689
TRAUMA: Fractures, dislocation, sprains and strains, open wound, crushing injury, contusion, traumatic compartment syndrome, unspecified injuries, injuries to nerve roots and spinal plexus
Upper Extremity: 810, 811, 812, 813, 814, 815, 816, 817, 818, 819, 831, 832, 833, 834, 840, 841, 842, 880, 881, 882, 883, 884, 885, 886, 887, 90520, 923, 927, 95891, 95920, 95930, 95940, 95950
Lower Extremity: 820, 821, 822, 823, 824, 825, 826, 827, 828, 829, 836, 837, 838, 844, 845, 90530, 90540, 924, 928, 95960, 95970, 95892
Hip and Pelvis: 835, 843, 84850, 808, 959.1, 953
Spine and Trunk: 805, 806, 807, 846, 847, 809, 875, 876, 90510, 92200, 92210, 92230, 92231, 92232, 92233, 92280, 92290, 926.1, 92680, 92690, 952
Birth Trauma: 767
Child Abuse: 995.5
NEUROMUSCULAR CONDITIONS
Cerebral palsy (CP): 343
Spina bifida (SB): 741
Muscular dystrophy (MD): 359
Charcot-Marie-Tooth disease (CMT): 35610, 35620
Other: 334, 335, 33600, 336
SYNDROMES WITH MUSCULOSKELETAL IMPLICATIONS
Marfan sydrome/Ehlers Danlos syndrome/other connective tissue disorders: 75982, 75683
Down's syndrome: 75800
Neurofibromatosis (NF): 23770, 23771, 23772
SPORTS INJURIES (Sports injuries data is from NEISS and does not use ICD-9 codes.)
SKELETAL DYSPLASIAS
Dysplasias: 75989, 65580, 73399, 39330
Chondrodystrophy/achondroplasia/hypochondroplasia: 75640
Dwarfism (thanatophoric dysplasia): 25940, 75651
Congenital absence rib: 75630
Osteogenesis imperfecta: 75651
Osteopetrosis: 75652
Other: 75654, 75655, 75656, 75659
NEOPLASMS
Benign:
Benign lesion of bone/cartilage: 213
Lipoma: 21400, 21410, 21420, 21430, 21480, 21490
Benign lesion of CT/ST: 215
Malignant:
Malignancy of bone/cartilage: 170
Malignancy of CT/ST: 171
RHEUMATOLOGIC CONDITIONS
Rheumatic fever: 39000, 39092
Reactive arthritis/Reiter disease (underlying disease, no principal diagnosis): 711.1
Juvenile idiopathic arthritis: 714.3
Ankylosing spondylitis and inflammatory spondylopathies: 720
Psoriatic arthritis: 696
Arthropathy of inflammatory bowel disease: 71310
Systemic lupus erythematosus: 71000
Juvenile dermatomyositis: 71030
Localized scleroderma: 70100, 71010
MEDICAL PROBLEMS WITH MSK IMPLICATIONS
Hemophilia: 00286
Sickle cell: 28260
Endocrine and metabolic disorders: 75650
Gaucher disease (lipidoses/lysosomal storage disorders): 27270
Osteoporosis: 733.0
Hyperthyroid (thyrotosicosis w/wo goiter): 242
Rhabdomyolysis: 72888
Other conditions: 28610, 25890
Rickets (Vitamin D deficiency, phosphorus, and calcium metabolism disorders): 268, 275.3, 275.4
PAIN SYNDROMES
Amplified musculoskeletal pain/Juvenile primary fibromyalgia syndrome: 30789, 72910
Reflex sympathetic dystrophy (complex regional3722 pain syndrome/CRPS): 337.2
Benign hypermobility/hypermobility syndrome: 72850
Benign limb pains (“growing pains”): 719.4
Racial and ethnic disparities in healthcare have been well established in the literature. Reasons for disparities include cultural beliefs, socioeconomic differences, language barriers, and discrimination or bias in the healthcare system. A 2003 IOM report confirmed racial and ethnic minorities receive lower quality healthcare and have poorer outcomes than their Caucasian counterparts.1 A 2019 Medicare study found significantly decreased rates of surgical intervention among racial and ethnic minorities.2 The US Census Bureau reported that minorities comprised 38.4% of the population in 2015; by 2050, it is projected that non-Hispanic whites will no longer be the majority group in the United States.3 The increasing minority population has hastened the need to define, understand, and reduce these differences. Furthermore, disparities in healthcare and health outcomes will become increasingly economically burdensome.
Disparities in musculoskeletal care has been a topic of increased interest in the past decade. Schoenfeld et al et al reported that racial and ethnic minorities are at increased risk of complications and/or mortality after orthopaedic surgical intervention.4 Several other studies have demonstrated decreased utilization and access to orthopaedic care among minorities, such as joint replacement and spinal surgery.
Race and ethnicity also have an impact on the prevalence of certain musculoskeletal conditions. Ankylosing spondylitis and osteoporosis are examples of conditions for which ethnicity is a strong risk factor. Further research is needed to determine whether several other musculoskeletal conditions are impacted by ethnicity.
Racial/ethnic groups in the BMUS report are defined based on the major databases analyzed for this report. The six groups included in the databases are white, black, Hispanic, Asian/Pacific Islander, Native American, and other. Hispanic ethnicity applies to persons of all races, therefore they are identified by their ethnicity, while other persons are defined as non-Hispanic white, non-Hispanic black, and non-Hispanic other. Due to small sample sizes, non-Hispanic other persons include Asian/Pacific Islander, Native American, and others.
To broaden the scope of ethnic and racial differences and disparities, a literature search was also conducted. Findings on the impact of musculoskeletal diseases on more specific races and ethnic groups are discussed by condition. Data findings are presented to provide a snapshot of differences and disparities. However, the NEDS database, the largest database, does not include a race/ethnicity variable, thus the importance of differences in emergency department visits is unavailable.
Non-Hispanic white persons report experiencing more musculoskeletal conditions in the previous year than members of other racial/ethnic groups. In 2015, 54.5% of non-Hispanic white persons reported they had at least one musculoskeletal condition, compared to 46.4% of non-Hispanic blacks, 38.6% of non-Hispanic others, and 40.6% of persons of Hispanic ethnicity. Chronic joint pain was the most frequently mentioned condition among all persons, with knee pain the most common joint. Non-Hispanic black persons reported back pain radiating down the leg (11.0%) at nearly the same rate as non-Hispanic white persons (11.4%), and a slightly higher rate of carpal tunnel syndrome (4.2% vs. 3.5%). (Reference Table 7D.1 PDF [1576] CSV [1577])
 [1579]
 The burden of musculoskeletal conditions can be defined in economic terms or as it affects those suffering from these conditions. In this section, burden is defined in terms of limitations in activities of daily living (ADL) and as bed or lost work days.
Approximately half of persons reporting musculoskeletal conditions also report they suffer limitations in ADL as a result of these conditions. Among non-Hispanic white persons, 28.7% reported limitations, 24.8% of non-Hispanic black persons have limitations, 18.7% of non-Hispanic other persons, and 18.6% of those of Hispanic ethnicity. Arthritis and back/neck problems are the most common conditions causing limitations. (Reference Table 7D.1 PDF [1576] CSV [1577])
 [1581]
Bed and Lost Work Days
Non-Hispanic black persons report the highest number of bed days in the previous year due to musculoskeletal conditions (24.7 days on average), while those of Hispanic ethnicity lost, on average, the most work days (14.3 days). (Reference Table 7D.1 PDF [1576] CSV [1577])
 [1583]
 [1585]
 Racial disparities in the prevalence of spinal conditions have sparsely been discussed in the literature. Most spinal deformities, including scoliosis, have the higher rates of diagnosis in Caucasians (BMUS). A 2011 retrospective study of patients over 40 years old revealed a prevalence of almost twice the rate of scoliosis in whites compared to African-Americans (AA).1 Specific to adolescent idiopathic scoliosis (AIS), African-American patients had higher curvatures at presentation compared with whites and Hispanics. Therefore, they were more likely to have surgery as their initial treatment.2 For this reason, AA patients may need to present at an earlier age for screening. There is a general belief that genetics play a role in progression of AIS; however, it is unknown which genetic factors or whether race is involved.
Lumbar radiculopathy is a spinal nerve root condition caused by nerve compression, inflammation, or injury in the lumbar spine. In a database study of a young, military population, lumbar radiculopathy was found to be more common among white patients.3 Lumbar spinal stenosis, a narrowing of the spinal canal resulting in nerve compression, is another major cause of low back pain and nerve symptom. Overall, hospitalizations for this condition have been reported to be much more common in whites. Blacks and Hispanics have lower rates of surgical hospitalization for lumbar spinal stenosis than did whites.4 Cultural barriers and attitude toward surgery may be responsible for this difference. In patients undergoing surgery for lumbar stenosis, blacks have higher complication rates, longer hospital stays, less likelihood of discharge home, and short preoperative and postoperative follow-up.5,6 African-American patients also accrue higher hospital-related costs and are prescribed fewer medications.5 Cervical spine surgeries have also been analyzed. African-American patients have higher rates of in-hospital complications and mortality than other ethnicities.7 Much of this difference was likely due to socioeconomic status, insurance status, and access issues.
Ankylosing spondylitis (AS) is an inflammatory arthritis that primarily affects the spine. AS is highly associated with the HLA B27 gene. AS is three times more common in whites than in blacks.8 This is mostly due to the lower prevalence of HLA-B27 in individuals of African descent. A prospective study by Jamalyaria et al compared the disease severity of AS in different ethnic groups. They determined that African-Americans, and Hispanics to a lesser degree, have greater functional impairment, higher disease activity, and greater radiographic severity compared to whites.9 The reason for this could not be determine; however, access to care and genetics are potential factors.
There is conflicting data related to racial differences in back pain. Hootman and Strine reported on 3-month prevalence rates of neck and back pain and found a higher prevalence in whites than other ethnic groups.10 Knox et al analyzed the rates of low back pain in military service members resulting in a visit to a health care provider and reported the highest incidence rates among African-Americans.11 The reason behind the variability is unknown; however, there is believed to be a genetic component. Importantly, a survey study found no significant differences in care-seeking behavior between racial groups for acute or chronic low back pain.12
Non-Hispanic white persons report experiencing neck/cervical and lumbar/low back pain at slightly higher rates in the previous year than members of other racial/ethnic groups. However, back pain with radiating leg pain was reported at similar rates among all racial/ethnic groups except for other/mixed non-Hispanic persons, who reported a lower rate.
In 2015, 36.4% of non-Hispanic white persons reported back pain, compared to 31.0% of non-Hispanic blacks, 30.3% of persons of Hispanic ethnicity, and 26.4% of non-Hispanic others. Low back/lumbar pain was mentioned about twice as often as neck/cervical pain. Respondents are asked if they have radiating leg pain only if the identify suffering from low back pain. Approximately one-third of persons with low back pain also reported radiating leg pain, with non-Hispanic black persons highest (39%) and non-Hispanic other/mixed persons lowest (34%). (Reference Table 7D.2 PDF [1586] CSV [1587])
 [1589]
 Non-Hispanic whites (18.4 per 100 persons) were slightly more likely to seek healthcare for treatment of low back/lumbar pain in 2013 than non-Hispanic blacks (17.1/100) and Hispanics (14.2/100). However, non-Hispanic others/mixed race were much less likely to seek healthcare for back pain (7.3/100). Rates for non-Hispanic whites (6.2/100) and non-Hispanic others (6.0) were similar for healthcare visits for neck/cervical pain, but lower for non-Hispanic blacks (4.5) and Hispanics (3.0). (Reference Table 7D.2 PDF [1586] CSV [1587])
 [1591]
 Non-Hispanic black persons report the highest number of bed days in the previous year due to back pain (8.7 days on average), while those of Hispanic ethnicity lost, on average, the most work days (14.1 days). (Reference Table 7D.2 PDF [1586] CSV [1587])
 [1593]
 [1595]
 Research starting in the late 1980s and extending to 2011 shows a consistent pattern of doctor-diagnosed arthritis prevalence among races and ethnicities, although prevalence rose among all groups. Persons of Hispanic ethnicity and Asian/Pacific Islanders have lower arthritis prevalence than non-Hispanic whites, non-Hispanic blacks, and non-Hispanics of other races. However, a study of the 2013 Behavioral Risk Factor Surveillance Survey (BRFSS) participants residing in Hawaii of health disparities of Native Hawaiians and Pacific Islanders (NHPI), Whites, and Asians found that NHPI males had a significantly higher prevalence of arthritis, which peaked twenty years earlier, than White and Asian males. The prevalence of arthritis peaked at 65-79 years in males and females in all racial groups, except NHPI males where it peaked at 45-54 years. At the NHPI peak age range, arthritis prevalence was 49.4% among NHPI males compared to White males (222.2%) and Asian males (17.9%). No significant differences were found among females.1
American Indians/Alaska Natives higher than non-Hispanic blacks and resembling non-Hispanic whites.2,3 A 2009-2011 study of prevalence rates among females only reported the same pattern, but with higher rates than found in both sexes.4 Arthritis-attributable activity limitation, arthritis-attributable work limitation, and severe joint pain were found to be higher for non-Hispanic blacks, Hispanics, and multiracial or other respondents with arthritis compared with non-Hispanic whites with arthritis.3
 [1597]
 Osteoarthritis, or degenerative joint disease, is the most common form of arthritis. The incidence of osteoarthritis in different ethnicities is similar. Disabling OA is at least as prevalent among African Americans and Hispanics as among non-Hispanic whites.5 African-Americans, however, report greater pain and activity limitation in comparison to Caucasians.6,7,8 African-Americans have higher prevalence of knee symptoms, radiographic knee osteoarthritis, and symptomatic knee osteoarthritis than whites,8 and 77% more likely to have knee and spine osteoarthritis together.9 Hispanics are 50% more likely than non-Hispanic Whites to report needing assistance with at least one instrumental activity of daily living and report difficulty walking.10 Prevalence of osteoarthritis of the knee is on the rise, due in part to the growing epidemic of obesity. Hispanic and African-American women have disproportionatly high rates of obesity leading to higher rates of knee osteoporosis, with subsequent quality-adjusted life-years losses, than found among Caucasian women.11
There is evidence of race-based differences in rheumatoid arthritis (RA). Ethnic variations have been found in the clinical expression of RA, both in the frequency and types of SE-carrying HLA–DRB1 alleles,12 with non-Hispanic whites having the lowest percentage of rheumatoid factor positive results.13 Hispanics exhibit more tender and swollen joints than non-Hispanic whites, while African-Americans are slightly older at onset.12 African American and Hispanic patients have higher disease activity level, lower rates of remission, and worse functional status than white patients, in spite of more aggressive treatment strategies in recent years.13,14 There are also differences in utilization of disease-modifying anti-rheumatoid drugs (DMARDs), the gold standard treatment of RA. Certain studies suggest that treatment differences may be related to patient preference. Constantinescu et al found that fewer African-American patients preferred aggressive treatment compared to white patients with similar disease severity.15 This study suggests that improvement in patient literacy about rheumatoid arthritis could decrease the disparity in management.
Gout, one of the most common forms of inflammatory arthritis, is characterized by severe joint pain and destruction. A population-based cohort study demonstrated that African-Americans were at an increased risk of gout.16 African-Americans with gout have also been found to function worse than their Caucasian counterparts.17 Another database study found that African-Americans with gout were less likely to receive urate-lowering therapy with allopurinol.18 Studies have shown a similar efficacy of ULT between black and white patients.19,20 These results suggest that decreasing the disparity in gout treatment will improve disease severity in African-Americans.
Ethnic disparity has been widely studied in SLE, with findings that West-African immigrants experience SLE (lupus) more than those native to Europe or America, with many having the condition before migration. A San Francisco study found SLE was four times higher in African-American women than in Caucasian women. Among Asians, SLE is reported to be more frequent among Chinese settling outside China.21
Total hip and knee replacements, generally indicated for end-stage arthritis, are two of the most common and successful major surgical procedures performed in the United States. Outcomes after total joint replacement are similar between black and white patients after controlling for socioeconomic factors.22 Unfortunately, racial disparities in the utilization of these procedures has been demonstrated in multiple studies. A Medicare database study by Singh et al demonstrated that blacks are less likely to receive joint replacement surgery compared to whites. Importantly, the utilization disparity did not improve over an 18-year period. Blacks also had inferior outcomes including longer hospital stays and higher rates of readmission.23 Another prospective study revealed that blacks are less likely to receive a recommendation for joint replacement surgery; however, this difference appeared to be related to patient treatment preference.24 African American patients are also less familiar with TKA than their white counterparts and more likely to anticipate greater perioperative pain and longer recovery.25,26 Thus, patient education about the procedure is likely a major factor that will increase utilization of joint replacement procedures by African-Americans.
In 2015, non-Hispanic whites and Non-Hispanic blacks self-reported doctor-diagnosed arthritis (told be a doctor they have arthritis) at similar rates (22.6/100 persons and 22.2/100, respectively), while persons of Hispanic ethnicity reported a lower rate (15.4/100). Persons of non-Hispanic other/mixed race did not report in sufficient numbers to be cited. (Reference Table 7D.4.1 PDF [1598] CSV [1599])
 [1601]
 The numbers reported for arthritis-attributable activity limitations as a total followed the same pattern as doctor-diagnosed arthritis, with non-Hispanic whites and non-Hispanic blacks similar (11.1/100, 10.9/100, respectively), Hispanics much lower (5.7/100), and insufficient numbers of non-Hispanic others/mixed race to be cited. However, by specific type of limitation, non-Hispanic blacks report higher rates than other racial/ethnic groups. (Reference Table 7D.4.1 PDF [1598] CSV [1599])
 [1603]
 [1605]
 In 2015, those of Hispanic ethnicity reported more lost work days due to arthritis, on average, than other racial/ethnic groups. (Reference Table 7D.4.2 PDF [1606] CSV [1607])
 [1609]
 Considering only hospitalizations with an arthritis diagnosis, in 2013, non-Hispanic blacks had a slightly higher rate (2.8/100 persons) than non-Hispanic whites or Hispanics (2.6/100), with non-Hispanic others/mixed race much lower (1.1/100). The HCUP NEDS (emergency department) database does not report race/ethnicity, hence no numbers are available for other types of healthcare visits. Non-Hispanic blacks also had slightly longer hospital stays with an arthritis diagnosis. (Reference Table 7D.4.2 PDF [1606] CSV [1607])
 [1611]
 [1613]
 Joint replacement is a common procedure performed to alleviate the pain from arthritis. As noted above, the literature reports lower rates of hip and knee procedures among non-Hispanic blacks. This finding is supported by the rates of all arthroplasty procedures performed in hospitals in 2013. Non-Hispanic white persons received 80% of hip replacements and 77% of knee replacements compared to the 62% of the population they represented. All other racial/ethnic groups had small shares of procedures than they represented in the population. (Reference Table 7D.4.3 PDF [1614] CSV [1615])
 [1617]
 Race and ethnicity are important factors in the incidence of osteoporosis. The World Health Organization defines osteoporosis as a T score less than -2.5.1 African-Americans tend to have higher bone mass levels than Caucasians and Asians.2,3 In adults 50 years of age and older, approximately 10% of non-Hispanic white women have osteoporosis, compared with 6% of non-Hispanic black women and 10% of Hispanic women. It is estimated that an additional 50% of non-Hispanic white and Asian women have osteopenia, compared with 39% of black women and another 38% of Hispanic women.4,5
Osteoporotic fractures are a major health care concern due to their morbidity and mortality along with health expenditures. In 1995, the estimated health care costs associated with osteoporotic fractures was 13.8 billion.6 Decreased bone strength predisposes patients to an increased risk of fragility fractures, especially hip fractures. African-Americans have the lowest rates of hip fractures since they have the highest bone density.7 In a database study, Cheng et al reported that among traditional Medicare beneficiaries with fractures, osteoporosis was diagnosed nearly twice-as-often for white women compared with black women across all age groups.8 Ethnicity and race influenced the risk of fracture even after adjusting for multiple variables. Overall, the risk of fracture was 49% lower among African American women than among white women.9 Longer hip axis lengths have also been linked to an increased risk of hip fracture and hip axis lengths are reportedly shorter among African Americans and Asians, even after adjusting for height.10 African-American women who sustain an osteoporotic fracture, unfortunately, experience higher morbidity and mortality in comparison.11 This is possibly due to differences in hospital volume or it could reflect variations in care.
Race and ethnicity also are important factors in the screening and treatment of osteoporosis. In a retrospective review, Curtis et al found a significant disparity in recommendation for osteoporosis screening between AA and white women. Among Medicare enrollees, 33% of white women have screenings for BMD, but only 5% of African American women have such screenings.12 Among women with fractures, African Americans had a lower likelihood of both BMD testing and treatment.10,13 Hamrick et al reported that while 80% of white women received pharmacotherapy after osteoporosis diagnoses, only 68% of black women did.14 A cross sectional study by Curtis et al showed that African Americans are significantly less likely than Caucasians to receive osteoporosis medication. Minority women are less likely to receive hormone replacement therapy.15
In 2013, 892,600 patients discharged from hospitals in the US had a primary (first) diagnosis of osteoporosis. The distribution of persons with a primary diagnosis of osteoporosis did not reflect other data that indicates lower rates of osteoporosis among non-Hispanic blacks and higher rates among non-Hispanic whites and those of Hispanic ethnicity. Among this group, only 7% were classified as non-Hispanic whites.
 [1622]
 Within the same time period, 540,600 patients were discharged with a fragility fracture diagnosis, and may or may not have had a diagnosis of osteoporosis. Among those with a fracture diagnosis, 82% were non-Hispanic white persons, with all other racial/ethnic groups accounting for only 4%-5% of discharges with a fracture. (Reference Table 7D.5 PDF [1623] CSV [1624])
 [1626]
 The differences in hospital discharges for osteoporosis and fragility fractures from known prevalence rates may reflect treatment rates among racial/ethnic groups and coding of fractures before the underlying cause of the fracture in medical records, particularly among non-Hispanic white patients.
There is a paucity of literature regarding racial differences in sports-related injuries. Anterior cruciate ligament rupture is a common sports injury. A retrospective study of women’s professional basketball players over a 4-year span reported a higher rate of ACL tears in white players than their African-American counterparts.1 A difference in femoral morphology has been found between racial groups and may be a contributor to the potential difference in ACL injury rates.2 Another significant sports injury, lower extremity tendon ruptures, was analyzed in a military database study. Quadriceps, patellar, and Achilles tendon ruptures were examined. African-American service members had a significantly higher rate of lower extremity tendon rupture when compared to white service members.3 A biomechanical study showed a higher Achilles tendon stiffness in black athletes which potentially makes them more susceptible to rupture.4
Ankle sprains are the most common injury in athletic populations.5 Both AA and white races have a higher rate of ankle sprains than Hispanics.6 This is potentially due to the difference in type of athletic activities, for example soccer vs basketball.
Falls are an important cause of hospital admission and can lead to injuries such as hip and distal radius fractures. Whites have a higher incidence of falls than African-Americans.7 In a prospective study, Kiely et al also found a higher rate of falls in whites; however, after adjusting for confounding variables including types of activity and community characteristics, the difference was minimized.8 According to a retrospective study by Strong et al, in patients 65 and older admitted for falls, AA patients have a higher risk of mortality after discharge from the hospital.9 This highlights the need for improved follow-up after discharge.
African-Americans have a lower overall incidence of fractures than whites.10,11; however, there is minimal research on fracture risk other than in the hip. Much of this is related to higher bone density in blacks along with the difference in activities engaged in. Some studies have also investigated for disparities in the management of fractures. Opel et al found that after adjusting for insurance status and severity of injury, African-Americans had significantly lower odds of receiving surgical treatment for humeral shaft fractures than white males.12 The results suggested a possible bias in treatment decision-making, leading to less aggressive management in African-Americans.
Non-Hispanic whites self-report the highest rate of injuries (3.3/100 persons) for which they sought medical care in 2013-2015. Non-Hispanic other/mixed race persons reported the lowest rate 1.3/100). (Reference Table 7D.6 PDF [1627] CSV [1628])
 [1630]
 Data for both self-reported injuries for which medical care was sought and for hospital discharges support research findings reported above. Non-Hispanic white persons represented two-thirds or more of reported injuries from falls, trauma, or other causes, but were a smaller share of trauma accidents than falls or other causes.
 [1632]
 Among hospital discharges for injuries, 55% of non-Hispanic white persons were hospitalized due to a fall, compared to 33% of non-Hispanic black persons. Persons of Hispanic ethnicity had the highest share of discharges due to trauma injuries (34%) , followed closely by non-Hispanic blacks (31%). (Reference Table 7D.6 PDF [1627] CSV [1628])
 [1634]
 Primary sarcomas represent the least common malignancies in bone, although osteosarcoma represents the most common nonhemoapoietic primary tumor of bone. Osteosarcoma is a primary malignant bone-producing tumor. In a review by Ottaviani, osteosarcoma had a higher incidence in African-Americans (AA) (6.8 per million persons per year] and Hispanics (6.5 per million) than in whites (4.6 per million).1 The reason for a potential higher incidence in blacks may be due to genetic factors, but it has not been determined.
Ewing sarcoma is a malignant tumor of bone and soft tissue. Race is an important factor in the incidence of ES, with Caucasians more likely to develop ES than African Americans or Asians. In a database study, Worch et al showed that ES is 8 times more likely to occur in the white population compared with African Americans and 1.9 times more likely to occur in the white population compared with Asian-Americans and Native Americans.2 Another database study by Worch et al., however, showed overall survival was significantly worse for patients. These results suggest a genetic component to the disease.3
Soft tissue sarcomas are the sixth most common primary cancer among young adults and adolescents aged 15-29.4,5 Musculoskeletal tumors included in this group include rhabdomyosarcoma, synovial sarcoma, and liposarcoma. Hsieh et al. showed that AA had the highest incidence rates of fibromatous neoplasms, rhabdomyosarcoma, and Kaposi sarcoma among all racial/ethnic groups. This study also revealed that Hispanic males and females had significantly higher liposarcoma rates than other racial/ethnic groups.6 A database study by Alamanda et al found that African Americans encounter death due to soft tissue sarcomas at a much larger proportion and faster rate than their respective white counterparts. African Americans frequently presented with a larger size tumor, do not undergo surgical resection, or receive radiation therapy as frequently as compared with their white peers.7,8
Multiple myeloma is a cancer of plasma cells and is the most common malignancy arising in bone. Multiple myeloma (MM) is the most common hematologic malignancy among blacks in the US and the second most common hematologic malignancy in the country.9 A large database study concluded that blacks have an earlier onset and a higher incidence of MM This study also found African-Americans to have better survival rates, which is different than most conditions found in the literature.10 These results suggest a different disease biology. Fiala et al performed a database study regarding racial disparities in multiple myeloma treatment. After controlling for overall health and potential access barriers, black patients were found to be 37% less likely to undergo stem cell transplantation, and 21% less likely to be treated with bortezomib, an antineoplastic agent which is considered the gold standard in chemotherapy treatment of MM. Moreover, the authors found that the underuse of these treatments was associated with an increase in the incidence of death among black patients.11 The difference in treatment may be due to patient preference, patient education, or implicit biases in management. More research is needed to examine these factors.
Incidence of musculoskeletal cancers is reported in BMUS based on data published by the National Cancer Institute’s Surveillance, Epidemiology and End Results Program (SEER). Data is shown for bones and joints cancers but is not broken down for specific types of sarcomas. Myeloma (multiple myeloma) is a cancer of plasma cells in the bone marrow. Based on SEER data 2010-2014, non-Hispanic whites have a higher incidence of bones and joints cancers than do non-Hispanic blacks and those of Hispanic ethnicity, but all have very low incidence. Non-Hispanic white males had the highest incidence at 12 cases per one million persons. Myeloma has a higher incidence, with non-Hispanic blacks higher than non-Hispanic whites. Incidence was not reported for those of Hispanic ethnicity. SEER reported death rates for musculoskeletal cancers follow the same pattern as incidence rates but are much lower. (Reference Table 7D.7 PDF [1635] CSV [1636])
 [1638]
 [1640]
 The impact of race and ethnicity on the etiology and management of musculoskeletal conditions requires more extensive investigation. The influence of race and ethnicity on the incidence of musculoskeletal conditions may be due to genetics along with difference in activities participated in. Genetic differences, however, have not been well defined in the vast majority of conditions. Clarifying this may lead to advancements in the management of certain conditions including osteoporosis, multiple myeloma, and spinal deformities.
The difference in incidence is also largely influenced by the lower rate of presentation by ethnic minorities to a physician. We also need to enhance awareness of any disparities in the management of musculoskeletal conditions. Race-based differences in the treatment of certain conditions may indicate an inherent bias. They may also be related to access issues and patient perception. The treatment of disabling osteoarthritis is a good example. Osteoarthritis has been found to be as prevalent in AA and Hispanic populations as in non-Hispanic white populations. Several studies, however, have shown that minorities undergo joint replacement procedures at a significantly lower rate. Ethnic minorities are less familiar with certain surgical procedures. Also, certain primary care physicians are less likely to refer patients to surgeons for consultations depending on their access to these services or their perception of what their patient's insurance may allow for. Unfortunately, AAs may have a higher rate of adverse outcomes.1 The reasons for this disparity are multifactorial but include less familiarity and lower expectations with the procedure in minority populations. Also, minorities tend to have procedures at lower volume hospitals which may contribute to more adverse outcomes.
Lastly, access to adequate postoperative care should be considered in adverse outcomes, be it from another family member that can afford to miss workdays or certain ancillary services provided to the patient.
A greater awareness regarding the disparities in musculoskeletal conditions and their management is needed. Further research into the reasons for differences in incidence of certain conditions will allow for better and possible earlier intervention. Moreover, enhanced understanding and defining the causes of racial disparities in the management of musculoskeletal diseases will allow improved and more equitable care in an increasingly diverse population.
The healthcare utilization and economic cost of musculoskeletal diseases section looks at the burden of musculoskeletal conditions both on individuals who have them and the overall US economy.
The economic analyses presented in this chapter are based on a definition of musculoskeletal disease that includes all condition groups discussed in other sections of this website, including low back and neck pain (spine), arthritis and joint pain, osteoporosis, musculoskeletal injuries, and a category of "other" for all remaining conditions. Key estimates were also conducted using more expansive definitions of musculoskeletal diseases and condition groups hereinafter referred to as the broader AAOS definitions. These definitions include all conditions mentioned previously in addition to musculoskeletal conditions that are a consequence of another disease (eg,. bone metastases from cancer). The list of ICD-9-CM codes used in the primary and broader AAOS definitions of musculoskeletal disease can be found in the codes section [1641]. In addition, specific conditions and subgroups (ie, connective tissue disease, gout, osteoarthritis and allied disorders, rheumatoid arthritis, other and unspecified conditions of the back, and musculoskeletal disease among children and adolescents) are also examined.
The economic impact measures presented in this chapter include two components: direct medical costs and indirect costs. These costs may be total or incremental, and can be presented as per-person or aggregate costs.
Direct medical costs estimated here capture four types of healthcare resources consumed: ambulatory visits (to both physicians and non-physicians), prescription medications, home health care visits, hospital discharges, and “residual” (all other types of care). Direct medical costs in this chapter measure actual amounts paid, rather than charges. Indirect costs estimated in this chapter are those associated with lost wages. In this edition of BMUS, we have subset analysis of lost wages not just to individuals with a work history, but to those ages 18 to 64 — the typical age range for persons in the workforce. Previous editions of BMUS did not subset lost wage analyses by age, therefore this edition yields lower numbers of individuals in the workforce and, therefore, lower indirect cost estimates when compared with previous editions.
All-cause costs include medical expenditures or lost wages for persons with musculoskeletal disease, regardless of whether those costs are due to the musculoskeletal disease or another medical condition.
Incremental costs are those estimated as attributable to musculoskeletal disease. Essentially, incremental costs are calculated as the difference in costs for those patients with musculoskeletal conditions versus costs simulated for those individuals in the absence of musculoskeletal conditions. The methodology for calculating incremental costs was revised in this edition of BMUS and generally results in estimates that are somewhat lower than those presented in the past. We believe the new methodology more accurately reflects estimated costs.
Aggregate costs for both direct and indirect costs are the sum of per-person costs across all individuals with the condition. We provide aggregate all-cause and incremental costs for all musculoskeletal conditions combined, as well as for condition subgroups separately.
The data source for all estimates in this chapter is the US Department of Health and Human Services, Agency for Healthcare Research and Quality Medical Expenditures Panel Survey [1642] (MEPS), using "Appropriate Price Indices for Analysis of Health Care Expenditures or Income Across Multiple Years [1643]", from the MEPS. The MEPS is a set of large-scale surveys of families and individuals, their medical providers, and employers across the United States. National estimates are calculated by using sampling weights supplied with the survey files. MEPS is the most complete source of data on the cost and use of health care and health insurance coverage currently available.
To demonstrate the effect of musculoskeletal conditions on the US economy, aggregate costs as a share of the Gross Domestic Product [1644] [1645](GDP) are shown. The GDP is the market value of all goods and services produced in the United States. Because it is released annually, it can be used to measure changes in the size of the economy over time. The GDP is the best known of the national income and product accounts (NIPA), and is often used to create a comparison measure across years.
We estimate that 107.5 million persons annually experienced musculoskeletal disease in the 2012-2014 period, an increase of 31.5 million since 1996-1998. Our estimates, based on analysis of MEPS data, may differ from those derived from other sources due to variations in data collection and definitions for musculoskeletal disease. This is over one-third of the population affected by a musculoskeletal condition at least once per year in the 2012-2014 period — an increase of 6 percentage points between from 1996-1998 (28.0% to 34.0%). (Reference Table 8.1.1 PDF [139] CSV [140])
 [1647]
 Using the broader AAOS definition of musculoskeletal diseases, an average of 162.4 million (51.4% of the population) reported such conditions annually over the 2012-2014 period, an increase from the 121.1 million (44.7%) reporting the conditions in 1996-1998. (Reference Table A8.1.1 PDF [1648] CSV [1649])
Although musculoskeletal diseases are more prevalent among people age 65 and older, because there are more individuals in the age range 45-64 at the current time due the size of the baby boom cohort, a larger percentage of those reporting musculoskeletal conditions in 2012-2014 were 45-64 (37.9%) than were 65 or older (25.9%). A major share of those reporting these conditions in 2012-2014 were also in early adulthood, 18-44 years of age (28.6%), while fewer than one in 12 occurred among those less than 18 years of age (7.7%). (Reference Table 8.1.1 PDF [139] CSV [140])
 [1651]
 The overall increase in the prevalence rate of musculoskeletal diseases, from 28.0/100 persons in 1996-1998 to 34.0/100 in 2012-2014, masks different rates of change for specific musculoskeletal conditions. The prevalence rate of arthritis and joint pain almost doubled during this time, from 10.7 to 20.8/100 and the prevalence rate of osteoporosis increased by about 50%, from 1.2 to 1.8/100. However, there was relatively little change in the prevalence rate of spine conditions (10.1/100 in 1996-1998 and 11.0/100 in 2012-2014) and of injuries (8.6 and 8.3/100 in the two periods, respectively). Although the prevalence rate of the residual category, “Other Musculoskeletal Conditions” appeared to increase, from 4.4 in 1996-1998 to 6.2/100 in 2012-2014, this may be due to changes in detection and coding conventions.
 [1653]
 As noted above, the overall prevalence of spine conditions changed little between 1996-1998 and 2012-2014; however, the number of persons reporting the conditions increased from 27.4 million in the earlier period to 34.9 million in the latter due to population growth. Nearly three-fourths of spine conditions occur in the working-age population, with just under a third reported by those aged 18-44 in 2012-2014 while another 39.1% reported by those 45-64 during this time frame. The high prevalence in these working-age groups explains the high rate of workers’ compensation and disability cases associated with spine conditions. Nevertheless, a significant share of spine conditions was reported by those 65 and older in 2012-2014 (23.1%), the prevalence rate among persons this age group rising from 16.1/100 in 1996-1998, or by more than 40% in relative terms. (Reference Table 8.1.2 PDF [1654] CSV [1655])
Among the major subgroups of musculoskeletal diseases, arthritis and joint pain have the highest prevalence. In 1996 to 1998, 29.0 million persons (10.7%) reported one or more conditions related to arthritis and joint pain; by 2012-2014, 65.6 million persons (20.8%) reported one or more such conditions. However, the increased number of people with these conditions between 1996-1998 and 2012-2014 cannot be attributed solely to the increased size of the underlying population as methodological changes in MEPS over time improved the accuracy of capturing these conditions. The aging effect of the baby-boom generation has resulted in an increase in the proportion of arthritis cases among those age 45 to 64 years as they reach the typical onset age for arthritis. As the baby boomers continue to age, the proportion of persons with arthritis in the 65-year and older age group will increase as well. In 1996-1998, 25.6% of persons reporting arthritis were age 18 to 44 years and 37.5% were age 45 to 64 years. By 2012-2014, the proportion of persons aged 18-44 years reporting arthritis had declined slightly to 23.7% while the proportion among those aged 45-64 had increased to 44.0%. (Reference Table 8.1.3 PDF [1656] CSV [1657])
Population aging has also led to a dramatic increase in the number of individuals with osteoporosis. In the period from 1996-1998, 3.2 million people (1.2% of the population) indicated they had these conditions, but by 2012-2014, 5.7 million (1.8% of the population) reported having them. However, the prevalence rate in MEPS has declined from a high of 2.7% in 2004-2006, 2005-2007, and 2006-2007 to the current rate, 1.8%. The prevalence as reported in MEPS is substantially lower than numbers reported in other sources, even though the category in this chapter is not limited to osteoporosis-related conditions. Estimates of the number of persons with osteoporosis and low bone mass, the precursor to osteoporosis, were 53.6 million in 2010, and projected to increase to 71.4 million by 2030.1
About 38% of persons in the MEPS reporting these conditions are age 45 to 64 years, increasing the likelihood that these individuals will suffer from falls and fractures for the relatively long future they can expect to live with this condition. A greater number (50.5%) are age 65 or over and already at risk for falls and fractures. (Reference Table 8.1.4 PDF [1658] CSV [1659])
In 1996-1998, 23.4 million persons reported a musculoskeletal injury, while 26.3 million reported such an injury in 2012-2014. The prevalence of musculoskeletal injuries remained relatively constant at 8.6% and 8.3% of the population in the two three-year periods, respectively. Age distribution of injuries may explain why the prevalence has not increased. About half of injuries occur among persons younger than 45 years, a population segment growing more slowly than those who are older. It is possible improvements in the safety of automobiles and other public health prevention activities have also played a role. Although the MEPS reporting of musculoskeletal injury trends supports trend data previously reported, the overall prevalence is substantially lower than the 40.8 million injury treatment episodes reported in the Injuries section of this report. Injury treatment episodes include total cases treated in doctors' offices, outpatient clinics, emergency rooms, and inpatient admissions in 2010. (Reference Table 8.1.5 PDF [1182] CSV [1183])
Using the more expansive definition of musculoskeletal diseases, in 2012-2014, 93.6 million persons (versus 34.9 million using the more conservative definition) reported one or more spine conditions and 69.0 million (versus 65.6 million) reported arthritis and joint pain. The base and expansive definitions for osteoporosis are identical, so the number of cases for both definitions are also identical, but substantially lower than reported in the Osteoporosis section of this report, as previously noted. The number reporting musculoskeletal injuries was slightly higher than in the more conservative definition (30.3 versus 26.3 million). The increased prevalence in the “other” musculoskeletal diseases category was also substantial, with 75.1 million in the expansive definition versus 19.4 million. (Reference Table A8.1.2 PDF [1660] CSV [1661]; Table A8.1.3 PDF [1662] CSV [1663]; Table A8.1.4 PDF [1664] CSV [1665]; Table A8.1.5 PDF [1666] CSV [1667]; and Table A8.1.6 PDF [1668] CSV [1669])
Musculoskeletal healthcare utilization is examined for the MEPS for the following types of care: ambulatory physician visits, ambulatory non-physician visits, prescription medications filled, home health care days, and hospital discharges for all musculoskeletal conditions and by type of condition.
Over the annual 3-year average periods, 1996-1998 to 2012-2014, for which the MEPS data is analyzed, ambulatory non-physician care visits show the greatest increase, both in share (%) of population reporting such a visit and in total visits. While the proportion of the population with a prescription filled remained steady at just over 80%, prescription medications filled increased in total number due to population increases and the rise in mean number of prescriptions filled. The total number of prescriptions filled showed an average annual increase of 7.5%, while the mean number of prescriptions filled showed an annual increase of 3.5%. Ambulatory physician visits and hospital discharges both increased by 2.6% annually over the seventeen-year period from 1996-1998 through 2012-2014. (Reference Table 8.2.1 PDF [1670] CSV [1671])
 [1673]
 Persons with musculoskeletal diseases account for a large and growing share of healthcare utilization. In any given year, about 85% of persons with musculoskeletal diseases have at least one ambulatory care visit to a physician's office, averaging just under six such visits per year. Between 1996-1998 and 2012-2014, ambulatory physician visits for these individuals increased from 425.5 million to 602.3 million. Growth in the number of persons with musculoskeletal diseases, rather than an increase in the number of visits by individuals, is primarily responsible for this increase.
In contrast to the relatively stable number of physician office visits per person with a musculoskeletal condition, there was an increase in the proportion of the US population with visits to ambulatory providers other than physicians. The average number of visits to non-physician providers by persons with musculoskeletal diseases also increased. Non-physician ambulatory healthcare providers include physical therapists, occupational therapists, chiropractors, social workers, physician assistants, nurse practitioners, and other related healthcare workers. In 1996-1998, approximately 40% of persons with musculoskeletal diseases visited a non-physician healthcare provider at least once; by 2012-2014, the proportion had jumped to 58.0%. At the same time, the average number of such visits increased from 2.6 per person to 4.5. The result was more than a doubling, from 197.5 million to 484.0 million, in total non-physician ambulatory care visits between 1996-1998 and 2012-2014.
During this same time frame of 1996-1998 through 2012-2014, the use of prescription medications among persons with musculoskeletal diseases rose substantially. While the proportion of persons with a musculoskeletal disease who filled at least one prescription ranged 81% to 84% over the 17-year period, the mean number of prescriptions filled per person steadily increased from 13.1 to 20.4 mean fills. The result was a more than doubling, from 995.3 million in 1996-1998 to nearly 2.2 billion in 2012-2014, in the number of prescription medications filled by persons with a musculoskeletal disease.
Despite widespread concerns that an aging population would use an increasing amount of home health care, there is no evidence that this is occurring. Both the proportion of persons with a musculoskeletal disease using home health care and the average number of home health care visits remained low with little change over the 1996-1998 through 2012-2014 period. Only 5.5% of persons reported any home health care visits in 2012-2014, with an average of 3.7 visits. The total number of home health care visits to persons with a musculoskeletal disease rose from 296.3 million to 397.9 million, entirely due to population increase.
An increase of more than 40%, from 15.2 to 21.5 million, in the number of hospital discharges for persons with a musculoskeletal disease occurred in the periods 1996-1998 to 2012-2014. This may be due to the aging population. The percentage of persons with a musculoskeletal disease who were hospitalized one or more times in a year was roughly stable, with 11% to 12% of persons with these conditions hospitalized annually in 1996-1998 to 2012-2014 period. The average number of hospitalizations per person, at 0.2, did not change.
Using the more expansive definition of musculoskeletal diseases, in 2012-2014 there were an estimated 812.1 million visits to physicians among persons with these diseases, as well as 584.7 million ambulatory visits to providers other than physicians, 2.9 billion prescriptions filled, 503.5 million home care visits, and 16.2 million hospital discharges. It should be noted that in this expansive definition, the number of ambulatory visits per person to providers other than physicians and the number of medications per person has risen dramatically. (Reference Table A8.2 PDF [1674] CSV [1675])
Healthcare utilization by musculoskeletal conditions shows some variation from total musculoskeletal conditions. Arthritis and joint pain accounted for a substantial share of growth in healthcare utilization of all types. The rate of increase for all sources of health care utilized by persons with arthritis was two to three times the rate increase for all musculoskeletal conditions. Osteoporosis accounted for much of the limited growth in home health care visits, increasing 133% over the 17-year analysis period compared with a 34% overall increase. Growth in healthcare visits for injuries was slower than overall musculoskeletal conditions, while healthcare visit growth rates for spine diseases were about even.
 [1677]
 Detailed data related to utilization by condition can be found in specific condition data tables and is also discussed under the condition section. See spine (Reference Table 8.2.2 PDF [310] CSV [311]); arthritis and joint pain (Reference Table 8.2.3 PDF [1678] CSV [1679]); osteoporosis (Reference Table 8.2.4 PDF [766] CSV [767]); injuries (Reference Table 8.2.5 PDF [1186] CSV [1187]); other musculoskeletal conditions (Reference Table 8.2.6 PDF [1680] CSV [1681]); and summary (Reference Table 8.3 PDF [1682] CSV [1683]).
Musculoskeletal medical care expenditures are presented in two ways: (1) for all persons with a musculoskeletal disease, regardless of whether the musculoskeletal disease was the reason for the expenditure (total direct cost), and (2) as a measure of the expenditures beyond those expected for persons of similar characteristics but who do not have a musculoskeletal disease (incremental cost). Incremental cost is that share of cost estimated to be directly related to the musculoskeletal condition. Both total and incremental costs are expressed as the average cost per person with a musculoskeletal disease and as the aggregate cost (sum) for all persons with a musculoskeletal disease.
Mean costs are presented for ambulatory care, inpatient care, prescription costs, and a residual for other costs, as well as the total cost. Medical care costs are expressed in both the current year dollars (i.e., the year the data was collected) and in 2014 dollars to provide a standard of comparison across years.
Total direct and incremental costs for all musculoskeletal conditions and five subconditions are summarized in Table 8.6.1. (PDF [143] CSV [144])
Overall, total average direct expenditures for persons with musculoskeletal diseases increased from $5,020 in 1996-1998 to $8,206 in 2012-2014, in 2014 dollars, a more than 60% increase. Ambulatory care was the largest cost share and accounted for 34% of total average per person costs for musculoskeletal diseases in 2012-2014.
Over the 1996-1998 through 2012-2014 periods, the share of total costs associated with ambulatory care rose slightly, from 31 to 34%, while the share for inpatient care declined from 36% to 27%. The share for the residual category also declined, from 18% to 15% of the total. However, medication costs accounted for a far larger share, increasing from 14% to 24% of the total. In 2014 dollars, the average amount spent for medications increased from $691 in 1996-1998 to $1,967 in 2012-2014, or nearly tripled in relative terms. (Reference Table 8.4.1 PDF [1684] CSV [1685])
 [1687]
 In 2012-2014, incremental expenditures for musculoskeletal diseases averaged $1,510 in 2014 dollars. (Reference Table 8.5.1 PDF [1688] CSV [1689])
Data for specific musculoskeletal conditions has been analyzed through the 2012-2014 time period, and shown in 2014 dollars. Total per person direct medical care expenditures rose for each of the major subconditions between 1996-1998 and 2012-2014. Expenditures for arthritis and joint pain, which rose from $6,642 to $9,554, and osteoporosis, which rose from $8,906 to $12,869 per person, had the smallest relative increases at 44% each, although both conditions had high average per person costs. Costs for spine conditions rose by 80%, from $5,023 to $9,035; for injuries by 93%, from $4,211 to $8,135; and for other musculoskeletal conditions by 62%, from $6,799 to $11,047.
 [1691]
 Detailed data related to per person all-cause direct cost by condition can be found in specific condition data tables and is also discussed under the condition section. See spine (Reference Table 8.4.2 PDF [314] CSV [315]); arthritis and joint pain (Reference Table 8.4.3 PDF [522] CSV [523]); osteoporosis (Reference Table 8.4.4 PDF [770] CSV [771]); injuries (Reference Table 8.4.5 PDF [1190] CSV [1191]); other musculoskeletal conditions (Reference Table 8.4.6 PDF [1692] CSV [1693]); and summary (Reference Table 8.7 PDF [1694] CSV [1695]).
Except for arthritis and joint pain, incremental direct costs by condition grew more slowly than all-cause direct costs. This is likely due to co-morbid conditions which may have a higher healthcare cost than some musculoskeletal diseases. In general, groups of individuals with more expensive conditions who also are older and have more comorbid conditions will have higher per-person all-cause costs, while incremental costs are those attributable to the condition and less affected by age, other demographics, or comorbid conditions.
 [1697]
 Detailed data related to per person incremental direct cost by condition can be found in specific condition data tables and are also discussed under the condition section. See spine (Reference Table 8.5.2 PDF [1698] CSV [1699]); arthritis and joint pain (Reference Table 8.5.3 PDF [524] CSV [525]); osteoporosis (Reference Table 8.5.4 PDF [1700] CSV [1701]); injuries (Reference Table 8.5.5 PDF [1702] CSV [1703]); other musculoskeletal conditions (Reference Table 8.5.6 PDF [1704] CSV [1705]); and summary (Reference Table 8.7 PDF [1694] CSV [1695]).
Expenditures for musculoskeletal diseases did not differ substantially by gender and education level in 2015. On an unadjusted basis, women with musculoskeletal diseases had only 3% higher per person average expenditures than men. On the other hand, Hispanics report substantially lower annual per person expenditures than the other race and ethnic groups, for example 40% lower than non-Hispanic whites. Individuals who were married or with partners or who were widowed, separated, or divorced had higher annual per person expenditures than those who were never married, probably due, in part, to age differences.
Lack of insurance had the most profound impact on average health expenditures for persons with musculoskeletal conditions. Average per person expenditures on behalf of those without insurance, at $4,065, were about 40% as high as those with public insurance (i.e., Medicaid/Medicare), at $10,564, and about half that of those with private insurance, at $7,967. Again, some of this difference may be due to age, as young people are more likely to be uninsured than older people, but a portion is also due to lack of healthcare resources. Thus, lack of health insurance is inconsistent with the belief that persons who lack insurance are somehow able to obtain care. (Reference Table 8.8 PDF [1706] CSV [1707])
 [1709]
 Aging is strongly correlated with increased per person all-cause medical expenditures for persons with a musculoskeletal disease along with other co-morbid conditions, but not necessarily so when attributed directly to musculoskeletal diseases (incremental cost).
Per person all-cause expenditures in 2012-2014 for persons 65 years of age or older, at a mean of $11,760, were about 2½ times the mean per person costs for those under the age of 45.Persons aged 45 to 64 years had mean per person healthcare expenditures at around 75% that of the oldest population.
On the other hand, per person incremental costs in 2012-2014 were highest among those under age 18 and lowest among those 65 or over. Since this incremental cost is the estimate directly attributed to musculoskeletal conditions, the reversal may reflect the fact that young persons are less likely to have co-morbid conditions, and when they do have a musculoskeletal disease, it accounts for a greater proportion of medical care. Conversely, those aged 65 or over are more likely to have multiple co-morbid conditions, reducing the share of cost attributed to the musculoskeletal condition(s). (Reference Table 8.9 PDF [151] CSV [152]).
 [1711]
 Aggregate all-cause expenditures in 2014 dollars increased from $381.4 billion in 1996-1998 to $882.5 billion in 2012-2014, an increase of more than 130%. (Reference Table 8.6.1 PDF [143] CSV [144]) In 1996-1998, aggregate all-cause expenditures for persons with a musculoskeletal disease, whether for musculoskeletal disease or other conditions, represented 3.2% of the GDP. By 2012-2014, the proportion had grown to 5.2% of the GDP. (Reference Table 8.14 PDF [147] CSV [148])
Aggregate incremental expenditures in 2014 dollars increased from $101.1 billion in 1996-1998 to $162.4 billion in 2012-2014, increasing from 0.25% to 0.57% of the GDP. (Reference Table 8.6.1 PDF [143] CSV [144]; Table 8.14 PDF [147] CSV [148])
 Costs of Musculoskeletal Conditions as a Proportion of Gross Domestic Product (GDP), United States 1996-2014 - Click on image to enlarge") [1713]
[1713] Over the full-time range of 1996-1998 through 2012-2014, the annual average rate of increase in aggregate all-cause and incremental costs for musculoskeletal diseases has been 8.2% and 3.8%, respectively. (Reference Table 8.7 PDF [1694] CSV [1695])
Because of the higher prevalence and relatively high level of expenditures per person, aggregate all-cause expenditures have consistently been greatest for arthritis and joint pain, accounting for $626.8 billion in healthcare costs in 2012-2014. Spine conditions, with an estimated $315.4 billion aggregate cost in 2012-2014, are the second most expensive musculoskeletal healthcare condition. Aggregate costs for injuries and other musculoskeletal conditions were $213.7 and $214.8 billion, respectively, in 2012-2014. Osteoporosis, with $73.6 billion, accounted for the lowest aggregate of all costs. Totals for subconditions, when summed, exceed the overall total due to the potential for persons to be included in more than one condition group.
Sampling variability limits inference about time trends in incremental expenditures associated with the subcondition groups. However, while estimates do not have the same precision as those for all musculoskeletal diseases, it is fair to conclude that 2012-2014 aggregate incremental expenditures, at $88.7 billion, were largest for arthritis and joint pain. Further, aggregate incremental expenditures have increased substantially since 1996-1998 for all subcondition groups. (Reference Columns D and F, Table 8.6.2 PDF [166] CSV [167]; Table 8.6.3 PDF [530] CSV [531]; Table 8.6.4 PDF [774] CSV [775]; Table 8.6.5 PDF [1194] CSV [1195]; Table 8.6.6 PDF [1714] CSV [1715])
 [1717]
 Unlike other tables on economic costs of musculoskeletal conditions that use an average of three years of data for sequential years, analysis based on demographic characteristics uses a single year, resulting in 2014 costs that are somewhat different than those for 2012-2014.
In 2014, aggregate all-cause expenditures for musculoskeletal conditions totaled $919.4 billion, slightly higher than the 2012-2014 total. Because per person all-cause expenditures were lower among those without insurance ($4,065), aggregate expenditures on behalf of the approximately 7.1 million without insurance were only $29.0 billion; the bulk of the aggregate expenditures occurred among the 71.4 million with private insurance ($568.9 billion) or the 30.4 million with public insurance ($321.5 billion).
Of the almost 109 million persons with musculoskeletal diseases in 2014, 46.3 million (42.5%) reported a limitation in functioning, work, housework, or school, or had a limitation in vision and hearing. Such persons incurred aggregate all-cause expenditures of $636.0 billion, or 69.2% of all aggregate expenditures for musculoskeletal diseases. Slightly fewer (about 26 million, 23.8% of persons with musculoskeletal diseases) reported only limitation in work, housework, or school; such persons incurred $446.4 billion, or 48.6% of all-cause aggregate expenditures for these conditions. (Reference Table 8.8 PDF [1706] CSV [1707])
 [1719]
 Aggregate costs by age group generally reflect the trends previously described in per person expenditures [1720], except for total all-cause aggregate costs. Although persons aged 65 and over had the highest mean per person cost, persons aged 45-64 accounted for the largest share of aggregate costs due to the large size of this cohort. (Reference Table 8.9 PDF [151] CSV [152])
 [1722]
 The total economic impact of musculoskeletal diseases includes two types of costs: costs to treat individuals (direct medical costs) and costs paid indirectly by these individuals and society (lost wages).
Aggregate all-cause costs among persons with a musculoskeletal disease, including direct healthcare costs plus decreased or lost wages (indirect cost), was estimated to be $980.1 billion per year in 2012-2014. (Reference Table 8.14 PDF [147] CSV [148]). Aggregate incremental costs (i.e., those attributed to musculoskeletal disease) for direct and indirect costs sum to a $321.6 billion per year Tables 8.6.1 and 8.12). In other words, direct and indirect costs attributable to musculoskeletal disease account for a third of all-cause direct and indirect costs for this population.
Between the years 1996-1998 and 2012-2014, the Gross Domestic Product (GDP)1, in constant 2014 dollars, has risen from $12.0 trillion to $17.0 trillion, an increase of 42%. Over the same two time frames, total direct and indirect costs of musculoskeletal conditions rose from $411.9 billion to $980.1 billion. This is an increase of 138%, or more than three times the rate of increase for the GDP.
As a share of GDP, using the same 2014 dollars base, total direct and indirect costs for musculoskeletal conditions increased by 68%, from 3.44% to 5.76%. Indirect costs rose twice as fast as direct costs in relative terms. However, indirect cost are a much smaller share of total cost than direct costs, constituting 0.25% of GDP in 1996-1998 and 0.57% in 2012-2014. Direct costs rose from a 3.18% share to a 5.19% share over the same time period. (Reference Table 8.14 PDF [147] CSV [148])
 [1724]
 Musculoskeletal diseases affect the US economy through direct medical costs and through lost wages. Changes in the organization of medical care, new methods of treatment, new drugs, and rising prices for existing services and medications, as well as changes in the employment situation of persons with musculoskeletal diseases, all affect the economic impact these diseases have on the economy. The result is a major economic burden from musculoskeletal diseases.
Over the period 1996-1998 through 2012-2014, the share of per person all-cause direct costs for musculoskeletal diseases shifted between healthcare sources only slightly. Ambulatory care and prescription drugs both increased in share of total cost, while inpatient and residual care both decreased. The change in mean per person costs followed a similar pattern. Although costs increased for all care sources, it was greatest for prescription and ambulatory care costs.
The share of musculoskeletal healthcare costs devoted to prescription medications increased the most, growing by more than 70%, from 14% to 24% of total cost. Computed in 2014 dollars, the mean annual prescription cost per person increased approximately 185%, from $691 to $1,967. During this time, development of biologic agents for several inflammatory conditions, particularly rheumatoid arthritis, occurred, as well as the widespread use of the cox-2 inhibitors (coxibs) for musculoskeletal pain, and may have accounted for some of the rapid increase. (Reference Table 8.4.1 PDF [1684] CSV [1685])
 [1727]
 The importance of prescription drugs is not confined to just all-cause expenditures. In 2014 dollars, the increment in musculoskeletal diseases costs associated with prescription drugs rose even faster, increasing from a mean of $149 per person in 1996-1998 to a mean of $435 in 2012-2014, an increase of nearly 200%. (Reference Table 8.5.1 PDF [1688] CSV [1689]).
The amount of all-cause indirect costs associated with wage losses among persons with musculoskeletal conditions fluctuated from a low of $628 per person with a work history in 1996-1998 to a high of $2,400 per person in 2003-2005, and was $1,490 per person as of 2012-2014. The increment in wage losses, however, has risen steadily over time, from $999 per person in 1996-1998 to about $2,500 per person in the three most recent three-year time periods. The latter finding suggests that persons with musculoskeletal conditions experience a greater loss of wages than would be expected based on their characteristics other than work history.
In 1996-1998, about 48.5 million persons with a musculoskeletal disease had established a work history. On average, these individuals earned $628 in 2014 dollars less than those without musculoskeletal conditions; their earnings losses aggregated to $30.5 billion. By 2012-2014, the number of persons with musculoskeletal diseases and a work history had grown to about 65.5 million. On average, these workers had earnings losses of $1,490 each, resulting in aggregate all-cause earnings losses of $97.5 billion. The $67 billion increase in aggregate indirect costs of lost wages was the result of growing population numbers with musculoskeletal disease and increases in wages.
Estimates of incremental indirect costs grew from an aggregate of $48.5 billion in 1996-1998 to $159.2 billion in 2012-2014. While the rate of growth was similar for both, actual costs associated with musculoskeletal diseases is much greater. This highlights the extent to which persons with musculoskeletal disease characteristics earn less than would be expected of persons with similar characteristics but no musculoskeletal disease. (Reference Table 8.12 PDF [145] CSV [146])
 [1729]
 The following section looks at specific musculoskeletal disease conditions to provide broad estimates of costs associated with them. However, it should be noted that medical conditions in MEPS are self-reported, and may result in misreporting, and, thus, misrepresentation, of some conditions. An additional issue is that estimates for the prevalence and impact of specific conditions may differ year to year due to small sample sizes and the inherent variability that results. To improve the reliability for specific conditions, including gout, osteoarthritis and related disorders, rheumatoid arthritis, and other and unspecified disorders of the back, estimates are based on a merging of MEPS data from the most recent seven years, 2008-2014. In this edition, we also make estimates of direct costs associated with connective tissue disease, the most common of which is systemic lupus erythematosus.
As noted previously, the average all-cause expenditures for persons with all forms of musculoskeletal disease averaged $8,206 in 2012-2014. (Reference Table 8.4.1 PDF [1684] CSV [1685])
Over the period, 2008-2014, slightly more than 3 million persons self-reported gout, about 32.5 million reported osteoarthritis and related disorders, 1.7 million reported rheumatoid arthritis, and 19.4 million reported other and unspecified disorders of the back. All-cause medical care expenditures averaged $11,936 for persons with gout, $11,502 for those with osteoarthritis and related disorders, $19,040 for those with rheumatoid arthritis, and $8,622 for those with back disorders. Thus, for all conditions other than back disorders, all-cause expenditures were much larger than the average among all persons with musculoskeletal disorders. (Reference Table 8.13 PDF [554] CSV [555])
 [1731]
 Over the period 2008-2014, about 800,000 persons self-reported connective tissue disorders. Persons with connective tissue disorders averaged $19,702 in all-cause expenditures, similar to the average among those with rheumatoid arthritis. The magnitude of the all-cause expenditures would appear to be affected by insurance status and region of the country. For the former, those with public insurance had higher average expenditures, $29,579, than those with private insurance, $16,003, probably reflecting the older age and greater severity of disease among the former. Those with no insurance had all-cause expenditures of only $5,631, indicating that their care may be systematically different in scope. Such expenditures were much higher for those in the Northeast ($27,349) or West ($26,210) than in the Midwest ($11,821) or South ($14,741). Expenditures for ambulatory care accounted for 40% of the total in the Northeast region, while inpatient care accounted for 45% in the West region. Prescription costs were highest in the Midwest, accounting for 44% of total. These numbers indicate differences in care strategies for connective tissue disorders across the country. Age and education may also be factors in care strategies, with older and the highest educated persons using ambulatory care more, while younger persons and those with less than a college degree use inpatient care more. (Reference Table 8.19 PDF [616] CSV [617]; Table 8.20 PDF [606] CSV [607]; Table 8.21 PDF [618] CSV [619])
 [1733]
Additional discussion on the burden of select musculoskeletal diseases can be found in condition chapters. To jump to these discussions, click on the conditions listed below.
Connective Tissue Disorders [1734]
Gout [1735]
Rheumatoid Arthritis [1736]
Osteoarthritis [1737]
Other and Unspecified Disorders of the Back [1738]
The aging of the population has increased the prevalence and the share of persons with musculoskeletal conditions in older age groups, as well as healthcare expenditures. In 1996-1998, an average of just under 22 million persons aged 45 to 64 years reported a musculoskeletal condition, while about 16.5 million of those aged 65 years and older did so. By 2012-2014, these numbers had increased to just under 41 million and just under 28 million, respectively. The share of persons with musculoskeletal conditions among persons aged 45 to 64 years increased from 29% in 1996-1998 to 38% in 2012-2014, and increased from 22% to 26% among those aged 65 years and older. Most of this shift is due to the impact of aging and population growth, as prevalence rates have remained relatively steady for at least the last five years. (Reference Table 8.9 PDF [151] CSV [152])
 [1740]
 All-cause aggregate medical care expenditures among persons with musculoskeletal conditions have risen substantially due to population aging as well as the general increase in medical care costs. In 2014 dollars, total aggregate expenditures increased between 1996-1998 and 2012-2014 among persons aged 45 to 64 years from $115 billion to just under $369 billion, while they increased among those aged 65 years and older from $159 billion to $327 billion during this time. Although all-cause per person costs increase with age, the magnitude of the increase was greater in relative terms among persons aged 45 to 64 years with musculoskeletal conditions (from $5,276 to $9,057, or by about 72%) than among such persons aged 65 years and older (from $9,648 to $11,760, or by 22%), but was highest for the under 18 age group. Although the data do not address why the costs rose faster among those aged 45-64, the faster increase may be the result of greater cost controls in Medicare, which serves people aged 65 or older, or to subtle discrimination against older persons in the types of treatments offered. (Reference Table 8.9 PDF [151] CSV [152])
 [1742]
 In this updated edition of the Burden of Musculoskeletal Diseases in the U.S., data are presented on the prevalence and impact of this group of conditions among children. In 2012-2014, among the 77.4 million children and adolescents in the U.S. (those aged less than 18 years of age), an estimated 8.3 million had a musculoskeletal condition, 10.7% of all children. (Reference Table 8.16 PDF [1743] CSV [1744])
Most (85.2%) of the children with musculoskeletal conditions had ambulatory visits totaling more than 31 million visits, or just under an average of four per child for all children with a musculoskeletal disease. Although a smaller proportion of children had visits to non-physician providers they made more visits and the average was 3.5 visits for all children with a musculoskeletal disease, resulting in almost as many visits to these providers, more than 29 million. Children with musculoskeletal conditions averaged more than four prescriptions filled per year, or just under 37 million in total. Very few (1.4%) had one or more home health care visits, but because the average was spread over the 8.3 million with any condition, the number of home health visits for the few having them approached 70 visits. Only 1 in 25 children (4.1%) were discharged from the hospital. Nevertheless, the 8.3 million children with musculoskeletal conditions had 410,000 hospital discharges. (Reference Table 8.17 PDF [1745] CSV [1746])
All-cause medical care costs among children with musculoskeletal diseases, at $4,504 per child in 2012-2014, were less than among older persons with these conditions, but still amounted to more than $37 billion in the aggregate. Incremental medical care costs were higher among children, at $2,381 per child, than among those older, presumably because most children experience very low costs but those with musculoskeletal conditions are an exception to that rule. In aggregate, incremental costs among children with musculoskeletal conditions amounted to just under $20 billion a year in 2012-2014. (Reference Table 8.9 PDF [151] CSV [152])
All-cause medical care costs among children in 2012-2014 were higher among boys than girls ($5,411 vs. $3,550 per child per year) but did not differ dramatically by race/ethnicity. Children with these conditions who lacked health insurance had far lower all-cause medical care costs per year ($1,173) than those with private ($4,834) or public insurance ($3,994). (Reference Table 8.18 PDF [1747] CSV [1748])
 [1750]
 This edition of the Burden of Musculoskeletal Diseases in the United States continues to use condition codes defined in ICD-9-CM based on 2014 data. The earliest data based on ICD-10-CM codes will be 2016, with a one to two-year lag in availability. Codes used in the economic impact analysis by musculoskeletal diseases fall into the two categories of base codes and expansive codes.
Conditions included in the base musculoskeletal disease rubric include spine conditions, arthritis and joint pain, the category that includes osteoporosis (other diseases of bone and cartilage), injuries, and an inclusive “other” category for the remaining conditions. Conditions selected for the cost analysis presented are based on condition topics included in this site. Data are reported primarily for base case ICD-9-CM codes, or those codes for which musculoskeletal disease is the principal cause of the condition rather than a consequence of another major health condition (e.g., bone cancer metastases from an other primary cancer site).
Estimates are also provided for a more expansive list of codes of musculoskeletal-related diseases that include conditions for which musculoskeletal diseases are either the primary and secondary cause of the condition. This more expansive list of conditions yields a vastly larger prevalence estimate than the base case list. However, it is reasonable to assume the cost of musculoskeletal diseases probably exceeds the conservative estimates presented here. For example, a person with bone metastases would incur costs to treat the bone manifestation, even though the cancer, not the bone condition, is the primary etiology.
ICD-9-CM codes included in each subcategory for the base and expansive conditions are listed in subsections.
Spine
Special Symptoms or Syndromes, NEC : 307
Migraine : 346
Trigeminal Nerve Disorders : 350
Nerve Root and Plexus Disorders : 353
Dentofacial Anomalies, Including Malocclusion : 524
Pain and Other Symptoms Associated with Female Genital organs : 625
Menopausal and Postmenopausal Disorders : 627
General Symptoms : 780
Symptoms Involving Skin and Other Integumentary Tissue : 782
Symptoms Involving Head and Neck : 784
Symptoms Involving Respiratory System and Other Chest Symptoms : 786
Symptoms Involving Digestive System : 787
Other Symptoms Involving Abdomen and Pelvis : 789
Injury to Other Cranial Nerve(s) : 951
Injury to Nerve Roots and Spinal Plexus : 953
Arthritis and Joint Pain
Gonococcal Infections : 098
Other Venereal Diseases : 099
Other and Unspecified Infectious and Parasitic Diseases : 136
Other and Unspecified Disorders of Metabolism : 277
Purpura and Other Hemorrhagic Conditions : 287
Other Paralytic Syndromes : 344
Mononeuritis of Upper Limb and Mononeuritis Multiplex : 354
Inflammatory and Toxic Neuropathy : 357
Other and Ill-defined Cerebrovascular Disease : 437
Other Peripheral Vascular Disease : 443
Polyarteritis Nodosa and Allied Conditions : 446
Other Disorders of Arteries and Arterioles : 447
Psoriasis and Similar Disorders : 696
Osteoporosis
Other Disorders of Bone and Cartilage : 733
Musculoskeletal Injuries
Open Wound of Neck : 874
Open Wound of Other and Unspecified Sites, Except Limbs : 879
Contusion of Trunk : 922
Contusion of Upper Limb : 923
Contusion of Lower Limb and of Other and Unspecified Sites : 924
Crushing Injury of Trunk : 926
Other Musculoskeletal Conditions
Other Salmonella Infections : 3
Rat-bite Fever : 26
Meningococcal Infection : 36
Rubella : 56
Other Arthropod-borne Diseases : 88
Early Syphilis, Symptomatic : 91
Other forms of Late Syphilis, with Symptoms : 95
Yaws : 102
Late Effects of Tuberculosis : 137
Malignant Neoplasm of Other and Ill-defined Sites : 195
Secondary Malignant Neoplasm of Other Specified Sites : 198
Other Malignant Neoplasms of Lymphoid and Histiocytic Tissue : 202
Multiple Myeloma and Immunoproliferative Neoplasms : 203
Other Benign Neoplasm of Connective and Other Soft Tissue : 215
Neoplasm of Uncertain Behavior of Other and Unspecified Sites and Tissues : 238
Neoplasms of Unspecified Nature : 239
Disorders of Parathyroid Gland : 252
Disorders of Lipoid Metabolism : 272
Disorders of Mineral Metabolism : 275
Hereditary Hemolytic Anemias : 282
Organic Sleep Disorders : 327
Mononeuritis of Lower Limb and Unspecified Site : 355
Peritonitis and Retroperitoneal Infections : 567
Other Cellulitis and Abscess : 682
Other and Unspecified Congenital Anomalies : 759
Late Effects of Injuries to Skin and Subcutaneous Tissues : 906
Certain Early Complications of Trauma : 958
Complications Peculiar to Certain Specified Procedures : 996
Personal History of Other Diseases : V13
Organ or Tissue Replaced By Transplant : V42
Organ or Tissue Replaced By Other Means : V43
Other Postprocedural States : V45
Problems with Head, Neck, and Trunk : V48
Fitting and Adjustment of Other Device : V53
Convalescence and Palliative Care : V66
Follow-up Examination : V67
Special Screening Examination for Bacterial and Spirochetal Diseases : V74
Spine
Special Symptoms or Syndromes, NEC : 307
Migraine : 346
Trigeminal Nerve Disorders : 350
Nerve Root and Plexus Disorders : 353
Dentofacial Anomalies, Including Malocclusion : 524
Pain and Other Symptoms Associated with Female Genital Organs : 625
Menopausal and Postmenopausal Disorders : 627
General Symptoms : 780
Symptoms Involving Skin and Other Integumentary Tissue : 782
Symptoms Involving Head and Neck : 784
Symptoms Involving Respiratory System and Other Chest Symptoms : 786
Symptoms Involving Digestive System : 787
Other Symptoms Involving Abdomen and Pelvis : 789
Injury to Other Cranial Nerve(s) : 951
Injury to Nerve Roots and Spinal Plexus : 953
Arthritis and Joint Pain
Gonococcal Infections : 098
Other Venereal Diseases : 099
Other and Unspecified Infectious and Parasitic Diseases : 136
Other and Unspecified Disorders of Metabolism : 277
Purpura and Other Hemorrhagic Conditions : 287
Other Paralytic Syndromes : 344
Mononeuritis of Upper Limb and Mononeuritis Multiplex : 354
Inflammatory and Toxic Neuropathy : 357
Other and Ill-defined Cerebrovascular Disease : 437
Other Peripheral Vascular Disease : 443
Polyarteritis Nodosa and Allied Conditions : 446
Other Disorders of Arteries and Arterioles : 447
Psoriasis and Similar Disorders : 696
Osteoporosis
Due to small sample sizes, no additional codes were included in the expansive analysis
Musculoskeletal Injuries
Open Wound of Neck : 874
Open Wound of Other and Unspecified Sites, Except Limbs : 879
Contusion of Trunk : 922
Contusion of Upper Limb : 923
Contusion of Lower Limb and of Other and Unspecified Sites : 924
Crushing Injury of Trunk : 926
Other Musculoskeletal Conditions
Other Salmonella Infections : 3
Rat-bite Fever : 26
Meningococcal Infection : 36
Rubella : 56
Other Arthropod-borne Diseases : 88
Early Syphilis, Symptomatic : 91
Other forms of Late Syphilis, with Symptoms : 95
Yaws : 102
Late Effects of Tuberculosis : 137
Malignant Neoplasm of Other and Ill-defined Sites : 195
Secondary Malignant Neoplasm of Other Specified Sites : 198
Other Malignant Neoplasms of Lymphoid and Histiocytic Tissue : 202
Multiple Myeloma and Immunoproliferative Neoplasms : 203
Other Benign Neoplasm of Connective and Other Soft Tissue : 215
Neoplasm of Uncertain Behavior of Other and Unspecified Sites and Tissues : 238
Neoplasms of Unspecified Nature : 239
Disorders of Parathyroid Gland : 252
Disorders of Lipoid Metabolism : 272
Disorders of Mineral Metabolism : 275
Hereditary Hemolytic Anemias : 282
Organic Sleep Disorders : 327
Mononeuritis of Lower Limb and Unspecified Site : 355
Peritonitis and Retroperitoneal Infections : 567
Other Cellulitis and Abscess : 682
Other and Unspecified Congenital Anomalies : 759
Late Effects of Injuries to Skin and Subcutaneous Tissues : 906
Certain Early Complications of Trauma : 958
Complications Peculiar to Certain Specified Procedures : 996
Personal History of Other Diseases : V13
Organ or Tissue Replaced By Transplant : V42
Organ or Tissue Replaced By Other Means : V43
Other Postprocedural States : V45
Problems with Head, Neck, and Trunk : V48
Fitting and Adjustment of Other Device : V53
Convalescence and Palliative Care : V66
Follow-up Examination : V67
Special Screening Examination for Bacterial and Spirochetal Diseases : V74
Arthritis and Spine Conditions
Gout : 274
Osteoarthritis and Allied Diseases : 714, priority nonRA with self-report of 716 or 719
Rheumatoid Arthritis : 714 and priority RA
Other/Unspecified Disorders of the Back : 724
Connective Tissue Disease : 710.9
Additional data on costs can be found directly in the data tables associated with this chapter. Due to limited variability, small samples, and the desire to highlight primary key findings, not all data in the tables is discussed. In addition, data on specific conditions (spine, arthritis and related conditions, osteoporosis, and injuries), as well as the child and adolescent section, are discussed within the pages relative to each condition or population.
The two tables below will help identify specific Economic Cost tables that contain data of interest. To enlarge it, click on the table of interest. To download the Tables by Title and File click here [1751]. To download the Tables by Title and Content, click here [1752].
To view all musculoskeletal data tables, select the Tables tab at the top of any page in this section. PDF and CSV files of all tables in the Economic Cost section also can be downloaded in a zip file from the Tables tab.
 [1754]
 [1756]
 Economic cost for musculoskeletal-related health care diseases presented in this book are based on data from the Medical Expenditures Panel Survey (MEPS) using a methodology developed by the principal author and colleagues at the U.S. Centers for Disease Control (CDC).1,2,3,4,5 The MEPS is a comprehensive data source designed for cost of illness studies.6,7,8,9 The MEPS uses a complex multistage probability sample of the U.S. population and annually queries this sample three times about their medical conditions, health care utilization, and employment status, and provides information on the charges and expenditures associated with medical utilization. The authors use expenditure information to produce two types of cost estimates. The first, total cost, is an indication of all medical care costs and earnings losses incurred by persons with a musculoskeletal disease, regardless of the condition for which the cost was incurred. The second, incremental cost, is an estimate of the magnitude of cost that would be incurred beyond those experienced by persons of similar demographic and health characteristics but who do not have one or more musculoskeletal disease. Cost estimates are produced as the mean per person medical care cost and as the aggregate, or sum of mean costs overall, associated with all persons with musculoskeletal diseases.
Early editions of this book based estimates of the economic impact of musculoskeletal diseases on the Rice cost of illness methodology.10,11 The Rice model utilized the National Hospital Discharge Survey (NHDS) and other available national health care data sources, such as the National Health Interview Survey.12 All costs associated with hospitalizations or treatments for persons with a musculoskeletal disease listed as the primary, or 1st, diagnosis were included in the model. The Rice model defines direct cost as those associated with all components of medical care (i.e., inpatient and outpatient care, medications, devices, and costs associated with procuring medical care), and indirect cost as those associated with wage loss due to morbidity or mortality, plus an estimate of intangible costs.
In the Rice model, mortality accounted for 7% of total indirect medical cost for all conditions. The MEPS data do not provide a comparable method for calculating wage loss associated with mortality. Hence, total cost presented here represents an under count by a similar percentage. Because musculoskeletal diseases have a smaller impact on mortality than most other major categories of illness, the under count will be an unknown, but smaller, percentage.
Comparing total cost for 1995, the last year that Rice updated her estimates,11 updated to 1996 terms, the first year for which MEPS data is available, and omitting cost associated with mortality, the current analysis results in $207 billion in total cost associated with musculoskeletal diseases using the Rice method and about $143 billion using the MEPS database. The difference may be due to allocating a higher proportion of diagnoses to the musculoskeletal classification in the Rice study. The difference suggests that inferring time changes between the Rice studies and those using MEPS should be done with caution.
A series of papers provide a detailed description of the methods of estimating total and incremental direct and indirect cost of conditions, and outline the regression model used to adjust for differences of persons with and without musculoskeletal diseases due to demographic characteristics and health status.2,4 As in our previous work, we applied a two-stage model to estimate musculoskeletal condition-attributable costs for ambulatory, inpatient, prescription, and other expenditures, and a four-stage model for overall expenditures. However, the present analysis differs from prior analysis due to the use of a generalized linear model with a gamma distribution and a log-link, as opposed to a log transformation with a smearing estimate applied to back-transformed predicted values, in the stages predicting costs among individuals with any positive expenditures.
Although generally, prevalence and cost associated with musculoskeletal diseases increase over time, sampling variability in the MEPS does not reflect this in each successive year. The impact of sampling variability is partially mitigated by smoothing, or averaging, data across 3-year periods.
Links:
[1] https://bmus.latticegroup.com/file/bmuse4leading-causes-yldspng
[2] https://bmus.latticegroup.com/docs/bmus_e4_Leading%20causes%20of%20YLDs.png
[3] https://bmus.latticegroup.com/file/bmuse4g101png
[4] https://bmus.latticegroup.com/docs/bmus_e4_G1.0.1.png
[5] https://bmus.latticegroup.com/file/bmuse4g102png
[6] https://bmus.latticegroup.com/docs/bmus_e4_G1.0.2.png
[7] http://www.census.gov/newsroom/press-releases/2016/cb16-54.html
[8] https://www.cia.gov/library/publications/the-world-factbook/geos/us.html
[9] http://www.healthdata.org/research-article/global-regional-and-national-incidence-prevalence-and-years-lived-disability-2013
[10] http://www.census.gov/population/projections/data/national/2014/downloadablefiles.html
[11] https://bmus.latticegroup.com/docs/bmus_e4_T1.5.1.pdf
[12] https://bmus.latticegroup.com/docs/bmus_e4_T1.5.1.csv
[13] https://bmus.latticegroup.com/docs/bmus_e4_T1.1.2.pdf
[14] https://bmus.latticegroup.com/docs/bmus_e4_T1.1.2.csv
[15] https://bmus.latticegroup.com/file/bmuse4g1a1png
[16] https://bmus.latticegroup.com/docs/bmus_e4_G1.A.1.png
[17] https://bmus.latticegroup.com/docs/bmus_e4_T1.1.1.pdf
[18] https://bmus.latticegroup.com/docs/bmus_e4_T1.1.1.csv
[19] https://bmus.latticegroup.com/file/bmuse4g1a2png
[20] https://bmus.latticegroup.com/docs/bmus_e4_G1.A.2.png
[21] https://bmus.latticegroup.com/docs/bmus_e4_T1.1.3.pdf
[22] https://bmus.latticegroup.com/docs/bmus_e4_T1.1.3.csv
[23] https://bmus.latticegroup.com/file/bmuse4g1a3png
[24] https://bmus.latticegroup.com/docs/bmus_e4_G1.A.3.png
[25] https://bmus.latticegroup.com/docs/bmus_e4_T1.3.1.pdf
[26] https://bmus.latticegroup.com/docs/bmus_e4_T1.3.1.csv
[27] https://bmus.latticegroup.com/file/bmuse4g1a4png
[28] https://bmus.latticegroup.com/docs/bmus_e4_G1.A.4.png
[29] https://bmus.latticegroup.com/docs/bmus_e4_T1.1.4.pdf
[30] https://bmus.latticegroup.com/docs/bmus_e4_T1.1.4.csv
[31] https://www.ncbi.nlm.nih.gov/books/NBK45354/
[32] https://bmus.latticegroup.com/docs/bmus_e4_T1.2.1.pdf
[33] https://bmus.latticegroup.com/docs/bmus_e4_T1.2.1.csv
[34] https://bmus.latticegroup.com/file/bmuse4g1b01png
[35] https://bmus.latticegroup.com/docs/bmus_e4_G1.B.0.1.png
[36] https://bmus.latticegroup.com/docs/bmus_e4_T1.2.2.pdf
[37] https://bmus.latticegroup.com/docs/bmus_e4_T1.2.2.csv
[38] https://bmus.latticegroup.com/file/bmuse4g1b02png
[39] https://bmus.latticegroup.com/docs/bmus_e4_G1.B.0.2.png
[40] https://bmus.latticegroup.com/docs/bmus_e4_T1.2.3.pdf
[41] https://bmus.latticegroup.com/docs/bmus_e4_T1.2.3.csv
[42] https://bmus.latticegroup.com/file/bmuse4g1b03png
[43] https://bmus.latticegroup.com/docs/bmus_e4_G1.B.0.3.png
[44] https://bmus.latticegroup.com/docs/bmus_e4_T1.2.4.pdf
[45] https://bmus.latticegroup.com/docs/bmus_e4_T1.2.4.csv
[46] https://bmus.latticegroup.com/file/bmuse4g1b04png
[47] https://bmus.latticegroup.com/docs/bmus_e4_G1.B.0.4.png
[48] https://bmus.latticegroup.com/docs/bmus_e4_T1.2.5.pdf
[49] https://bmus.latticegroup.com/docs/bmus_e4_T1.2.5.csv
[50] https://factfinder.census.gov/faces/nav/jsf/pages/index.xhtml
[51] https://bmus.latticegroup.com/file/bmuse4g1b11png
[52] https://bmus.latticegroup.com/docs/bmus_e4_G1.B.1.1.png
[53] https://bmus.latticegroup.com/docs/bmus_e4_T1.3.2.pdf
[54] https://bmus.latticegroup.com/docs/bmus_e4_T1.3.2.csv
[55] https://bmus.latticegroup.com/docs/bmus_e4_T1.3.3.pdf
[56] https://bmus.latticegroup.com/docs/bmus_e4_T1.3.3.csv
[57] https://bmus.latticegroup.com/docs/bmus_e4_T1.3.4.pdf
[58] https://bmus.latticegroup.com/docs/bmus_e4_T1.3.4.csv
[59] https://bmus.latticegroup.com/docs/bmus_e4_T1.3.5.pdf
[60] https://bmus.latticegroup.com/docs/bmus_e4_T1.3.5.csv
[61] https://bmus.latticegroup.com/file/bmuse4g1b21png
[62] https://bmus.latticegroup.com/docs/bmus_e4_G1.B.2.1.png
[63] https://bmus.latticegroup.com/file/bmuse4g1b22png
[64] https://bmus.latticegroup.com/docs/bmus_e4_G1.B.2.2.png
[65] https://bmus.latticegroup.com/docs/bmus_e4_T1.4.1.pdf
[66] https://bmus.latticegroup.com/docs/bmus_e4_T1.4.1.csv
[67] https://bmus.latticegroup.com/docs/bmus_e4_T1.4.2.pdf
[68] https://bmus.latticegroup.com/docs/bmus_e4_T1.4.2.csv
[69] https://bmus.latticegroup.com/docs/bmus_e4_T1.4.3.pdf
[70] https://bmus.latticegroup.com/docs/bmus_e4_T1.4.3.csv
[71] https://bmus.latticegroup.com/docs/bmus_e4_T1.4.4.pdf
[72] https://bmus.latticegroup.com/docs/bmus_e4_T1.4.4.csv
[73] https://bmus.latticegroup.com/file/bmuse4g1b23png
[74] https://bmus.latticegroup.com/docs/bmus_e4_G1.B.2.3.png
[75] https://bmus.latticegroup.com/file/bmuse4g1b24png
[76] https://bmus.latticegroup.com/docs/bmus_e4_G1.B.2.4.png
[77] https://bmus.latticegroup.com/file/bmuse4g1b24tpng
[78] https://bmus.latticegroup.com/docs/bmus_e4_G1.B.2.4t.png
[79] https://bmus.latticegroup.com/file/bmuse4g1c01png
[80] https://bmus.latticegroup.com/docs/bmus_e4_G1.C.0.1.png
[81] https://bmus.latticegroup.com/docs/bmus_e4_T1.5.2.pdf
[82] https://bmus.latticegroup.com/docs/bmus_e4_T1.5.2.csv
[83] https://bmus.latticegroup.com/docs/bmus_e4_T1.5.3.pdf
[84] https://bmus.latticegroup.com/docs/bmus_e4_T1.5.3.csv
[85] https://bmus.latticegroup.com/docs/bmus_e4_T1.5.4.pdf
[86] https://bmus.latticegroup.com/docs/bmus_e4_T1.5.4.csv
[87] https://bmus.latticegroup.com/file/bmuse4g1c02png
[88] https://bmus.latticegroup.com/docs/bmus_e4_G1.C.0.2.png
[89] https://bmus.latticegroup.com/docs/bmus_e4_T1.6.2.pdf
[90] https://bmus.latticegroup.com/docs/bmus_e4_T1.6.2.csv
[91] https://bmus.latticegroup.com/file/bmuse4g1c03png
[92] https://bmus.latticegroup.com/docs/bmus_e4_G1.C.0.3.png
[93] https://bmus.latticegroup.com/docs/bmus_e4_T1.6.1.pdf
[94] https://bmus.latticegroup.com/docs/bmus_e4_T1.6.1.csv
[95] https://bmus.latticegroup.com/docs/bmus_e4_T1.6.3.pdf
[96] https://bmus.latticegroup.com/docs/bmus_e4_T1.6.3.csv
[97] https://bmus.latticegroup.com/docs/bmus_e4_T1.6.4.pdf
[98] https://bmus.latticegroup.com/docs/bmus_e4_T1.6.4.csv
[99] https://bmus.latticegroup.com/docs/bmus_e4_T1.7.1.pdf
[100] https://bmus.latticegroup.com/docs/bmus_e4_T1.7.1.csv
[101] https://bmus.latticegroup.com/file/bmuse4g1c11png
[102] https://bmus.latticegroup.com/docs/bmus_e4_G1.C.1.1.png
[103] https://bmus.latticegroup.com/docs/bmus_e4_T1.7.2.pdf
[104] https://bmus.latticegroup.com/docs/bmus_e4_T1.7.2.csv
[105] https://bmus.latticegroup.com/file/bmuse4g1c12png
[106] https://bmus.latticegroup.com/docs/bmus_e4_G1.C.1.2.png
[107] https://bmus.latticegroup.com/docs/bmus_e4_T1.8.1.pdf
[108] https://bmus.latticegroup.com/docs/bmus_e4_T1.8.1.csv
[109] https://bmus.latticegroup.com/docs/bmus_e4_T1.8.2.pdf
[110] https://bmus.latticegroup.com/docs/bmus_e4_T1.8.2.csv
[111] https://bmus.latticegroup.com/file/bmuse4g1d11png
[112] https://bmus.latticegroup.com/docs/bmus_e4_G1.D.1.1.png
[113] https://bmus.latticegroup.com/file/bmuse4g1d12png
[114] https://bmus.latticegroup.com/docs/bmus_e4_G1.D.1.2.png
[115] https://bmus.latticegroup.com/file/bmuse4g1d21png
[116] https://bmus.latticegroup.com/docs/bmus_e4_G1.D.2.1.png
[117] https://bmus.latticegroup.com/file/bmuse4g1d22png
[118] https://bmus.latticegroup.com/docs/bmus_e4_G1.D.2.2.png
[119] https://bmus.latticegroup.com/docs/bmus_e4_T1.9.1.pdf
[120] https://bmus.latticegroup.com/docs/bmus_e4_T1.9.1.csv
[121] https://bmus.latticegroup.com/docs/bmus_e4_T1.9.2.pdf
[122] https://bmus.latticegroup.com/docs/bmus_e4_T1.9.2.csv
[123] https://bmus.latticegroup.com/file/bmuse4g1e01png
[124] https://bmus.latticegroup.com/docs/bmus_e4_G1.E.0.1.png
[125] https://bmus.latticegroup.com/docs/bmus_e4_T1.9.3.pdf
[126] https://bmus.latticegroup.com/docs/bmus_e4_T1.9.3.csv
[127] https://bmus.latticegroup.com/file/bmuse4g1e02png
[128] https://bmus.latticegroup.com/docs/bmus_e4_G1.E.0.2.png
[129] https://bmus.latticegroup.com/docs/bmus_e4_T1.9.6.pdf
[130] https://bmus.latticegroup.com/docs/bmus_e4_T1.9.6.csv
[131] https://bmus.latticegroup.com/file/bmuse4g1e03png
[132] https://bmus.latticegroup.com/docs/bmus_e4_G1.E.0.3.png
[133] https://bmus.latticegroup.com/docs/bmus_e4_T1.10.1.pdf
[134] https://bmus.latticegroup.com/docs/bmus_e4_T1.10.1.csv
[135] https://bmus.latticegroup.com/docs/bmus_e4_T1.10.2.pdf
[136] https://bmus.latticegroup.com/docs/bmus_e4_T1.10.2.csv
[137] https://bmus.latticegroup.com/file/bmuse4g1e11png
[138] https://bmus.latticegroup.com/docs/bmus_e4_G1.E.1.1.png
[139] https://bmus.latticegroup.com/docs/bmus_e4_T8.1.1.pdf
[140] https://bmus.latticegroup.com/docs/bmus_e4_T8.1.1.csv
[141] https://bmus.latticegroup.com/file/bmuse4g1f01png
[142] https://bmus.latticegroup.com/docs/bmus_e4_G1.F.0.1.png
[143] https://bmus.latticegroup.com/docs/bmus_e4_T8.6.1.pdf
[144] https://bmus.latticegroup.com/docs/bmus_e4_T8.6.1.csv
[145] https://bmus.latticegroup.com/docs/bmus_e4_T8.12.pdf
[146] https://bmus.latticegroup.com/docs/bmus_e4_T8.12.csv
[147] https://bmus.latticegroup.com/docs/bmus_e4_T8.14.pdf
[148] https://bmus.latticegroup.com/docs/bmus_e4_T8.14.csv
[149] https://bmus.latticegroup.com/file/bmuse4g1f02png
[150] https://bmus.latticegroup.com/docs/bmus_e4_G1.F.0.2.png
[151] https://bmus.latticegroup.com/docs/bmus_e4_T8.9.pdf
[152] https://bmus.latticegroup.com/docs/bmus_e4_T8.9.csv
[153] http://www.boneandjointburden.org/fourth-edition/ia0/funding
[154] http://www.boneandjointburden.org/fourth-edition/iia0/low-back-and-neck-pain
[155] http://www.boneandjointburden.org/fourth-edition/iib0/spinal-deformity
[156] https://bmus.latticegroup.com/docs/bmus_e4_t2a.5.pdf
[157] https://bmus.latticegroup.com/docs/bmus_e4_t2a.5.csv
[158] https://bmus.latticegroup.com/docs/bmus_e4_t2a.1.pdf
[159] https://bmus.latticegroup.com/docs/bmus_e4_t2a.1.csv
[160] https://bmus.latticegroup.com/file/bmuse4g201png
[161] https://bmus.latticegroup.com/docs/bmus_e4_g2.0.1.png
[162] https://bmus.latticegroup.com/file/bmuse4g202png
[163] https://bmus.latticegroup.com/docs/bmus_e4_g2.0.2.png
[164] https://bmus.latticegroup.com/docs/bmus_e4_t2a.11.1.pdf
[165] https://bmus.latticegroup.com/docs/bmus_e4_t2a.11.1.csv
[166] https://bmus.latticegroup.com/docs/bmus_e4_T8.6.2.pdf
[167] https://bmus.latticegroup.com/docs/bmus_e4_T8.6.2.csv
[168] https://bmus.latticegroup.com/docs/bmus_e4_t2a.2.1.pdf
[169] https://bmus.latticegroup.com/docs/bmus_e4_t2a.2.1.csv
[170] https://bmus.latticegroup.com/file/bmuse4g2a01png
[171] https://bmus.latticegroup.com/docs/bmus_e4_g2a.0.1.png
[172] https://bmus.latticegroup.com/docs/bmus_e4_t2a.4.1.pdf
[173] https://bmus.latticegroup.com/docs/bmus_e4_t2a.4.1.csv
[174] https://bmus.latticegroup.com/file/bmuse4g2b01png
[175] https://bmus.latticegroup.com/docs/bmus_e4_g2b.0.1.png
[176] https://bmus.latticegroup.com/docs/bmus_e4_t2a.2.2.pdf
[177] https://bmus.latticegroup.com/docs/bmus_e4_t2a.2.2.csv
[178] https://bmus.latticegroup.com/file/bmuse4g2b02png
[179] https://bmus.latticegroup.com/docs/bmus_e4_g2b.0.2.png
[180] https://bmus.latticegroup.com/file/bmuse4g2b03png
[181] https://bmus.latticegroup.com/docs/bmus_e4_g2b.0.3.png
[182] https://bmus.latticegroup.com/file/bmuse4g2b04png
[183] https://bmus.latticegroup.com/docs/bmus_e4_g2b.0.4.png
[184] https://bmus.latticegroup.com/docs/bmus_e4_t2a.2.3.pdf
[185] https://bmus.latticegroup.com/docs/bmus_e4_t2a.2.3.csv
[186] https://bmus.latticegroup.com/docs/bmus_e4_t2a.2.4.pdf
[187] https://bmus.latticegroup.com/docs/bmus_e4_t2a.2.4.csv
[188] https://bmus.latticegroup.com/docs/bmus_e4_t2a.8.pdf
[189] https://bmus.latticegroup.com/docs/bmus_e4_t2a.8.csv
[190] https://bmus.latticegroup.com/docs/bmus_e4_t2a.9.pdf
[191] https://bmus.latticegroup.com/docs/bmus_e4_t2a.9.csv
[192] https://bmus.latticegroup.com/docs/bmus_e4_t2a.10.1.pdf
[193] https://bmus.latticegroup.com/docs/bmus_e4_t2a.10.1.csv
[194] https://bmus.latticegroup.com/docs/bmus_e4_t2a.10.2.pdf
[195] https://bmus.latticegroup.com/docs/bmus_e4_t2a.10.2.csv
[196] https://bmus.latticegroup.com/docs/bmus_e4_t2a.10.3.pdf
[197] https://bmus.latticegroup.com/docs/bmus_e4_t2a.10.3.csv
[198] https://bmus.latticegroup.com/docs/bmus_e4_t2a.10.4.pdf
[199] https://bmus.latticegroup.com/docs/bmus_e4_t2a.10.4.csv
[200] https://bmus.latticegroup.com/file/bmuse4g2b05png
[201] https://bmus.latticegroup.com/docs/bmus_e4_g2b.0.5.png
[202] https://bmus.latticegroup.com/file/bmuse4g2b06png
[203] https://bmus.latticegroup.com/docs/bmus_e4_g2b.0.6.png
[204] https://bmus.latticegroup.com/file/bmuse4g2c011png
[205] https://bmus.latticegroup.com/docs/bmus_e4_g2c.0.1.1.png
[206] https://bmus.latticegroup.com/docs/bmus_e4_t2a.3.1.pdf
[207] https://bmus.latticegroup.com/docs/bmus_e4_t2a.3.1.csv
[208] https://bmus.latticegroup.com/file/bmuse4g2c012png
[209] https://bmus.latticegroup.com/docs/bmus_e4_g2c.0.1.2.png
[210] https://bmus.latticegroup.com/docs/bmus_e4_t2a.3.2.pdf
[211] https://bmus.latticegroup.com/docs/bmus_e4_t2a.3.2.csv
[212] https://bmus.latticegroup.com/file/bmuse4g2c02png
[213] https://bmus.latticegroup.com/docs/bmus_e4_g2c.0.2.png
[214] https://bmus.latticegroup.com/file/bmuse4g2c03png
[215] https://bmus.latticegroup.com/docs/bmus_e4_g2c.0.3.png
[216] https://bmus.latticegroup.com/file/bmuse4g2c04png
[217] https://bmus.latticegroup.com/docs/bmus_e4_g2c.0.4.png
[218] https://bmus.latticegroup.com/docs/bmus_e4_t2a.3.3.pdf
[219] https://bmus.latticegroup.com/docs/bmus_e4_t2a.3.3.csv
[220] https://bmus.latticegroup.com/docs/bmus_e4_t2a.3.4.pdf
[221] https://bmus.latticegroup.com/docs/bmus_e4_t2a.3.4.csv
[222] https://bmus.latticegroup.com/file/bmuse4g2c05png
[223] https://bmus.latticegroup.com/docs/bmus_e4_g2c.0.5.png
[224] https://bmus.latticegroup.com/file/bmuse4g2c06png
[225] https://bmus.latticegroup.com/docs/bmus_e4_g2c.0.6.png
[226] https://bmus.latticegroup.com/file/bmuse4g2d01png
[227] https://bmus.latticegroup.com/docs/bmus_e4_g2d.0.1.png
[228] https://bmus.latticegroup.com/docs/bmus_e4_t2a.4.2.pdf
[229] https://bmus.latticegroup.com/docs/bmus_e4_t2a.4.2.csv
[230] https://bmus.latticegroup.com/docs/bmus_e4_t2a.4.3.pdf
[231] https://bmus.latticegroup.com/docs/bmus_e4_t2a.4.3.csv
[232] https://bmus.latticegroup.com/docs/bmus_e4_t2a.4.4.pdf
[233] https://bmus.latticegroup.com/docs/bmus_e4_t2a.4.4.csv
[234] https://bmus.latticegroup.com/docs/bmus_e4_t2a.6.pdf
[235] https://bmus.latticegroup.com/docs/bmus_e4_t2a.6.csv
[236] https://bmus.latticegroup.com/docs/bmus_e4_t2a.7.1.pdf
[237] https://bmus.latticegroup.com/docs/bmus_e4_t2a.7.1.csv
[238] https://bmus.latticegroup.com/docs/bmus_e4_t2a.7.2.pdf
[239] https://bmus.latticegroup.com/docs/bmus_e4_t2a.7.2.csv
[240] https://bmus.latticegroup.com/docs/bmus_e4_t2a.7.3.pdf
[241] https://bmus.latticegroup.com/docs/bmus_e4_t2a.7.3.csv
[242] https://bmus.latticegroup.com/docs/bmus_e4_t2a.7.4.pdf
[243] https://bmus.latticegroup.com/docs/bmus_e4_t2a.7.4.csv
[244] https://bmus.latticegroup.com/file/bmuse4g2d02png
[245] https://bmus.latticegroup.com/docs/bmus_e4_g2d.0.2.png
[246] https://bmus.latticegroup.com/file/bmuse4g2d03png
[247] https://bmus.latticegroup.com/docs/bmus_e4_g2d.0.3.png
[248] https://bmus.latticegroup.com/docs/bmus_e4_t2a.11.2.pdf
[249] https://bmus.latticegroup.com/docs/bmus_e4_t2a.11.2.csv
[250] https://bmus.latticegroup.com/docs/bmus_e4_t2a.11.3.pdf
[251] https://bmus.latticegroup.com/docs/bmus_e4_t2a.11.3.csv
[252] https://bmus.latticegroup.com/docs/bmus_e4_t2a.11.4.pdf
[253] https://bmus.latticegroup.com/docs/bmus_e4_t2a.11.4.csv
[254] https://bmus.latticegroup.com/docs/bmus_e4_t2a.12.pdf
[255] https://bmus.latticegroup.com/docs/bmus_e4_t2a.12.csv
[256] https://bmus.latticegroup.com/docs/bmus_e4_t2a.13.1.pdf
[257] https://bmus.latticegroup.com/docs/bmus_e4_t2a.13.1.csv
[258] https://bmus.latticegroup.com/file/bmuse4g2d041png
[259] https://bmus.latticegroup.com/docs/bmus_e4_g2d.0.4.1.png
[260] https://bmus.latticegroup.com/docs/bmus_e4_t2a.13.2.pdf
[261] https://bmus.latticegroup.com/docs/bmus_e4_t2a.13.2.csv
[262] https://bmus.latticegroup.com/docs/bmus_e4_t2a.13.3.pdf
[263] https://bmus.latticegroup.com/docs/bmus_e4_t2a.13.3.csv
[264] https://bmus.latticegroup.com/docs/bmus_e4_t2a.13.4.pdf
[265] https://bmus.latticegroup.com/docs/bmus_e4_t2a.13.4.csv
[266] https://bmus.latticegroup.com/file/bmuse4g2d051png
[267] https://bmus.latticegroup.com/docs/bmus_e4_g2d.0.5.1.png
[268] https://bmus.latticegroup.com/file/bmuse4g2d042png
[269] https://bmus.latticegroup.com/docs/bmus_e4_g2d.0.4.2.png
[270] https://bmus.latticegroup.com/file/bmuse4g2d052png
[271] https://bmus.latticegroup.com/docs/bmus_e4_g2d.0.5.2.png
[272] https://bmus.latticegroup.com/docs/bmus_e4_t2a.15.pdf
[273] https://bmus.latticegroup.com/docs/bmus_e4_t2a.15.csv
[274] https://bmus.latticegroup.com/file/bmuse4g2e01png
[275] https://bmus.latticegroup.com/docs/bmus_e4_g2e.0.1.png
[276] https://bmus.latticegroup.com/docs/bmus_e4_t2a.14.pdf
[277] https://bmus.latticegroup.com/docs/bmus_e4_t2a.14.csv
[278] https://bmus.latticegroup.com/file/bmuse4g2e02png
[279] https://bmus.latticegroup.com/docs/bmus_e4_g2e.0.2.png
[280] https://bmus.latticegroup.com/docs/bmus_e4_t2a.16.1.pdf
[281] https://bmus.latticegroup.com/docs/bmus_e4_t2a.16.1.csv
[282] https://bmus.latticegroup.com/file/bmuse4g2e03png
[283] https://bmus.latticegroup.com/docs/bmus_e4_g2e.0.3.png
[284] https://bmus.latticegroup.com/docs/bmus_e4_t2a.16.2.pdf
[285] https://bmus.latticegroup.com/docs/bmus_e4_t2a.16.2.csv
[286] https://bmus.latticegroup.com/file/bmuse4g2e04png
[287] https://bmus.latticegroup.com/docs/bmus_e4_g2e.0.4.png
[288] https://bmus.latticegroup.com/file/bmuse4g2e05png
[289] https://bmus.latticegroup.com/docs/bmus_e4_g2e.0.5.png
[290] https://bmus.latticegroup.com/docs/bmus_e4_t2a.17.pdf
[291] https://bmus.latticegroup.com/docs/bmus_e4_t2a.17.csv
[292] https://bmus.latticegroup.com/file/bmuse4g2e06png
[293] https://bmus.latticegroup.com/docs/bmus_e4_g2e.0.6.png
[294] https://bmus.latticegroup.com/docs/bmus_e4_t2a.18.pdf
[295] https://bmus.latticegroup.com/docs/bmus_e4_t2a.18.csv
[296] https://bmus.latticegroup.com/file/bmuse4g2e07png
[297] https://bmus.latticegroup.com/docs/bmus_e4_g2e.0.7.png
[298] https://bmus.latticegroup.com/docs/bmus_e4_t2a.19.pdf
[299] https://bmus.latticegroup.com/docs/bmus_e4_t2a.19.csv
[300] https://bmus.latticegroup.com/docs/bmus_e4_t2a.20.pdf
[301] https://bmus.latticegroup.com/docs/bmus_e4_t2a.20.csv
[302] https://bmus.latticegroup.com/file/bmuse4g2e08png
[303] https://bmus.latticegroup.com/docs/bmus_e4_g2e.0.8.png
[304] https://bmus.latticegroup.com/docs/bmus_e4_t2a.21.pdf
[305] https://bmus.latticegroup.com/docs/bmus_e4_t2a.21.csv
[306] https://bmus.latticegroup.com/file/bmuse4g2f01png
[307] https://bmus.latticegroup.com/docs/bmus_e4_g2f.0.1.png
[308] https://bmus.latticegroup.com/file/bmuse4g2g01png
[309] https://bmus.latticegroup.com/docs/bmus_e4_g2g.0.1.png
[310] https://bmus.latticegroup.com/docs/bmus_e4_T8.2.2.pdf
[311] https://bmus.latticegroup.com/docs/bmus_e4_T8.2.2.csv
[312] https://bmus.latticegroup.com/file/bmuse4g2g02png
[313] https://bmus.latticegroup.com/docs/bmus_e4_g2g.0.2.png
[314] https://bmus.latticegroup.com/docs/bmus_e4_T8.4.2.pdf
[315] https://bmus.latticegroup.com/docs/bmus_e4_T8.4.2.csv
[316] https://bmus.latticegroup.com/file/bmuse4g2g03png
[317] https://bmus.latticegroup.com/docs/bmus_e4_g2g.0.3.png
[318] https://bmus.latticegroup.com/file/bmuse4g2g04png
[319] https://bmus.latticegroup.com/docs/bmus_e4_g2g.0.4.png
[320] https://bmus.latticegroup.com/file/bmuse4g2g05png
[321] https://bmus.latticegroup.com/docs/bmus_e4_g2g.0.5.png
[322] http://www.boneandjointburden.org/fourth-edition/iiaf0/economic-burden
[323] https://bmus.latticegroup.com/docs/bmus_e4_spine%20ICD-9%20to%20ICD-10.pdf
[324] https://bmus.latticegroup.com/docs/bmus_e4_T2B.1.0.pdf
[325] https://bmus.latticegroup.com/docs/bmus_e4_T2B.1.0.csv
[326] https://bmus.latticegroup.com/docs/bmus_e4_T2B.2.0.pdf
[327] https://bmus.latticegroup.com/docs/bmus_e4_T2B.2.0.csv
[328] https://bmus.latticegroup.com/docs/bmus_e4_T2B.2.1.pdf
[329] https://bmus.latticegroup.com/docs/bmus_e4_T2B.2.1.csv
[330] https://bmus.latticegroup.com/file/bmuse4g2b210png
[331] https://bmus.latticegroup.com/docs/bmus_e4_g2b.2.1.0.png
[332] https://bmus.latticegroup.com/file/cobb-anglepng
[333] https://bmus.latticegroup.com/docs/cobb-angle.png
[334] https://bmus.latticegroup.com/file/adolescent-prevalencepng
[335] https://bmus.latticegroup.com/docs/adolescent%20prevalence.png
[336] https://bmus.latticegroup.com/file/congenital-scoliosis-syndromespng
[337] https://bmus.latticegroup.com/docs/congenital%20scoliosis%20syndromes.png
[338] https://www.srs.org/patients-and-families/conditions-and-treatments/parents/scoliosis
[339] http://www.ncbi.nlm.nih.gov/pubmed/15931035
[340] http://www.wheelessonline.com/ortho/congenital_scoliosis_and_vertebral_defects
[341] https://bmus.latticegroup.com/docs/bmus_e4_T2B.2.2.pdf
[342] https://bmus.latticegroup.com/docs/bmus_e4_T2B.2.2.csv
[343] https://bmus.latticegroup.com/file/bmuse4g2b211png
[344] https://bmus.latticegroup.com/docs/bmus_e4_g2b.2.1.1.png
[345] https://bmus.latticegroup.com/docs/bmus_e4_T2B.5.2.pdf
[346] https://bmus.latticegroup.com/docs/bmus_e4_T2B.5.2.csv
[347] https://bmus.latticegroup.com/file/bmuse4g2b212png
[348] https://bmus.latticegroup.com/docs/bmus_e4_g2b.2.1.2.png
[349] https://bmus.latticegroup.com/docs/bmus_e4_T2B.3.2.pdf
[350] https://bmus.latticegroup.com/docs/bmus_e4_T2B.3.2.csv
[351] https://bmus.latticegroup.com/file/bmuse4g2b213png
[352] https://bmus.latticegroup.com/docs/bmus_e4_g2b.2.1.3.png
[353] https://bmus.latticegroup.com/file/bmuse4g2b214png
[354] https://bmus.latticegroup.com/docs/bmus_e4_g2b.2.1.4.png
[355] https://bmus.latticegroup.com/docs/bmus_e4_T2B.4.2.pdf
[356] https://bmus.latticegroup.com/docs/bmus_e4_T2B.4.2.csv
[357] https://bmus.latticegroup.com/file/bmuse4g2b221png
[358] https://bmus.latticegroup.com/docs/bmus_e4_g2b.2.2.1.png
[359] https://bmus.latticegroup.com/docs/bmus_e4_T2B.2.3.pdf
[360] https://bmus.latticegroup.com/docs/bmus_e4_T2B.2.3.csv
[361] https://bmus.latticegroup.com/docs/bmus_e4_T2B.2.4.pdf
[362] https://bmus.latticegroup.com/docs/bmus_e4_T2B.2.4.csv
[363] https://bmus.latticegroup.com/docs/bmus_e4_T2B.5.0.1.pdf
[364] https://bmus.latticegroup.com/docs/bmus_e4_T2B.5.0.1.csv
[365] https://bmus.latticegroup.com/docs/bmus_e4_T2B.5.0.2.pdf
[366] https://bmus.latticegroup.com/docs/bmus_e4_T2B.5.0.2.csv
[367] https://bmus.latticegroup.com/docs/bmus_e4_T2B.5.1.pdf
[368] https://bmus.latticegroup.com/docs/bmus_e4_T2B.5.1.csv
[369] https://bmus.latticegroup.com/file/bmuse4g2b222png
[370] https://bmus.latticegroup.com/docs/bmus_e4_g2b.2.2.2.png
[371] https://bmus.latticegroup.com/file/bmuse4g2b223png
[372] https://bmus.latticegroup.com/docs/bmus_e4_g2b.2.2.3.png
[373] https://bmus.latticegroup.com/file/bmuse4g2b224png
[374] https://bmus.latticegroup.com/docs/bmus_e4_g2b.2.2.4.png
[375] https://bmus.latticegroup.com/file/sagittal-plane-deformitypng
[376] https://bmus.latticegroup.com/docs/sagittal%20plane%20deformity.png
[377] https://bmus.latticegroup.com/file/bmuse4g2b31png
[378] https://bmus.latticegroup.com/docs/bmus_e4_g2b.3.1.png
[379] https://bmus.latticegroup.com/file/bmuse4g2b32png
[380] https://bmus.latticegroup.com/docs/bmus_e4_g2b.3.2.png
[381] https://bmus.latticegroup.com/file/bmuse4g2b33png
[382] https://bmus.latticegroup.com/docs/bmus_e4_g2b.3.3.png
[383] https://bmus.latticegroup.com/file/bmuse4g2b34png
[384] https://bmus.latticegroup.com/docs/bmus_e4_g2b.3.4.png
[385] https://bmus.latticegroup.com/docs/bmus_e4_T2B.6.0.pdf
[386] https://bmus.latticegroup.com/docs/bmus_e4_T2B.6.0.csv
[387] https://bmus.latticegroup.com/file/bmuse4g2b41png
[388] https://bmus.latticegroup.com/docs/bmus_e4_g2b.4.1.png
[389] https://bmus.latticegroup.com/docs/bmus_e4_T2B.3.1.pdf
[390] https://bmus.latticegroup.com/docs/bmus_e4_T2B.3.1.csv
[391] https://bmus.latticegroup.com/file/bmuse4g3a01png
[392] https://bmus.latticegroup.com/docs/bmus_e4_g3a.0.1.png
[393] https://bmus.latticegroup.com/docs/bmus_e4_t3.0.pdf
[394] http://www.boneandjointburden.org/fourth-edition/iiia0/arthritis-and-other-rheumatic-conditions
[395] http://www.boneandjointburden.org/fourth-edition/iiib0/joint-disease-arthritis-patient-populations
[396] http://www.cdc.gov/arthritis/data_statistics/case_definition.htm
[397] https://bmus.latticegroup.com/docs/bmus_e4_t3a.1.1.pdf
[398] https://bmus.latticegroup.com/docs/bmus_e4_t3a.1.1.csv
[399] https://bmus.latticegroup.com/file/bmuse4g3a201png
[400] https://bmus.latticegroup.com/docs/bmus_e4_g3a.2.0.1.png
[401] http://www.boneandjointburden.org/fourth-edition/iiib60/juvenile-arthritis
[402] http://www.fmaware.org/about-fibromyalgia/prevalence
[403] http://www.boneandjointburden.org/fourth-edition/iiia90/icd-9-cm-codes-aorc
[404] https://bmus.latticegroup.com/docs/bmus_e4_t3a.3.0.1.pdf
[405] https://bmus.latticegroup.com/docs/bmus_e4_t3a.3.0.1.csv
[406] https://bmus.latticegroup.com/file/bmuse4g3a301png
[407] https://bmus.latticegroup.com/docs/bmus_e4_g3a.3.0.1.png
[408] https://bmus.latticegroup.com/docs/bmus_e4_t3a.3.0.2.pdf
[409] https://bmus.latticegroup.com/docs/bmus_e4_t3a.3.0.2.csv
[410] https://bmus.latticegroup.com/docs/bmus_e4_t3a.3.0.3.pdf
[411] https://bmus.latticegroup.com/docs/bmus_e4_t3a.3.0.3.csv
[412] https://bmus.latticegroup.com/docs/bmus_e4_t3a.3.0.4.pdf
[413] https://bmus.latticegroup.com/docs/bmus_e4_t3a.3.0.4.csv
[414] https://bmus.latticegroup.com/docs/bmus_e4_t3a.3.0.5.pdf
[415] https://bmus.latticegroup.com/docs/bmus_e4_t3a.3.0.5.csv
[416] https://bmus.latticegroup.com/docs/bmus_e4_t3a.3.1.0.1.pdf
[417] https://bmus.latticegroup.com/docs/bmus_e4_t3a.3.1.0.1.csv
[418] https://bmus.latticegroup.com/docs/bmus_e4_t3a.3.1.0.2.pdf
[419] https://bmus.latticegroup.com/docs/bmus_e4_t3a.3.1.0.2.csv
[420] https://bmus.latticegroup.com/docs/bmus_e4_t3a.3.1.0.3.pdf
[421] https://bmus.latticegroup.com/docs/bmus_e4_t3a.3.1.0.3.csv
[422] https://bmus.latticegroup.com/docs/bmus_e4_t3a.3.1.0.4.pdf
[423] https://bmus.latticegroup.com/docs/bmus_e4_t3a.3.1.0.4.csv
[424] https://bmus.latticegroup.com/file/bmuse4g3a3101png
[425] https://bmus.latticegroup.com/docs/bmus_e4_g3a.3.1.0.1.png
[426] https://bmus.latticegroup.com/file/bmuse4g3a3102png
[427] https://bmus.latticegroup.com/docs/bmus_e4_g3a.3.1.0.2.png
[428] https://bmus.latticegroup.com/docs/bmus_e4_t3a.3.1.1.1.pdf
[429] https://bmus.latticegroup.com/docs/bmus_e4_t3a.3.1.1.1.csv
[430] https://bmus.latticegroup.com/docs/bmus_e4_t3a.3.1.1.2.pdf
[431] https://bmus.latticegroup.com/docs/bmus_e4_t3a.3.1.1.2.csv
[432] https://bmus.latticegroup.com/docs/bmus_e4_t3a.3.1.1.3.pdf
[433] https://bmus.latticegroup.com/docs/bmus_e4_t3a.3.1.1.3.csv
[434] https://bmus.latticegroup.com/docs/bmus_e4_t3a.3.1.1.4.pdf
[435] https://bmus.latticegroup.com/docs/bmus_e4_t3a.3.1.1.4.csv
[436] https://bmus.latticegroup.com/file/bmuse4g3a3111png
[437] https://bmus.latticegroup.com/docs/bmus_e4_g3a.3.1.1.1.png
[438] http://www.boneandjointburden.org/fourth-edition/iiia50/economic-burden-aorc
[439] https://bmus.latticegroup.com/file/bmuse4g3a3121png
[440] https://bmus.latticegroup.com/docs/bmus_e4_g3a.3.1.2.1.png
[441] https://bmus.latticegroup.com/docs/bmus_e4_t3a.3.1.3.1.pdf
[442] https://bmus.latticegroup.com/docs/bmus_e4_t3a.3.1.3.1.csv
[443] https://bmus.latticegroup.com/docs/bmus_e4_t3a.3.1.3.2.pdf
[444] https://bmus.latticegroup.com/docs/bmus_e4_t3a.3.1.3.2.csv
[445] https://bmus.latticegroup.com/docs/bmus_e4_t3a.3.1.3.3.pdf
[446] https://bmus.latticegroup.com/docs/bmus_e4_t3a.3.1.3.3.csv
[447] https://bmus.latticegroup.com/docs/bmus_e4_t3a.3.1.3.4.pdf
[448] https://bmus.latticegroup.com/docs/bmus_e4_t3a.3.1.3.4.csv
[449] https://bmus.latticegroup.com/file/bmuse4g3a3131png
[450] https://bmus.latticegroup.com/docs/bmus_e4_g3a.3.1.3.1.png
[451] https://bmus.latticegroup.com/docs/bmus_e4_t3a.3.2.0.1.pdf
[452] https://bmus.latticegroup.com/docs/bmus_e4_t3a.3.2.0.1.csv
[453] https://bmus.latticegroup.com/docs/bmus_e4_t3a.3.2.0.2.pdf
[454] https://bmus.latticegroup.com/docs/bmus_e4_t3a.3.2.0.2.csv
[455] https://bmus.latticegroup.com/docs/bmus_e4_t3a.3.2.0.3.pdf
[456] https://bmus.latticegroup.com/docs/bmus_e4_t3a.3.2.0.3.csv
[457] https://bmus.latticegroup.com/docs/bmus_e4_t3a.3.2.0.4.pdf
[458] https://bmus.latticegroup.com/docs/bmus_e4_t3a.3.2.0.4.csv
[459] https://bmus.latticegroup.com/file/bmuse4g3a3201png
[460] https://bmus.latticegroup.com/docs/bmus_e4_g3a.3.2.0.1.png
[461] https://bmus.latticegroup.com/file/bmuse4g3a3202png
[462] https://bmus.latticegroup.com/docs/bmus_e4_g3a.3.2.0.2.png
[463] https://bmus.latticegroup.com/file/bmuse4g3a3203png
[464] https://bmus.latticegroup.com/docs/bmus_e4_g3a.3.2.0.3.png
[465] https://bmus.latticegroup.com/file/bmuse4g3a3204png
[466] https://bmus.latticegroup.com/docs/bmus_e4_g3a.3.2.0.4.png
[467] https://bmus.latticegroup.com/docs/bmus_e4_t3a.3.2.1.1.pdf
[468] https://bmus.latticegroup.com/docs/bmus_e4_t3a.3.2.1.1.csv
[469] https://bmus.latticegroup.com/docs/bmus_e4_t3a.3.2.1.2.pdf
[470] https://bmus.latticegroup.com/docs/bmus_e4_t3a.3.2.1.2.csv
[471] https://bmus.latticegroup.com/docs/bmus_e4_t3a.3.2.1.3.pdf
[472] https://bmus.latticegroup.com/docs/bmus_e4_t3a.3.2.1.3.csv
[473] https://bmus.latticegroup.com/docs/bmus_e4_t3a.3.2.1.4.pdf
[474] https://bmus.latticegroup.com/docs/bmus_e4_t3a.3.2.1.4.csv
[475] https://bmus.latticegroup.com/docs/bmus_e4_t3a.3.2.2.1.pdf
[476] https://bmus.latticegroup.com/docs/bmus_e4_t3a.3.2.2.1.csv
[477] https://bmus.latticegroup.com/docs/bmus_e4_t3a.3.2.2.2.pdf
[478] https://bmus.latticegroup.com/docs/bmus_e4_t3a.3.2.2.2.csv
[479] https://bmus.latticegroup.com/docs/bmus_e4_t3a.3.2.2.3.pdf
[480] https://bmus.latticegroup.com/docs/bmus_e4_t3a.3.2.2.3.csv
[481] https://bmus.latticegroup.com/docs/bmus_e4_t3a.3.2.2.4.pdf
[482] https://bmus.latticegroup.com/docs/bmus_e4_t3a.3.2.2.4.csv
[483] https://bmus.latticegroup.com/docs/bmus_e4_t3a.3.2.3.2.pdf
[484] https://bmus.latticegroup.com/docs/bmus_e4_t3a.3.2.3.2.csv
[485] https://bmus.latticegroup.com/docs/bmus_e4_t3a.3.2.3.1.pdf
[486] https://bmus.latticegroup.com/docs/bmus_e4_t3a.3.2.3.1.csv
[487] https://bmus.latticegroup.com/docs/bmus_e4_t3a.3.2.3.4.pdf
[488] https://bmus.latticegroup.com/docs/bmus_e4_t3a.3.2.3.4.csv
[489] https://bmus.latticegroup.com/docs/bmus_e4_t3a.4.1.1.pdf
[490] https://bmus.latticegroup.com/docs/bmus_e4_t3a.4.1.1.csv
[491] https://bmus.latticegroup.com/docs/bmus_e4_t3a.4.1.2.pdf
[492] https://bmus.latticegroup.com/docs/bmus_e4_t3a.4.1.2.csv
[493] https://bmus.latticegroup.com/docs/bmus_e4_t3a.4.1.3.pdf
[494] https://bmus.latticegroup.com/docs/bmus_e4_t3a.4.1.3.csv
[495] https://bmus.latticegroup.com/docs/bmus_e4_t3a.4.1.4.pdf
[496] https://bmus.latticegroup.com/docs/bmus_e4_t3a.4.1.4.csv
[497] https://bmus.latticegroup.com/file/bmuse4g3a411png
[498] https://bmus.latticegroup.com/docs/bmus_e4_g3a.4.1.1.png
[499] https://bmus.latticegroup.com/file/bmuse4g3a412png
[500] https://bmus.latticegroup.com/docs/bmus_e4_g3a.4.1.2.png
[501] https://bmus.latticegroup.com/docs/bmus_e4_t3a.4.2.1.pdf
[502] https://bmus.latticegroup.com/docs/bmus_e4_t3a.4.2.1.csv
[503] https://bmus.latticegroup.com/docs/bmus_e4_t3a.4.2.2.pdf
[504] https://bmus.latticegroup.com/docs/bmus_e4_t3a.4.2.2.csv
[505] https://bmus.latticegroup.com/docs/bmus_e4_t3a.4.2.3.pdf
[506] https://bmus.latticegroup.com/docs/bmus_e4_t3a.4.2.3.csv
[507] https://bmus.latticegroup.com/docs/bmus_e4_t3a.4.2.4.pdf
[508] https://bmus.latticegroup.com/docs/bmus_e4_t3a.4.2.4.csv
[509] https://bmus.latticegroup.com/file/bmuse4g3a421png
[510] https://bmus.latticegroup.com/docs/bmus_e4_g3a.4.2.1.png
[511] https://bmus.latticegroup.com/file/bmuse4g3a422png
[512] https://bmus.latticegroup.com/docs/bmus_e4_g3a.4.2.2.png
[513] http://bmus_e4_t3a.4.3.pdf
[514] http://bmus_e4_t3a.4.3.csv
[515] https://www.cdc.gov/nchs/nhis/nhis_questionnaires.htm
[516] https://doi.org/10.5888/pcd14.160495.
[517] https://www.cdc.gov/pcd/issues/2017/16_0495.htm
[518] http://dx.doi.org/10.15585/mmwr.mm6609e1
[519] http://www.boneandjointburden.org/fourth-edition/viii0/economic-cost
[520] http://www.boneandjointburden.org/fourth-edition/viiia0/definitions
[521] http://www.boneandjointburden.org/fourth-edition/iiia80/icd-9-cm-codes-aorc
[522] https://bmus.latticegroup.com/docs/bmus_e4_T8.4.3.pdf
[523] https://bmus.latticegroup.com/docs/bmus_e4_T8.4.3.csv
[524] https://bmus.latticegroup.com/docs/bmus_e4_T8.5.3.pdf
[525] https://bmus.latticegroup.com/docs/bmus_e4_T8.5.3.csv
[526] https://bmus.latticegroup.com/file/bmuse4g3a701png
[527] https://bmus.latticegroup.com/docs/bmus_e4_g3a.7.0.1.png
[528] https://bmus.latticegroup.com/file/bmuse4g3a702png
[529] https://bmus.latticegroup.com/docs/bmus_e4_g3a.7.0.2.png
[530] https://bmus.latticegroup.com/docs/bmus_e4_T8.6.3.pdf
[531] https://bmus.latticegroup.com/docs/bmus_e4_T8.6.3.csv
[532] https://bmus.latticegroup.com/file/bmuse4g3a703png
[533] https://bmus.latticegroup.com/docs/bmus_e4_g3a.7.0.3.png
[534] https://bmus.latticegroup.com/docs/bmus_e4_T8.15.3.pdf
[535] https://bmus.latticegroup.com/docs/bmus_e4_T8.15.3.csv
[536] http://www.boneandjointburden.org/fourth-edition/iiib10/osteoarthritis
[537] http://www.boneandjointburden.org/fourth-edition/iiib21/rheumatoid-arthritis
[538] http://www.boneandjointburden.org/fourth-edition/iiib30/gout-0
[539] http://www.boneandjointburden.org/fourth-edition/iiib23/connective-tissue-disorders
[540] http://www.hhs.gov/ash/initiatives/mcc/
[541] http://dx.doi.org/10.5888/pcd10.120203
[542] http://www.cdc.gov/arthritis/interventions/marketing-support/1-2-3-approach/index.html
[543] https://www.cdc.gov/arthritis/marketing-support/ambassador-outreach/docs/pdf/ambassador-guide.pdf
[544] http://www.healthypeople.gov/
[545] https://www.healthypeople.gov/
[546] http://www.healthypeople.gov/2020/proposed-objective-landing-page/arthritis-osteoporosis-and-chronic-back-conditions
[547] http://www.healthypeople.gov/2020/data-search/Search-the-DData?&f[0]=field_topic_area%3A3507
[548] http://www.cdc.gov/arthritis/data_statistics/arthritis_codes_2004.pdf
[549] http://www.boneandjointburden.org/fourth-edition/iiib20/inflammatory-arthritis
[550] http://www.boneandjointburden.org/fourth-edition/iiib22/spondyloarthropathies
[551] http://www.boneandjointburden.org/fourth-edition/iiib40/joint-infection
[552] http://www.boneandjointburden.org/fourth-edition/iiib50/fibromyalgia
[553] http://www.boneandjointburden.org/fourth-edition/iiib70/joint-pain-and-joint-replacement
[554] https://bmus.latticegroup.com/docs/bmus_e4_T8.13.pdf
[555] https://bmus.latticegroup.com/docs/bmus_e4_T8.13.csv
[556] https://bmus.latticegroup.com/docs/bmus_e4_T8.22.pdf
[557] https://bmus.latticegroup.com/docs/bmus_e4_T8.22.csv
[558] https://bmus.latticegroup.com/file/bmuse4g3c102png
[559] https://bmus.latticegroup.com/docs/bmus_e4_g3c.1.0.2_0.png
[560] https://bmus.latticegroup.com/file/bmuse4g3c101png
[561] https://bmus.latticegroup.com/docs/bmus_e4_g3c.1.0.1_0.png
[562] https://bmus.latticegroup.com/docs/bmus_e4_t3a.1.1.a.pdf
[563] https://bmus.latticegroup.com/docs/bmus_e4_t3a.1.1.a.csv
[564] https://bmus.latticegroup.com/file/bmuse4g3c101apng
[565] https://bmus.latticegroup.com/docs/bmus_e4_g3c.1.0.1.a.png
[566] https://bmus.latticegroup.com/docs/bmus_e4_t3c.1.0.pdf
[567] https://bmus.latticegroup.com/docs/bmus_e4_t3c.1.0.csv
[568] https://bmus.latticegroup.com/docs/bmus_e4_t3a.5.3.pdf
[569] https://bmus.latticegroup.com/docs/bmus_e4_t3a.5.3.csv
[570] https://bmus.latticegroup.com/file/bmuse4g3c103png-0
[571] https://bmus.latticegroup.com/docs/bmus_e4_g3c.1.0.3_1.png
[572] https://bmus.latticegroup.com/file/bmuse4g3c105png
[573] https://bmus.latticegroup.com/docs/bmus_e4_g3c.1.0.5_0.png
[574] https://bmus.latticegroup.com/file/bmuse4g3c106png
[575] https://bmus.latticegroup.com/docs/bmus_e4_g3c.1.0.6_0.png
[576] https://bmus.latticegroup.com/docs/bmus_e4_Conditions%20Related%20to%20Inflammatory%20Arthritis.pdf
[577] https://www.nras.org.uk/the-das28-score
[578] https://www.rheumatology.org/Portals/0/Files/SDAI%20Form.pdf
[579] https://www.rheumatology.org/Portals/0/Files/CDAI%20Form.pdf
[580] https://bmus.latticegroup.com/file/bmuse4g3c211png
[581] https://bmus.latticegroup.com/docs/bmus_e4_g3c.2.1.1_0.png
[582] https://bmus.latticegroup.com/file/bmuse4g3c212png
[583] https://bmus.latticegroup.com/docs/bmus_e4_g3c.2.1.2_0.png
[584] https://bmus.latticegroup.com/file/bmuse4g3c213png
[585] https://bmus.latticegroup.com/docs/bmus_e4_g3c.2.1.3_0.png
[586] https://bmus.latticegroup.com/file/bmuse4g3c214png
[587] https://bmus.latticegroup.com/docs/bmus_e4_g3c.2.1.4_1.png
[588] https://bmus.latticegroup.com/file/bmuse4g3c215png
[589] https://bmus.latticegroup.com/docs/bmus_e4_g3c.2.1.5_0.png
[590] https://bmus.latticegroup.com/file/bmuse4g3c216png
[591] https://bmus.latticegroup.com/docs/bmus_e4_g3c.2.1.6_0.png
[592] https://bmus.latticegroup.com/docs/bmus_e4_T8.23.pdf
[593] https://bmus.latticegroup.com/docs/bmus_e4_T8.23.csv
[594] https://bmus.latticegroup.com/file/bmuse4g3c217png
[595] https://bmus.latticegroup.com/docs/bmus_e4_g3c.2.1.7_0.png
[596] https://doi.org/10.1136/bmj.k1036
[597] https://www.bmj.com/content/361/bmj.k1036
[598] https://bmus.latticegroup.com/file/bmuse4g3c221png
[599] https://bmus.latticegroup.com/docs/bmus_e4_g3c.2.2.1_0.png
[600] https://bmus.latticegroup.com/file/bmuse4g3c222png
[601] https://bmus.latticegroup.com/docs/bmus_e4_g3c.2.2.2_0.png
[602] https://www.ncbi.nlm.nih.gov/pmc/articles/PMC4470267/
[603] https://www.ncbi.nlm.nih.gov/pubmed/23436774
[604] http://dx.doi.org/10.7812/TPP/15-151
[605] https://www.rheumatology.org/I-Am-A/Patient-Caregiver/Diseases-Conditions/Spondyloarthritis
[606] https://bmus.latticegroup.com/docs/bmus_e4_T8.20.pdf
[607] https://bmus.latticegroup.com/docs/bmus_e4_T8.20.csv
[608] https://bmus.latticegroup.com/file/bmuse4g3c231png
[609] https://bmus.latticegroup.com/docs/bmus_e4_g3c.2.3.1_0.png
[610] https://bmus.latticegroup.com/docs/bmus_e4_t3a.3.1.0.4pdf
[611] https://bmus.latticegroup.com/file/bmuse4g3c232png
[612] https://bmus.latticegroup.com/docs/bmus_e4_g3c.2.3.2_0.png
[613] https://bmus.latticegroup.com/docs/bmus_e4_t3a.3.2.0.4pdf
[614] https://bmus.latticegroup.com/file/bmuse4g3c233png
[615] https://bmus.latticegroup.com/docs/bmus_e4_g3c.2.3.3_0.png
[616] https://bmus.latticegroup.com/docs/bmus_e4_T8.19.pdf
[617] https://bmus.latticegroup.com/docs/bmus_e4_T8.19.csv
[618] https://bmus.latticegroup.com/docs/bmus_e4_T8.21.pdf
[619] https://bmus.latticegroup.com/docs/bmus_e4_T8.21.csv
[620] https://bmus.latticegroup.com/file/bmuse4g3c234png
[621] https://bmus.latticegroup.com/docs/bmus_e4_g3c.2.3.4_0.png
[622] https://bmus.latticegroup.com/file/bmuse4g3c235png
[623] https://bmus.latticegroup.com/docs/bmus_e4_g3c.2.3.5_0.png
[624] https://bmus.latticegroup.com/file/bmuse4g3c236png
[625] https://bmus.latticegroup.com/docs/bmus_e4_g3c.2.3.6_0.png
[626] https://doi.org/10.1093/rheumatology/kel282
[627] https://www.rheumatology.org/I-Am-A/Patient-Caregiver/Diseases
[628] https://resources.lupus.org/entry/facts-and-statistics
[629] https://bmus.latticegroup.com/docs/bmus_e4_T8.24.pdf
[630] https://bmus.latticegroup.com/docs/bmus_e4_T8.24.csv
[631] https://bmus.latticegroup.com/file/bmuse4g3c241png
[632] https://bmus.latticegroup.com/docs/bmus_e4_g3c.2.4.1_1.png
[633] https://bmus.latticegroup.com/file/bmuse4g3c242png
[634] https://bmus.latticegroup.com/docs/bmus_e4_g3c.2.4.2_0.png
[635] https://bmus.latticegroup.com/file/bmuse4g3c243png
[636] https://bmus.latticegroup.com/docs/bmus_e4_g3c.2.4.3_0.png
[637] https://www.medpagetoday.com/resource-center/Gout/Global-Burden/a/54489
[638] http://onlinelibrary.wiley.com/doi/10.1002/14651858.CD008794.pub2/abstract
[639] https://bmus.latticegroup.com/file/bmuse4g3c251png
[640] https://bmus.latticegroup.com/docs/bmus_e4_g3c.2.5.1_0.png
[641] https://www.cdc.gov/arthritis/basics/fibromyalgia.htm
[642] http://www.fmaware.org/about-fibromyalgia/prevalence/
[643] http://www.cdc.gov/arthritis/data_statistics/case_definition/pediatric.htm
[644] https://bmus.latticegroup.com/docs/bmus_e4_t3b.1.pdf
[645] https://bmus.latticegroup.com/docs/bmus_e4_t3b.1.csv
[646] https://bmus.latticegroup.com/file/bmuse4g3b61png
[647] https://bmus.latticegroup.com/docs/bmus_e4_g3b.6.1_0.png
[648] https://bmus.latticegroup.com/file/bmuse4g3b62png
[649] https://bmus.latticegroup.com/docs/bmus_e4_g3b.6.2_0.png
[650] http://www.arthritis.org/arthritis-facts/disease-center/juvenile-arthritis.php
[651] https://www.niams.nih.gov/Health_Info/Juv_Arthritis/juvenile_arthritis_ff.asp
[652] https://bmus.latticegroup.com/docs/bmus_e4_t3a.2.0.pdf
[653] https://bmus.latticegroup.com/docs/bmus_e4_t3a.2.0.csv
[654] https://bmus.latticegroup.com/docs/bmus_e4_t3a.2.1.1.pdf
[655] https://bmus.latticegroup.com/docs/bmus_e4_t3a.2.1.1.csv
[656] https://bmus.latticegroup.com/docs/bmus_e4_t3a.2.1.5.pdf
[657] https://bmus.latticegroup.com/docs/bmus_e4_t3a.2.1.5.csv
[658] https://bmus.latticegroup.com/docs/bmus_e4_t3a.2.1.2.pdf
[659] https://bmus.latticegroup.com/docs/bmus_e4_t3a.2.1.2.csv
[660] https://bmus.latticegroup.com/docs/bmus_e4_t3a.2.1.3.pdf
[661] https://bmus.latticegroup.com/docs/bmus_e4_t3a.2.1.3.csv
[662] https://bmus.latticegroup.com/docs/bmus_e4_t3a.2.1.4.pdf
[663] https://bmus.latticegroup.com/docs/bmus_e4_t3a.2.1.4.csv
[664] https://bmus.latticegroup.com/file/bmuse4g3a211png
[665] https://bmus.latticegroup.com/docs/bmus_e4_g3a.2.1.1_0.png
[666] https://bmus.latticegroup.com/docs/bmus_e4_t3a.5.1.1.pdf
[667] https://bmus.latticegroup.com/docs/bmus_e4_t3a.5.1.1.csv
[668] https://bmus.latticegroup.com/file/bmuse4g3a501png
[669] https://bmus.latticegroup.com/docs/bmus_e4_g3a.5.0.1_0.png
[670] https://bmus.latticegroup.com/docs/bmus_e4_t3a.5.1.2.pdf
[671] https://bmus.latticegroup.com/docs/bmus_e4_t3a.5.1.2.csv
[672] https://bmus.latticegroup.com/docs/bmus_e4_t3a.5.1.3.pdf
[673] https://bmus.latticegroup.com/docs/bmus_e4_t3a.5.1.3.csv
[674] https://bmus.latticegroup.com/docs/bmus_e4_t3a.5.1.4.pdf
[675] https://bmus.latticegroup.com/docs/bmus_e4_t3a.5.1.4.csv
[676] https://bmus.latticegroup.com/docs/bmus_e4_t3a.5.2.pdf
[677] https://bmus.latticegroup.com/docs/bmus_e4_t3a.5.2.csv
[678] https://bmus.latticegroup.com/file/bmuse4g3a511png
[679] https://bmus.latticegroup.com/docs/bmus_e4_g3a.5.1.1_0.png
[680] https://bmus.latticegroup.com/docs/bmus_e4_t3a.5.4.pdf
[681] https://bmus.latticegroup.com/docs/bmus_e4_t3a.5.4.csv
[682] https://bmus.latticegroup.com/docs/bmus_e4_t3a.5.5.pdf
[683] https://bmus.latticegroup.com/docs/bmus_e4_t3a.5.5.csv
[684] https://bmus.latticegroup.com/file/bmuse4g3a512png
[685] https://bmus.latticegroup.com/docs/bmus_e4_g3a.5.1.2_0.png
[686] https://bmus.latticegroup.com/docs/bmus_e4_t3a.5.6.pdf
[687] https://bmus.latticegroup.com/docs/bmus_e4_t3a.5.6.csv
[688] https://bmus.latticegroup.com/file/bmuse4g3a513png
[689] https://bmus.latticegroup.com/docs/bmus_e4_g3a.5.1.3_0.png
[690] https://bmus.latticegroup.com/docs/bmus_e4_t3a.5.7.pdf
[691] https://bmus.latticegroup.com/docs/bmus_e4_t3a.5.7.csv
[692] https://bmus.latticegroup.com/file/bmuse4g3a521png
[693] https://bmus.latticegroup.com/docs/bmus_e4_g3a.5.2.1_0.png
[694] https://bmus.latticegroup.com/file/bmuse4g3a522png
[695] https://bmus.latticegroup.com/docs/bmus_e4_g3a.5.2.2_0.png
[696] https://bmus.latticegroup.com/file/bmuse4g3a523png
[697] https://bmus.latticegroup.com/docs/bmus_e4_g3a.5.2.3_0.png
[698] https://bmus.latticegroup.com/file/bmuse4g3a531png
[699] https://bmus.latticegroup.com/docs/bmus_e4_g3a.5.3.1_0.png
[700] https://bmus.latticegroup.com/docs/bmus_e4_disparities%20by%20region.pdf
[701] https://www.cdc.gov/arthritis/data_statistics/state-data-current.htm
[702] https://bmus.latticegroup.com/file/bmuse4g3b81png
[703] https://bmus.latticegroup.com/docs/bmus_e4_g3b.8.1.png
[704] http://dx.doi.org/10.15585/mmwr.ss6704a1
[705] https://www.rheumatology.org/portals/0/files/ACR-Workforce-Study-2015.pdf
[706] https://bmus.latticegroup.com/docs/arthritis_codes%20icd-9%20to%20icd-10%20crosswalk.pdf
[707] http://www.who.int/chp/topics/Osteoporosis.pdf
[708] https://www.cdc.gov/nchs/nhanes/index.htm
[709] https://bmus.latticegroup.com/docs/bmus_e4_t4a.1.1.pdf
[710] https://bmus.latticegroup.com/docs/bmus_e4_t4a.1.1.csv
[711] https://bmus.latticegroup.com/file/bmuse4g4a11png
[712] https://bmus.latticegroup.com/docs/bmus_e4_g4a.1.1.png
[713] https://bmus.latticegroup.com/docs/bmus_e4_t4a.1.2.pdf
[714] https://bmus.latticegroup.com/docs/bmus_e4_t4a.1.2.csv
[715] https://bmus.latticegroup.com/file/bmuse4g4a12png
[716] https://bmus.latticegroup.com/docs/bmus_e4_g4a.1.2.png
[717] https://bmus.latticegroup.com/docs/bmus_e4_t4a.1.3.pdf
[718] https://bmus.latticegroup.com/docs/bmus_e4_t4a.1.3.csv
[719] https://bmus.latticegroup.com/file/bmuse4g4a13png
[720] https://bmus.latticegroup.com/docs/bmus_e4_g4a.1.3.png
[721] https://bmus.latticegroup.com/file/bmuse4g4a14png
[722] https://bmus.latticegroup.com/docs/bmus_e4_g4a.1.4.png
[723] https://www.hcup-us.ahrq.gov/nisoverview.jsp
[724] https://bmus.latticegroup.com/docs/bmus_e4_t4a.2.1.pdf
[725] https://bmus.latticegroup.com/docs/bmus_e4_t4a.2.1.csv
[726] https://bmus.latticegroup.com/docs/bmus_e4_t4a.2.2.pdf
[727] https://bmus.latticegroup.com/docs/bmus_e4_t4a.2.2.csv
[728] https://bmus.latticegroup.com/file/bmuse4g4a21png
[729] https://bmus.latticegroup.com/docs/bmus_e4_g4a.2.1.png
[730] https://bmus.latticegroup.com/docs/bmus_e4_t4a.2.3.pdf
[731] https://bmus.latticegroup.com/docs/bmus_e4_t4a.2.3.csv
[732] https://bmus.latticegroup.com/file/bmuse4g4a22png
[733] https://bmus.latticegroup.com/docs/bmus_e4_g4a.2.2.png
[734] https://www.hcup-us.ahrq.gov/db/nation/neds/nedsspssloadprog.jsp
[735] https://bmus.latticegroup.com/file/bmuse4g4a23png
[736] https://bmus.latticegroup.com/docs/bmus_e4_g4a.2.3.png
[737] https://bmus.latticegroup.com/docs/bmus_e4_t4a.2.6.pdf
[738] https://bmus.latticegroup.com/docs/bmus_e4_t4a.2.6.csv
[739] https://bmus.latticegroup.com/file/bmuse4g4a24png
[740] https://bmus.latticegroup.com/docs/bmus_e4_g4a.2.4.png
[741] https://bmus.latticegroup.com/docs/bmus_e4_t4a.2.7.pdf
[742] https://bmus.latticegroup.com/docs/bmus_e4_t4a.2.7.csv
[743] https://bmus.latticegroup.com/file/bmuse4g4a25png
[744] https://bmus.latticegroup.com/docs/bmus_e4_g4a.2.5.png
[745] https://bmus.latticegroup.com/docs/bmus_e4_t4a.2.8.pdf
[746] https://bmus.latticegroup.com/docs/bmus_e4_t4a.2.8.csv
[747] https://bmus.latticegroup.com/file/bmuse4g4a26png
[748] https://bmus.latticegroup.com/docs/bmus_e4_g4a.2.6.png
[749] https://www.hcup-us.ahrq.gov/db/nation/neds/nedsdbdocumentation.jsp
[750] https://bmus.latticegroup.com/docs/bmus_e4_t4a.3.1.pdf
[751] https://bmus.latticegroup.com/docs/bmus_e4_t4a.3.1.csv
[752] https://bmus.latticegroup.com/file/bmuse4g4a31png
[753] https://bmus.latticegroup.com/docs/bmus_e4_g4a.3.1.png
[754] https://bmus.latticegroup.com/file/bmuse4g4a32png
[755] https://bmus.latticegroup.com/docs/bmus_e4_g4a.3.2.png
[756] https://bmus.latticegroup.com/docs/bmus_e4_t4a.3.3.pdf
[757] https://bmus.latticegroup.com/docs/bmus_e4_t4a.3.3.csv
[758] https://bmus.latticegroup.com/file/bmuse4g4a33png
[759] https://bmus.latticegroup.com/docs/bmus_e4_g4a.3.3.png
[760] https://bmus.latticegroup.com/file/bmuse4g4a34png
[761] https://bmus.latticegroup.com/docs/bmus_e4_g4a.3.4.png
[762] https://bmus.latticegroup.com/file/bmuse4g4a35png
[763] https://bmus.latticegroup.com/docs/bmus_e4_g4a.3.5.png
[764] https://bmus.latticegroup.com/file/bmuse4g4a36png
[765] https://bmus.latticegroup.com/docs/bmus_e4_g4a.3.6.png
[766] https://bmus.latticegroup.com/docs/bmus_e4_T8.2.4.pdf
[767] https://bmus.latticegroup.com/docs/bmus_e4_T8.2.4.csv
[768] https://bmus.latticegroup.com/file/bmuse4g4a41png
[769] https://bmus.latticegroup.com/docs/bmus_e4_g4a.4.1.png
[770] https://bmus.latticegroup.com/docs/bmus_e4_T8.4.4.pdf
[771] https://bmus.latticegroup.com/docs/bmus_e4_T8.4.4.csv
[772] https://bmus.latticegroup.com/file/bmuse4g4a42png
[773] https://bmus.latticegroup.com/docs/bmus_e4_g4a.4.2.png
[774] https://bmus.latticegroup.com/docs/bmus_e4_T8.6.4.pdf
[775] https://bmus.latticegroup.com/docs/bmus_e4_T8.6.4.csv
[776] https://bmus.latticegroup.com/file/bmuse4g4a43png
[777] https://bmus.latticegroup.com/docs/bmus_e4_g4a.4.3.png
[778] https://bmus.latticegroup.com/file/bmuse4g4a44png
[779] https://bmus.latticegroup.com/docs/bmus_e4_g4a.4.4.png
[780] https://www.fda.gov/Drugs/DrugSafety/ucm229009.htm#safety
[781] https://bmus.latticegroup.com/file/bmuse4g4a51png
[782] https://bmus.latticegroup.com/docs/bmus_e4_g4a.5.1.png
[783] https://bmus.latticegroup.com/file/bmuse4g4a52png
[784] https://bmus.latticegroup.com/docs/bmus_e4_g4a.5.2.png
[785] https://bmus.latticegroup.com/file/bmuse4g4a53png
[786] https://bmus.latticegroup.com/docs/bmus_e4_g4a.5.3.png
[787] https://arapc.com/osteonecrosis-jaw-onj/
[788] https://www.census.gov/population/www/cen2000/briefs/phc-t9/tables/tab03.pdf
[789] https://factfinder.census.gov/faces/tableservices/jsf/pages/productview.xhtml?pid=ACS_15_1YR_S0103&prodType=table
[790] http://nbha.org/fpc
[791] https://www.iofbonehealth.org/fls-course-milan-2015
[792] https://www.ownthebone.org/OTB/About/What_Is_Own_the_Bone.aspx
[793] http://www.asbmr.org/publications/news/newsdetail.aspx?cid=b389a535-8239-453d-a62a-c2f225b5f7ea#.XF9oY7h7nlg
[794] https://www.capturethefracture.org/best-practice-framework
[795] https://www.secondaryfractures.org/
[796] https://www.secondaryfractures.org/clinical-recommendations
[797] https://www.boneandjointburden.org/fourth-edition/va0/self-reported-injuries
[798] https://www.boneandjointburden.org/fourth-edition/vb0/traumatic-injuries
[799] https://www.boneandjointburden.org/fourth-edition/vc0/falls
[800] https://www.boneandjointburden.org/fourth-edition/vd0/workplace-injuries
[801] https://www.boneandjointburden.org/fourth-edition/ve0/sports-injuries
[802] https://www.boneandjointburden.org/fourth-edition/vf0/military-injuries
[803] https://bmus.latticegroup.com/docs/bmus_4e_5a.1.1.pdf
[804] https://bmus.latticegroup.com/docs/bmus_4e_5a.1.1.csv
[805] https://bmus.latticegroup.com/docs/bmus_4e_5b.2.1.pdf
[806] https://bmus.latticegroup.com/docs/bmus_4e_5b.2.1.csv
[807] https://bmus.latticegroup.com/docs/bmus_4e_5a.1.2.pdf
[808] https://bmus.latticegroup.com/docs/bmus_4e_5a.1.2.csv
[809] https://bmus.latticegroup.com/docs/bmus_4e_5a.1.3.pdf
[810] https://bmus.latticegroup.com/docs/bmus_4e_5a.1.3.csv
[811] https://bmus.latticegroup.com/docs/bmus_4e_5a.1.4.pdf
[812] https://bmus.latticegroup.com/docs/bmus_4e_5a.1.4.csv
[813] https://bmus.latticegroup.com/file/bmuse4g5a10png
[814] https://bmus.latticegroup.com/docs/bmus_e4_g5a.1.0.png
[815] https://bmus.latticegroup.com/file/bmuse4g5a111png
[816] https://bmus.latticegroup.com/docs/bmus_e4_g5a.1.1.1.png
[817] https://bmus.latticegroup.com/file/bmuse4g5a112png
[818] https://bmus.latticegroup.com/docs/bmus_e4_g5a.1.1.2.png
[819] https://bmus.latticegroup.com/file/bmuse4g5a113png
[820] https://bmus.latticegroup.com/docs/bmus_e4_g5a.1.1.3.png
[821] https://bmus.latticegroup.com/file/bmuse4g5a114png
[822] https://bmus.latticegroup.com/docs/bmus_e4_g5a.1.1.4.png
[823] https://bmus.latticegroup.com/docs/bmus_4e_5a.2.1.pdf
[824] https://bmus.latticegroup.com/docs/bmus_4e_5a.2.1.csv
[825] https://bmus.latticegroup.com/file/bmuse4g5a121png
[826] https://bmus.latticegroup.com/docs/bmus_e4_g5a.1.2.1.png
[827] https://bmus.latticegroup.com/docs/bmus_4e_5a.2.2.pdf
[828] https://bmus.latticegroup.com/docs/bmus_4e_5a.2.2.csv
[829] https://bmus.latticegroup.com/docs/bmus_4e_5a.2.3.pdf
[830] https://bmus.latticegroup.com/docs/bmus_4e_5a.2.3.csv
[831] https://bmus.latticegroup.com/docs/bmus_4e_5a.2.4.pdf
[832] https://bmus.latticegroup.com/docs/bmus_4e_5a.2.4.csv
[833] https://bmus.latticegroup.com/file/bmuse4g5a122png
[834] https://bmus.latticegroup.com/docs/bmus_e4_g5a.1.2.2.png
[835] https://bmus.latticegroup.com/docs/bmus_4e_5a.3.1.pdf
[836] https://bmus.latticegroup.com/docs/bmus_4e_5a.3.1.csv
[837] https://bmus.latticegroup.com/docs/bmus_4e_5a.3.2.pdf
[838] https://bmus.latticegroup.com/docs/bmus_4e_5a.3.2.csv
[839] https://bmus.latticegroup.com/docs/bmus_4e_5a.3.3.pdf
[840] https://bmus.latticegroup.com/docs/bmus_4e_5a.3.3.csv
[841] https://bmus.latticegroup.com/docs/bmus_4e_5a.3.4.pdf
[842] https://bmus.latticegroup.com/docs/bmus_4e_5a.3.4.csv
[843] https://bmus.latticegroup.com/file/bmuse4g5a123png
[844] https://bmus.latticegroup.com/docs/bmus_e4_g5a.1.2.3.png
[845] https://bmus.latticegroup.com/file/bmuse4g5a124png
[846] https://bmus.latticegroup.com/docs/bmus_e4_g5a.1.2.4.png
[847] https://bmus.latticegroup.com/docs/bmus_4e_5a.4.1.pdf
[848] https://bmus.latticegroup.com/docs/bmus_4e_5a.4.1.csv
[849] https://bmus.latticegroup.com/docs/bmus_4e_5a.4.2.pdf
[850] https://bmus.latticegroup.com/docs/bmus_4e_5a.4.2.csv
[851] https://bmus.latticegroup.com/file/bmuse4g5a125png
[852] https://bmus.latticegroup.com/docs/bmus_e4_g5a.1.2.5.png
[853] https://bmus.latticegroup.com/docs/bmus_4e_5a.4.3.pdf
[854] https://bmus.latticegroup.com/docs/bmus_4e_5a.4.3.csv
[855] https://bmus.latticegroup.com/docs/bmus_4e_5a.5.1.pdf
[856] https://bmus.latticegroup.com/docs/bmus_4e_5a.5.1.csv
[857] https://bmus.latticegroup.com/file/bmuse4g5a131png
[858] https://bmus.latticegroup.com/docs/bmus_e4_g5a.1.3.1.png
[859] https://bmus.latticegroup.com/docs/bmus_4e_5a.5.2.pdf
[860] https://bmus.latticegroup.com/docs/bmus_4e_5a.5.2.csv
[861] https://bmus.latticegroup.com/file/bmuse4g5a132png
[862] https://bmus.latticegroup.com/docs/bmus_e4_g5a.1.3.2.png
[863] https://bmus.latticegroup.com/docs/bmus_4e_5a.5.3.pdf
[864] https://bmus.latticegroup.com/docs/bmus_4e_5a.5.3.csv
[865] https://bmus.latticegroup.com/file/bmuse4g5a133png
[866] https://bmus.latticegroup.com/docs/bmus_e4_g5a.1.3.3.png
[867] https://bmus.latticegroup.com/docs/bmus_4e_5b.0.1.pdf
[868] https://bmus.latticegroup.com/docs/bmus_4e_5b.0.1.csv
[869] https://bmus.latticegroup.com/file/bmuse4g5b01png
[870] https://bmus.latticegroup.com/docs/bmus_e4_g5b.0.1.png
[871] https://www.ncbi.nlm.nih.gov/pmc/articles/PMC3555553/pdf/jpr-6-039.pdf
[872] https://bmus.latticegroup.com/docs/bmus_4e_5b.1.1.pdf
[873] https://bmus.latticegroup.com/docs/bmus_4e_5b.1.1.csv
[874] https://bmus.latticegroup.com/file/bmuse4g5b11png
[875] https://bmus.latticegroup.com/docs/bmus_e4_g5b.1.1.png
[876] https://bmus.latticegroup.com/docs/bmus_4e_5b.1.2.pdf
[877] https://bmus.latticegroup.com/docs/bmus_4e_5b.1.2.csv
[878] https://bmus.latticegroup.com/docs/bmus_4e_5b.1.3.pdf
[879] https://bmus.latticegroup.com/docs/bmus_4e_5b.1.3.csv
[880] https://bmus.latticegroup.com/file/bmuse4g5b121png
[881] https://bmus.latticegroup.com/docs/bmus_e4_g5b.1.2.1.png
[882] https://bmus.latticegroup.com/file/bmuse4g5b122png
[883] https://bmus.latticegroup.com/docs/bmus_e4_g5b.1.2.2.png
[884] https://bmus.latticegroup.com/docs/bmus_4e_5b.1.4.pdf
[885] https://bmus.latticegroup.com/docs/bmus_4e_5b.1.4.csv
[886] https://bmus.latticegroup.com/file/bmuse4g5b131png
[887] https://bmus.latticegroup.com/docs/bmus_e4_g5b.1.3.1.png
[888] https://bmus.latticegroup.com/file/bmuse4g5b132png
[889] https://bmus.latticegroup.com/docs/bmus_e4_g5b.1.3.2.png
[890] https://webappa.cdc.gov/sasweb/ncipc/nfirates.html
[891] https://bmus.latticegroup.com/docs/bmus_4e_5b.1.5.pdf
[892] https://bmus.latticegroup.com/docs/bmus_4e_5b.1.5.csv
[893] https://bmus.latticegroup.com/docs/bmus_4e_5b.1.6.pdf
[894] https://bmus.latticegroup.com/docs/bmus_4e_5b.1.6.csv
[895] https://bmus.latticegroup.com/file/bmuse4g5b141png
[896] https://bmus.latticegroup.com/docs/bmus_e4_g5b.1.4.1.png
[897] https://bmus.latticegroup.com/file/bmuse4g5b142png
[898] https://bmus.latticegroup.com/docs/bmus_e4_g5b.1.4.2.png
[899] https://bmus.latticegroup.com/file/bmuse4g5b211png
[900] https://bmus.latticegroup.com/docs/bmus_e4_g5b.2.1.1.png
[901] https://bmus.latticegroup.com/docs/bmus_4e_5b.2.2.pdf
[902] https://bmus.latticegroup.com/docs/bmus_4e_5b.2.2.csv
[903] https://bmus.latticegroup.com/docs/bmus_4e_5b.2.3.pdf
[904] https://bmus.latticegroup.com/docs/bmus_4e_5b.2.3.csv
[905] https://bmus.latticegroup.com/docs/bmus_4e_5b.2.4.pdf
[906] https://bmus.latticegroup.com/docs/bmus_4e_5b.2.4.csv
[907] https://bmus.latticegroup.com/docs/bmus_4e_5b.2.5.pdf
[908] https://bmus.latticegroup.com/docs/bmus_4e_5b.2.5.csv
[909] https://bmus.latticegroup.com/file/bmuse4g5b212png
[910] https://bmus.latticegroup.com/docs/bmus_e4_g5b.2.1.2.png
[911] https://bmus.latticegroup.com/docs/bmus_4e_5b.3.pdf
[912] https://bmus.latticegroup.com/docs/bmus_4e_5b.3.csv
[913] https://bmus.latticegroup.com/file/bmuse4g5b213png
[914] https://bmus.latticegroup.com/docs/bmus_e4_g5b.2.1.3.png
[915] https://bmus.latticegroup.com/docs/bmus_4e_5b.5.1.pdf
[916] https://bmus.latticegroup.com/docs/bmus_4e_5b.5.1.csv
[917] https://bmus.latticegroup.com/file/bmuse4g5b511png
[918] https://bmus.latticegroup.com/docs/bmus_e4_g5b.5.1.1.png
[919] https://bmus.latticegroup.com/docs/bmus_4e_5b.5.2.pdf
[920] https://bmus.latticegroup.com/docs/bmus_4e_5b.5.2.csv
[921] https://bmus.latticegroup.com/file/bmuse4g5b512png
[922] https://bmus.latticegroup.com/docs/bmus_e4_g5b.5.1.2.png
[923] https://bmus.latticegroup.com/docs/bmus_4e_5b.5.3.pdf
[924] https://bmus.latticegroup.com/docs/bmus_4e_5b.5.3.csv
[925] https://bmus.latticegroup.com/docs/bmus_4e_5b.5.4.pdf
[926] https://bmus.latticegroup.com/docs/bmus_4e_5b.5.4.csv
[927] https://bmus.latticegroup.com/file/bmuse4g5b513png
[928] https://bmus.latticegroup.com/docs/bmus_e4_g5b.5.1.3.png
[929] https://bmus.latticegroup.com/docs/bmus_4e_5b.6.1.pdf
[930] https://bmus.latticegroup.com/docs/bmus_4e_5b.6.1.csv
[931] https://bmus.latticegroup.com/file/bmuse4g5b521png
[932] https://bmus.latticegroup.com/docs/bmus_e4_g5b.5.2.1.png
[933] https://bmus.latticegroup.com/docs/bmus_4e_5b.6.2.pdf
[934] https://bmus.latticegroup.com/docs/bmus_4e_5b.6.2.csv
[935] https://bmus.latticegroup.com/file/bmuse4g5b522png
[936] https://bmus.latticegroup.com/docs/bmus_e4_g5b.5.2.2.png
[937] https://bmus.latticegroup.com/docs/bmus_4e_5b.7.1.pdf
[938] https://bmus.latticegroup.com/docs/bmus_4e_5b.7.1.csv
[939] https://bmus.latticegroup.com/file/bmuse4g5b531png
[940] https://bmus.latticegroup.com/docs/bmus_e4_g5b.5.3.1.png
[941] https://bmus.latticegroup.com/file/bmuse4g5b532png
[942] https://bmus.latticegroup.com/docs/bmus_e4_g5b.5.3.2.png
[943] https://bmus.latticegroup.com/docs/bmus_4e_5b.7.3.pdf
[944] https://bmus.latticegroup.com/docs/bmus_4e_5b.7.3.csv
[945] https://bmus.latticegroup.com/file/bmuse4g5b533png
[946] https://bmus.latticegroup.com/docs/bmus_e4_g5b.5.3.3.png
[947] https://bmus.latticegroup.com/docs/bmus_4e_5b.7.2.pdf
[948] https://bmus.latticegroup.com/docs/bmus_4e_5b.7.2.csv
[949] https://www.jems.com/articles/print/volume-37/issue-4/patient-care/penetrating-trauma-wounds-challenge-ems.html
[950] https://bmus.latticegroup.com/file/bmuse4g5b31png
[951] https://bmus.latticegroup.com/docs/bmus_e4_g5b.3.1.png
[952] https://bmus.latticegroup.com/file/bmuse4g5b32png
[953] https://bmus.latticegroup.com/docs/bmus_e4_g5b.3.2.png
[954] https://bmus.latticegroup.com/docs/bmus_4e_5b.4.1.2.pdf
[955] https://bmus.latticegroup.com/docs/bmus_4e_5b.4.1.2.csv
[956] https://bmus.latticegroup.com/file/bmuse4g5b33png
[957] https://bmus.latticegroup.com/docs/bmus_e4_g5b.3.3.png
[958] https://bmus.latticegroup.com/file/bmuse4g5b34png
[959] https://bmus.latticegroup.com/docs/bmus_e4_g5b.3.4.png
[960] https://bmus.latticegroup.com/docs/bmus_4e_5b.4.1.1.pdf
[961] https://bmus.latticegroup.com/docs/bmus_4e_5b.4.1.1.csv
[962] https://bmus.latticegroup.com/docs/bmus_4e_5b.4.1.3.pdf
[963] https://bmus.latticegroup.com/docs/bmus_4e_5b.4.1.3.csv
[964] https://bmus.latticegroup.com/docs/bmus_4e_5b.4.1.4.pdf
[965] https://bmus.latticegroup.com/docs/bmus_4e_5b.4.1.4.csv
[966] https://bmus.latticegroup.com/file/bmuse4g5b35png
[967] https://bmus.latticegroup.com/docs/bmus_e4_g5b.3.5.png
[968] https://bmus.latticegroup.com/file/bmuse4g5b36png
[969] https://bmus.latticegroup.com/docs/bmus_e4_g5b.3.6.png
[970] https://bmus.latticegroup.com/docs/bmus_4e_5b.4.2.pdf
[971] https://bmus.latticegroup.com/docs/bmus_4e_5b.4.2.csv
[972] https://bmus.latticegroup.com/docs/bmus_4e_5b.4.3.pdf
[973] https://bmus.latticegroup.com/docs/bmus_4e_5b.4.3.csv
[974] https://bmus.latticegroup.com/file/bmuse4g5b41png
[975] https://bmus.latticegroup.com/docs/bmus_e4_g5b.4.1.png
[976] https://bmus.latticegroup.com/file/bmuse4g5b42png
[977] https://bmus.latticegroup.com/docs/bmus_e4_g5b.4.2.png
[978] https://bmus.latticegroup.com/file/bmuse4g5b43png
[979] https://bmus.latticegroup.com/docs/bmus_e4_g5b.4.3.png
[980] https://bmus.latticegroup.com/file/bmuse4g5b44png
[981] https://bmus.latticegroup.com/docs/bmus_e4_g5b.4.4.png
[982] https://bmus.latticegroup.com/docs/bmus_4e_5c.1.pdf
[983] https://bmus.latticegroup.com/docs/bmus_4e_5c.1.csv
[984] https://bmus.latticegroup.com/file/bmuse4g5c11png
[985] https://bmus.latticegroup.com/docs/bmus_e4_g5c.1.1.png
[986] https://bmus.latticegroup.com/docs/bmus_4e_5c.2.pdf
[987] https://bmus.latticegroup.com/docs/bmus_4e_5c.2.csv
[988] https://bmus.latticegroup.com/file/bmuse4g5c12png
[989] https://bmus.latticegroup.com/docs/bmus_e4_g5c.1.2.png
[990] https://bmus.latticegroup.com/docs/bmus_4e_5c.3.pdf
[991] https://bmus.latticegroup.com/docs/bmus_4e_5c.3.csv
[992] https://bmus.latticegroup.com/file/bmuse4g5c13png
[993] https://bmus.latticegroup.com/docs/bmus_e4_g5c.1.3.png
[994] https://webappa.cdc.gov/cgi-bin/broker.exe
[995] https://www.cdc.gov/mmwr/preview/mmwrhtml/mm6438a5.htm?s_cid=mm6438a5_w
[996] https://www.bls.gov/data/#injuries
[997] https://bmus.latticegroup.com/docs/bmus_4e_5d.1.pdf
[998] https://bmus.latticegroup.com/docs/bmus_4e_5d.1.csv
[999] https://bmus.latticegroup.com/file/bmuse4g5d11png
[1000] https://bmus.latticegroup.com/docs/bmus_e4_g5d.1.1.png
[1001] https://bmus.latticegroup.com/docs/bmus_4e_5d.2.1.pdf
[1002] https://bmus.latticegroup.com/docs/bmus_4e_5d.2.1.csv
[1003] https://bmus.latticegroup.com/docs/bmus_4e_5d.2.2.pdf
[1004] https://bmus.latticegroup.com/docs/bmus_4e_5d.2.2.csv
[1005] https://bmus.latticegroup.com/file/bmuse4g5d12png
[1006] https://bmus.latticegroup.com/docs/bmus_e4_g5d.1.2.png
[1007] https://bmus.latticegroup.com/docs/bmus_4e_5d.3.1.pdf
[1008] https://bmus.latticegroup.com/docs/bmus_4e_5d.3.1.csv
[1009] https://bmus.latticegroup.com/docs/bmus_4e_5d.3.2.pdf
[1010] https://bmus.latticegroup.com/docs/bmus_4e_5d.3.2.csv
[1011] https://bmus.latticegroup.com/docs/bmus_4e_5d.4.pdf
[1012] https://bmus.latticegroup.com/docs/bmus_4e_5d.4.csv
[1013] https://bmus.latticegroup.com/file/bmuse4g5d13png
[1014] https://bmus.latticegroup.com/docs/bmus_e4_g5d.1.3.png
[1015] https://bmus.latticegroup.com/docs/bmus_4e_5d.5.pdf
[1016] https://bmus.latticegroup.com/docs/bmus_4e_5d.5.csv
[1017] https://bmus.latticegroup.com/docs/bmus_4e_5d.6.pdf
[1018] https://bmus.latticegroup.com/docs/bmus_4e_5d.6.csv
[1019] https://bmus.latticegroup.com/file/bmuse4g5d14png
[1020] https://bmus.latticegroup.com/docs/bmus_e4_g5d.1.4.png
[1021] https://www.bls.gov/news.release/archives/osh_11092017.pdf
[1022] https://www.cpsc.gov/Research--Statistics/NEISS-Injury-Data
[1023] https://bmus.latticegroup.com/docs/bmus_4e_5e.1.1.pdf
[1024] https://bmus.latticegroup.com/docs/bmus_4e_5e.1.1.csv
[1025] https://bmus.latticegroup.com/file/bmus4eg5e11png
[1026] https://bmus.latticegroup.com/docs/bmus_4e_g5e.1.1.png
[1027] https://bmus.latticegroup.com/file/bmus4eg5e12png
[1028] https://bmus.latticegroup.com/docs/bmus_4e_g5e.1.2.png
[1029] https://bmus.latticegroup.com/docs/bmus_4e_5e.1.2.1.pdf
[1030] https://bmus.latticegroup.com/docs/bmus_4e_5e.1.2.1.csv
[1031] https://bmus.latticegroup.com/file/bmus4eg5e13png
[1032] https://bmus.latticegroup.com/docs/bmus_4e_g5e.1.3.png
[1033] https://bmus.latticegroup.com/docs/bmus_4e_5e.1.3.pdf
[1034] https://bmus.latticegroup.com/docs/bmus_4e_5e.1.3.csv
[1035] https://bmus.latticegroup.com/file/bmus4eg5e14png
[1036] https://bmus.latticegroup.com/docs/bmus_4e_g5e.1.4.png
[1037] https://bmus.latticegroup.com/docs/bmus_4e_5e.1.7.pdf
[1038] https://bmus.latticegroup.com/docs/bmus_4e_5e.1.7.csv
[1039] https://bmus.latticegroup.com/file/bmus4eg5e15png
[1040] https://bmus.latticegroup.com/docs/bmus_4e_g5e.1.5.png
[1041] https://bmus.latticegroup.com/docs/bmus_4e_5e.1.5.pdf
[1042] https://bmus.latticegroup.com/docs/bmus_4e_5e.1.5.csv
[1043] https://bmus.latticegroup.com/file/bmus4eg5e16png
[1044] https://bmus.latticegroup.com/docs/bmus_4e_g5e.1.6.png
[1045] https://bmus.latticegroup.com/docs/bmus_4e_5e.1.6.pdf
[1046] https://bmus.latticegroup.com/docs/bmus_4e_5e.1.6.csv
[1047] https://bmus.latticegroup.com/file/bmus4eg5e17png
[1048] https://bmus.latticegroup.com/docs/bmus_4e_g5e.1.7.png
[1049] http://www.ucdenver.edu/academics/colleges/PublicHealth/research/ResearchProjects/piper/Pages/default.aspx
[1050] https://bmus.latticegroup.com/file/bmus4eg5e21png
[1051] https://bmus.latticegroup.com/docs/bmus_4e_g5e.2.1.png
[1052] https://bmus.latticegroup.com/file/bmus4eg5e22png
[1053] https://bmus.latticegroup.com/docs/bmus_4e_g5e.2.2.png
[1054] https://bmus.latticegroup.com/file/bmus4eg5e23apng
[1055] https://bmus.latticegroup.com/docs/bmus_4e_g5e.2.3a.png
[1056] https://bmus.latticegroup.com/file/bmus4eg5e23bpng
[1057] https://bmus.latticegroup.com/docs/bmus_4e_g5e.2.3b.png
[1058] https://bmus.latticegroup.com/file/bmus4eg5e23c1png
[1059] https://bmus.latticegroup.com/docs/bmus_4e_g5e.2.3c1.png
[1060] https://bmus.latticegroup.com/file/bmus4eg5e23c2png
[1061] https://bmus.latticegroup.com/docs/bmus_4e_g5e.2.3c2.png
[1062] https://bmus.latticegroup.com/file/bmus4eg5e23dpng
[1063] https://bmus.latticegroup.com/docs/bmus_4e_g5e.2.3d.png
[1064] https://bmus.latticegroup.com/file/bmus4eg5e23e1png
[1065] https://bmus.latticegroup.com/docs/bmus_4e_g5e.2.3e1.png
[1066] https://bmus.latticegroup.com/file/bmus4eg5e23e2png
[1067] https://bmus.latticegroup.com/docs/bmus_4e_g5e.2.3e2.png
[1068] https://bmus.latticegroup.com/file/bmus4eg5e23fpng
[1069] https://bmus.latticegroup.com/docs/bmus_4e_g5e.2.3f.png
[1070] https://bmus.latticegroup.com/file/bmus4eg5e23gpng
[1071] https://bmus.latticegroup.com/docs/bmus_4e_g5e.2.3g.png
[1072] https://bmus.latticegroup.com/file/bmus4eg5e23hpng
[1073] https://bmus.latticegroup.com/docs/bmus_4e_g5e.2.3h.png
[1074] https://bmus.latticegroup.com/file/bmus4eg5e24png
[1075] https://bmus.latticegroup.com/docs/bmus_4e_g5e.2.4.png
[1076] https://www.nfhs.org/articles/high-school-sports-participation-increases-for-29th-consecutive-year/
[1077] http://www.ucdenver.edu
[1078] http://www.ucdenver.edu/academics/colleges/PublicHealth/research/ResearchProjects/piper/projects/RIO/Documents/2017-18.pdf
[1079] http://www.ncaa.org/
[1080] http://www.ncaa.org/sport-science-institute/ncaa-injury-surveillance-program
[1081] https://datalyscenter.org/index.php
[1082] https://www.nata.org/
[1083] https://www.ncbi.nlm.nih.gov/pmc/articles/PMC1941297/
[1084] https://www.cdc.gov/safechild/nap/index.html
[1085] https://www.atyourownrisk.org/
[1086] https://www.stopsportsinjuries.org/
[1087] https://www.nata.org/news-publications/pressroom/statements/position
[1088] https://bmus.latticegroup.com/docs/bmus_4e_5e.3.2.pdf
[1089] https://bmus.latticegroup.com/docs/bmus_4e_5e.3.2.csv
[1090] https://bmus.latticegroup.com/file/bmus4eg5e31png
[1091] https://bmus.latticegroup.com/docs/bmus_4e_g5e.3.1.png
[1092] https://bmus.latticegroup.com/docs/bmus_4e_5e.3.1.pdf
[1093] https://bmus.latticegroup.com/docs/bmus_4e_5e.3.1.csv
[1094] https://bmus.latticegroup.com/docs/bmus_4e_5e.3.7.pdf
[1095] https://bmus.latticegroup.com/docs/bmus_4e_5e.3.7.csv
[1096] https://bmus.latticegroup.com/file/bmus4eg5e32png
[1097] https://bmus.latticegroup.com/docs/bmus_4e_g5e.3.2.png
[1098] https://bmus.latticegroup.com/docs/bmus_4e_5e.3.4.pdf
[1099] https://bmus.latticegroup.com/docs/bmus_4e_5e.3.4.csv
[1100] https://bmus.latticegroup.com/file/bmus4eg5e33png
[1101] https://bmus.latticegroup.com/docs/bmus_4e_g5e.3.3.png
[1102] https://bmus.latticegroup.com/docs/bmus_4e_5e.3.5.pdf
[1103] https://bmus.latticegroup.com/docs/bmus_4e_5e.3.5.csv
[1104] https://bmus.latticegroup.com/file/bmus4eg5e34png
[1105] https://bmus.latticegroup.com/docs/bmus_4e_g5e.3.4.png
[1106] https://bmus.latticegroup.com/docs/bmus_4e_5e.3.6.pdf
[1107] https://bmus.latticegroup.com/docs/bmus_4e_5e.3.6.csv
[1108] https://bmus.latticegroup.com/file/bmus4eg5e35png
[1109] https://bmus.latticegroup.com/docs/bmus_4e_g5e.3.5.png
[1110] https://bmus.latticegroup.com/file/bmus4eg5e36png
[1111] https://bmus.latticegroup.com/docs/bmus_4e_g5e.3.6.png
[1112] https://bmus.latticegroup.com/file/bmus4eg5e37png
[1113] https://bmus.latticegroup.com/docs/bmus_4e_g5e.3.7.png
[1114] http://A: Estimated probability of competing in college athletics
[1115] https://www.cdc.gov/safechild/sports_injuries/index.html
[1116] https://bmus.latticegroup.com/docs/bmus_e4_5f.0.1.pdf
[1117] https://bmus.latticegroup.com/docs/bmus_e4_5f.0.1.csv
[1118] https://bmus.latticegroup.com/docs/bmus_e4_5f.0.2.pdf
[1119] https://bmus.latticegroup.com/docs/bmus_e4_5f.0.2.csv
[1120] https://bmus.latticegroup.com/file/bmuse4g5f01png
[1121] https://bmus.latticegroup.com/docs/bmus_e4_g5f.0.1.png
[1122] https://bmus.latticegroup.com/file/bmuse4g5f02png
[1123] https://bmus.latticegroup.com/docs/bmus_e4_g5f.0.2.png
[1124] https://bmus.latticegroup.com/file/bmuse4g5f03png
[1125] https://bmus.latticegroup.com/docs/bmus_e4_g5f.0.3.png
[1126] https://www.gov.uk/government/collections/medical-discharges-among-uk-service-personnel-statistics-index
[1127] https://www.researchgate.net/publication/11401381_Does_military_service_damage_females_An_analysis_of_medical_discharge_data_in_the_British_armed_forces
[1128] https://bmus.latticegroup.com/docs/bmus_e4_5f.1.1.1.pdf
[1129] https://bmus.latticegroup.com/docs/bmus_e4_5f.1.1.1.csv
[1130] https://bmus.latticegroup.com/file/bmuse4g5f11png
[1131] https://bmus.latticegroup.com/docs/bmus_e4_g5f.1.1.png
[1132] https://bmus.latticegroup.com/docs/bmus_e4_5f.1.1.2.pdf
[1133] https://bmus.latticegroup.com/docs/bmus_e4_5f.1.1.2.csv
[1134] https://bmus.latticegroup.com/file/bmuse4g5f12png
[1135] https://bmus.latticegroup.com/docs/bmus_e4_g5f.1.2.png
[1136] https://bmus.latticegroup.com/docs/bmus_e4_5f.1.1.3.pdf
[1137] https://bmus.latticegroup.com/docs/bmus_e4_5f.1.1.3.csv
[1138] https://bmus.latticegroup.com/file/bmuse4g5f13png
[1139] https://bmus.latticegroup.com/docs/bmus_e4_g5f.1.3.png
[1140] https://bmus.latticegroup.com/docs/bmus_e4_5f.1.2.1.pdf
[1141] https://bmus.latticegroup.com/docs/bmus_e4_5f.1.2.1.csv
[1142] https://bmus.latticegroup.com/file/bmuse4g5f21png
[1143] https://bmus.latticegroup.com/docs/bmus_e4_g5f.2.1.png
[1144] https://bmus.latticegroup.com/docs/bmus_e4_5f.1.2.2.pdf
[1145] https://bmus.latticegroup.com/docs/bmus_e4_5f.1.2.2.csv
[1146] https://bmus.latticegroup.com/docs/bmus_e4_5f.1.2.3.pdf
[1147] https://bmus.latticegroup.com/docs/bmus_e4_5f.1.2.3.csv
[1148] https://bmus.latticegroup.com/file/bmuse4g5f22png
[1149] https://bmus.latticegroup.com/docs/bmus_e4_g5f.2.2.png
[1150] https://bmus.latticegroup.com/docs/bmus_e4_5f.1.3.1.pdf
[1151] https://bmus.latticegroup.com/docs/bmus_e4_5f.1.3.1.csv
[1152] https://bmus.latticegroup.com/docs/bmus_e4_5f.1.3.3.pdf
[1153] https://bmus.latticegroup.com/docs/bmus_e4_5f.1.3.3.csv
[1154] https://bmus.latticegroup.com/file/bmuse4g5f31png
[1155] https://bmus.latticegroup.com/docs/bmus_e4_g5f.3.1.png
[1156] https://bmus.latticegroup.com/docs/bmus_e4_5f.1.3.2.pdf
[1157] https://bmus.latticegroup.com/docs/bmus_e4_5f.1.3.2.csv
[1158] https://bmus.latticegroup.com/docs/bmus_e4_5f.1.3.4.pdf
[1159] https://bmus.latticegroup.com/docs/bmus_e4_5f.1.3.4.csv
[1160] https://bmus.latticegroup.com/docs/bmus_e4_5f.1.4.1.pdf
[1161] https://bmus.latticegroup.com/docs/bmus_e4_5f.1.4.1.csv
[1162] https://bmus.latticegroup.com/docs/bmus_e4_5f.1.4.2.pdf
[1163] https://bmus.latticegroup.com/docs/bmus_e4_5f.1.4.2.csv
[1164] https://bmus.latticegroup.com/file/bmuse4g5f41png
[1165] https://bmus.latticegroup.com/docs/bmus_e4_g5f.4.1.png
[1166] https://bmus.latticegroup.com/docs/bmus_e4_5f.1.4.3.pdf
[1167] https://bmus.latticegroup.com/docs/bmus_e4_5f.1.4.3.csv
[1168] https://bmus.latticegroup.com/file/bmuse4g5f51png
[1169] https://bmus.latticegroup.com/docs/bmus_e4_g5f.5.1.png
[1170] http://www.dtic.mil/dtic/tr/fulltext/u2/1050457.pdf
[1171] https://www.hks.harvard.edu/publications/financial-legacy-iraq-and-afghanistan-how-wartime-spending-decisions-will-constrain
[1172] https://bmus.latticegroup.com/file/bmuse4g5g01png
[1173] https://bmus.latticegroup.com/docs/bmus_e4_g5g.0.1.png
[1174] https://bmus.latticegroup.com/file/bmuse4g5g02png
[1175] https://bmus.latticegroup.com/docs/bmus_e4_g5g.0.2.png
[1176] https://bmus.latticegroup.com/file/bmuse4g5g03png
[1177] https://bmus.latticegroup.com/docs/bmus_e4_g5g.0.3.png
[1178] https://bmus.latticegroup.com/file/bmuse4g5g04png
[1179] https://bmus.latticegroup.com/docs/bmus_e4_g5g.0.4.png
[1180] https://bmus.latticegroup.com/file/bmuse4g5g05png
[1181] https://bmus.latticegroup.com/docs/bmus_e4_g5g.0.5.png
[1182] https://bmus.latticegroup.com/docs/bmus_e4_T8.1.5.pdf
[1183] https://bmus.latticegroup.com/docs/bmus_e4_T8.1.5.csv
[1184] https://bmus.latticegroup.com/file/bmuse4g5h01png
[1185] https://bmus.latticegroup.com/docs/bmus_e4_g5h.0.1.png
[1186] https://bmus.latticegroup.com/docs/bmus_e4_T8.2.5.pdf
[1187] https://bmus.latticegroup.com/docs/bmus_e4_T8.2.5.csv
[1188] https://bmus.latticegroup.com/file/bmuse4g5h02png
[1189] https://bmus.latticegroup.com/docs/bmus_e4_g5h.0.2.png
[1190] https://bmus.latticegroup.com/docs/bmus_e4_T8.4.5.pdf
[1191] https://bmus.latticegroup.com/docs/bmus_e4_T8.4.5.csv
[1192] https://bmus.latticegroup.com/file/bmuse4g5h11png
[1193] https://bmus.latticegroup.com/docs/bmus_e4_g5h.1.1.png
[1194] https://bmus.latticegroup.com/docs/bmus_e4_T8.6.5.pdf
[1195] https://bmus.latticegroup.com/docs/bmus_e4_T8.6.5.csv
[1196] https://bmus.latticegroup.com/file/bmuse4g5h12png
[1197] https://bmus.latticegroup.com/docs/bmus_e4_g5h.1.2.png
[1198] https://bmus.latticegroup.com/file/bmuse4g5h13png
[1199] https://bmus.latticegroup.com/docs/bmus_e4_g5h.1.3.png
[1200] https://www.facs.org/quality-programs/cancer/ncdb
[1201] https://surveillance.cancer.gov/
[1202] https://www.boneandjointburden.org/fourth-edition/via15/secondary-bone-and-joint-cancers
[1203] https://www.ncbi.nlm.nih.gov/pubmed/30737668
[1204] https://epi.grants.cancer.gov/registries.html
[1205] https://surveillance.cancer.gov/survival/measures.html
[1206] https://www.facs.org/quality-programs/cancer/ncdb/about
[1207] https://bmus.latticegroup.com/docs/bmus_4e_T6A.A.1.0.pdf
[1208] https://bmus.latticegroup.com/docs/bmus_4e_T6A.A.1.0.csv
[1209] https://bmus.latticegroup.com/docs/bmus_4e_T6A.A.1.3.1.pdf
[1210] https://bmus.latticegroup.com/docs/bmus_4e_T6A.A.1.3.1.csv
[1211] https://bmus.latticegroup.com/docs/bmus_4e_T6A.A.1.4.1.pdf
[1212] https://bmus.latticegroup.com/docs/bmus_4e_T6A.A.1.4.1.csv
[1213] https://bmus.latticegroup.com/file/bmus4eg6a11png
[1214] https://bmus.latticegroup.com/docs/bmus_4e_g6a.1.1.png
[1215] https://bmus.latticegroup.com/docs/bmus_4e_T6A.B.1.1.pdf
[1216] https://bmus.latticegroup.com/docs/bmus_4e_T6A.B.1.1.csv
[1217] https://bmus.latticegroup.com/docs/bmus_4e_T6A.B.1.2.pdf
[1218] https://bmus.latticegroup.com/docs/bmus_4e_T6A.B.1.2.csv
[1219] https://bmus.latticegroup.com/docs/bmus_4e_T6A.B.1.3.pdf
[1220] https://bmus.latticegroup.com/docs/bmus_4e_T6A.B.1.3.csv
[1221] https://bmus.latticegroup.com/docs/bmus_4e_T6A.B.1.4.pdf
[1222] https://bmus.latticegroup.com/docs/bmus_4e_T6A.B.1.4.csv
[1223] https://bmus.latticegroup.com/file/bmus4eg6a12png
[1224] https://bmus.latticegroup.com/docs/bmus_4e_g6a.1.2.png
[1225] https://bmus.latticegroup.com/docs/bmus_4e_T6A.B.1.8.pdf
[1226] https://bmus.latticegroup.com/docs/bmus_4e_T6A.B.1.8.csv
[1227] https://bmus.latticegroup.com/file/bmus4eg6a13png
[1228] https://bmus.latticegroup.com/docs/bmus_4e_g6a.1.3.png
[1229] https://bmus.latticegroup.com/docs/bmus_4e_T6A.A.1.5.1.pdf
[1230] https://bmus.latticegroup.com/docs/bmus_4e_T6A.A.1.5.1.csv
[1231] https://bmus.latticegroup.com/file/bmus4eg6a14png
[1232] https://bmus.latticegroup.com/docs/bmus_4e_g6a.1.4.png
[1233] https://bmus.latticegroup.com/docs/bmus_4e_T6A.A.1.2.1.pdf
[1234] https://bmus.latticegroup.com/docs/bmus_4e_T6A.A.1.2.1.csv
[1235] https://bmus.latticegroup.com/docs/bmus_4e_T6A.A.1.2.2.pdf
[1236] https://bmus.latticegroup.com/docs/bmus_4e_T6A.A.1.2.2.csv
[1237] https://seer.cancer.gov/explorer
[1238] https://seer.cancer.gov/explorer
[1239] https://www.cancer.org/content/dam/cancer-org/research/cancer-facts-and-statistics/annual-cancer-facts-and-figures/2017/cancer-facts-and-figures-2017.pdf
[1240] https://seer.cancer.gov/statfacts/html/mulmy.html
[1241] https://bmus.latticegroup.com/docs/bmus_4e_T6A.A.1.1.1.pdf
[1242] https://bmus.latticegroup.com/docs/bmus_4e_T6A.A.1.1.1.csv
[1243] https://bmus.latticegroup.com/file/bmus4eg6a15png
[1244] https://bmus.latticegroup.com/docs/bmus_4e_g6a.1.5.png
[1245] https://bmus.latticegroup.com/file/bmus4eg6a16png
[1246] https://bmus.latticegroup.com/docs/bmus_4e_g6a.1.6.png
[1247] https://bmus.latticegroup.com/docs/bmus_4e_T6A.B.1.6.pdf
[1248] https://bmus.latticegroup.com/docs/bmus_4e_T6A.B.1.6.csv
[1249] https://bmus.latticegroup.com/docs/bmus_4e_T6A.B.1.7.pdf
[1250] https://bmus.latticegroup.com/docs/bmus_4e_T6A.B.1.7.csv
[1251] https://bmus.latticegroup.com/docs/bmus_4e_T6A.A.1.7.pdf
[1252] https://bmus.latticegroup.com/docs/bmus_4e_T6A.A.1.7.csv
[1253] https://bmus.latticegroup.com/docs/bmus_4e_T6A.A.1.8.pdf
[1254] https://bmus.latticegroup.com/docs/bmus_4e_T6A.A.1.8.csv
[1255] https://bmus.latticegroup.com/file/bmus4eg6a17png
[1256] https://bmus.latticegroup.com/docs/bmus_4e_g6a.1.7.png
[1257] https://bmus.latticegroup.com/docs/bmus_4e_T6A.A.1.1.2.pdf
[1258] https://bmus.latticegroup.com/docs/bmus_4e_T6A.A.1.1.2.csv
[1259] https://bmus.latticegroup.com/docs/bmus_4e_T6A.A.1.6.1.pdf
[1260] https://bmus.latticegroup.com/docs/bmus_4e_T6A.A.1.6.1.csv
[1261] https://bmus.latticegroup.com/docs/bmus_4e_T6A.A.1.6.2.pdf
[1262] https://bmus.latticegroup.com/docs/bmus_4e_T6A.A.1.6.2.csv
[1263] https://bmus.latticegroup.com/docs/bmus_4e_T6A.A.1.5.2.pdf
[1264] https://bmus.latticegroup.com/docs/bmus_4e_T6A.A.1.5.2.csv
[1265] https://bmus.latticegroup.com/file/bmus4eg6a18png
[1266] https://bmus.latticegroup.com/docs/bmus_4e_g6a.1.8.png
[1267] https://bmus.latticegroup.com/file/bmus4eg6a19png
[1268] https://bmus.latticegroup.com/docs/bmus_4e_g6a.1.9.png
[1269] https://seer.cancer.gov/statfacts/html/bones.html
[1270] https://surveillance.cancer.gov/statistics/types/survival.html
[1271] https://www.cancer.net/cancer-types/osteosarcoma-childhood/statistics
[1272] https://www.cancer.net/cancer-types/ewing-sarcoma-childhood-and-adolescence/statistics
[1273] https://bmus.latticegroup.com/docs/bmus_4e_T6A.B.1.9.pdf
[1274] https://bmus.latticegroup.com/docs/bmus_4e_T6A.B.1.9.csv
[1275] https://bmus.latticegroup.com/docs/bmus_4e_T6A.B.2.6.pdf
[1276] https://bmus.latticegroup.com/docs/bmus_4e_T6A.B.2.6.csv
[1277] https://bmus.latticegroup.com/file/bmus4eg6a110png
[1278] https://bmus.latticegroup.com/docs/bmus_4e_g6a.1.10.png
[1279] https://bmus.latticegroup.com/docs/bmus_4e_T6A.B.1.11.pdf
[1280] https://bmus.latticegroup.com/docs/bmus_4e_T6A.B.1.11.csv
[1281] https://bmus.latticegroup.com/file/bmus4eg6a111png
[1282] https://bmus.latticegroup.com/docs/bmus_4e_g6a.1.11.png
[1283] https://www.mdedge.com/hematology-oncology/article/47005/genitourinary-cancer/impact-bone-metastases-and-skeletal-related
[1284] https://www.cancer.gov/types/soft-tissue-sarcoma
[1285] https://www.cancer.org/cancer/rhabdomyosarcoma/about/what-is-rhabdomyosarcoma.html
[1286] https://www.cancer.gov/publications/dictionaries/cancer-terms?expand=D
[1287] https://www.cancer.org/cancer/soft-tissue-sarcoma/about/key-statistics.html
[1288] https://bmus.latticegroup.com/docs/bmus_4e_T6A.A.1.3.2.pdf
[1289] https://bmus.latticegroup.com/docs/bmus_4e_T6A.A.1.3.2.csv
[1290] https://bmus.latticegroup.com/file/bmus4eg6a21png
[1291] https://bmus.latticegroup.com/docs/bmus_4e_g6a.2.1.png
[1292] https://bmus.latticegroup.com/docs/bmus_4e_T6A.A.1.1.3.pdf
[1293] https://bmus.latticegroup.com/docs/bmus_4e_T6A.A.1.1.3.csv
[1294] https://bmus.latticegroup.com/docs/bmus_4e_T6A.A.1.1.4.pdf
[1295] https://bmus.latticegroup.com/docs/bmus_4e_T6A.A.1.1.4.csv
[1296] https://bmus.latticegroup.com/file/bmus4eg6a22png
[1297] https://bmus.latticegroup.com/docs/bmus_4e_g6a.2.2.png
[1298] https://bmus.latticegroup.com/file/bmus4eg6a23png
[1299] https://bmus.latticegroup.com/docs/bmus_4e_g6a.2.3.png
[1300] https://www.cancer.org/cancer/soft-tissue-sarcoma/detection-diagnosis-staging/survival-rates.html
[1301] https://bmus.latticegroup.com/docs/bmus_4e_T6A.B.2.8.pdf
[1302] https://bmus.latticegroup.com/docs/bmus_4e_T6A.B.2.8.csv
[1303] https://bmus.latticegroup.com/file/bmus4eg6a24png
[1304] https://bmus.latticegroup.com/docs/bmus_4e_g6a.2.4.png
[1305] https://bmus.latticegroup.com/docs/bmus_4e_T6A.B.1.5.pdf
[1306] https://bmus.latticegroup.com/docs/bmus_4e_T6A.B.1.5.csv
[1307] https://bmus.latticegroup.com/file/bmus4eg6a31png
[1308] https://bmus.latticegroup.com/docs/bmus_4e_g6a.3.1.png
[1309] https://bmus.latticegroup.com/file/bmus4eg6a32png
[1310] https://bmus.latticegroup.com/docs/bmus_4e_g6a.3.2.png
[1311] https://bmus.latticegroup.com/docs/bmus_4e_T6A.A.2.2.pdf
[1312] https://bmus.latticegroup.com/docs/bmus_4e_T6A.A.2.2.csv
[1313] https://bmus.latticegroup.com/docs/bmus_4e_T6A.A.2.1.pdf
[1314] https://bmus.latticegroup.com/docs/bmus_4e_T6A.A.2.1.csv
[1315] https://bmus.latticegroup.com/docs/bmus_4e_T6A.B.2.3.pdf
[1316] https://bmus.latticegroup.com/docs/bmus_4e_T6A.B.2.3.csv
[1317] https://bmus.latticegroup.com/file/bmus4eg6a33png
[1318] https://bmus.latticegroup.com/docs/bmus_4e_g6a.3.3.png
[1319] https://bmus.latticegroup.com/docs/bmus_4e_T6A.A.1.4.2.pdf
[1320] https://bmus.latticegroup.com/docs/bmus_4e_T6A.A.1.4.2.csv
[1321] https://seer.cancer.gov/statfacts/html/hodg.html
[1322] https://www.cancer.gov/types/soft-tissue-sarcoma/hp/rhabdomyosarcoma-treatment-pdq
[1323] https://www.cancer.org/cancer/bone-cancer/treating/surgery.html
[1324] https://bmus.latticegroup.com/docs/bmus_4e_T6A.C.1.pdf
[1325] https://bmus.latticegroup.com/docs/bmus_4e_T6A.C.1.csv
[1326] https://seer.cancer.gov/csr/1975_2014/
[1327] https://cromwell.facs.orglBmarks/BMCmplver
[1328] https://doi.org/10.2337/diaclin.23.1.9
[1329] https://bmus.latticegroup.com/docs/bmus_e4_T6B.1.1.pdf
[1330] https://bmus.latticegroup.com/docs/bmus_e4_T6B.1.1.csv
[1331] https://bmus.latticegroup.com/docs/bmus_e4_T6B.1.2.pdf
[1332] https://bmus.latticegroup.com/docs/bmus_e4_T6B.1.2.csv
[1333] https://bmus.latticegroup.com/docs/bmus_e4_T6B.1.3.pdf
[1334] https://bmus.latticegroup.com/docs/bmus_e4_T6B.1.3.csv
[1335] https://bmus.latticegroup.com/docs/bmus_e4_T6B.1.4.pdf
[1336] https://bmus.latticegroup.com/docs/bmus_e4_T6B.1.4.csv
[1337] https://bmus.latticegroup.com/file/bmuse4g6bb11png
[1338] https://bmus.latticegroup.com/docs/bmus_e4_G6B.B.1.1_0.png
[1339] https://bmus.latticegroup.com/docs/bmus_e4_T6B.1.5.pdf
[1340] https://bmus.latticegroup.com/docs/bmus_e4_T6B.1.5.csv
[1341] https://bmus.latticegroup.com/file/bmuse4g6bb12png
[1342] https://bmus.latticegroup.com/docs/bmus_e4_G6B.B.1.2_0.png
[1343] https://bmus.latticegroup.com/docs/bmus_e4_T6B.2.1.pdf
[1344] https://bmus.latticegroup.com/docs/bmus_e4_T6B.2.1.csv
[1345] https://bmus.latticegroup.com/docs/bmus_e4_T6B.2.2.pdf
[1346] https://bmus.latticegroup.com/docs/bmus_e4_T6B.2.2.csv
[1347] https://bmus.latticegroup.com/file/bmuse4g6bc11png
[1348] https://bmus.latticegroup.com/docs/bmus_e4_G6B.C.1.1_0.png
[1349] https://bmus.latticegroup.com/file/bmuse4g6bc12png
[1350] https://bmus.latticegroup.com/docs/bmus_e4_G6B.C.1.2_0.png
[1351] https://bmus.latticegroup.com/file/bmuse4g6bd11png
[1352] https://bmus.latticegroup.com/docs/bmus_e4_G6B.D.1.1_0.png
[1353] https://www.ncbi.nlm.nih.gov/pmc/articles/PMC2764727/
[1354] https://www.ninds.nih.gov/Disorders/Patient-Caregiver-Education/Fact-Sheets/Post-Polio-Syndrome-Fact-Sheet
[1355] https://bmus.latticegroup.com/file/bmuse4g6be11png
[1356] https://bmus.latticegroup.com/docs/bmus_e4_G6B.E.1.1_0.png
[1357] https://bmus.latticegroup.com/file/bmuse4g6be12png
[1358] https://bmus.latticegroup.com/docs/bmus_e4_G6B.E.1.2_0.png
[1359] http://www.ncbi.nlm.nih.gov/pmc/articles/PMC3232636/
[1360] https://www.ncbi.nlm.nih.gov/pmc/articles/PMC3232636/
[1361] https://bmus.latticegroup.com/file/bmuse4g6bf11png
[1362] https://bmus.latticegroup.com/docs/bmus_e4_G6B.F.1.1_0.png
[1363] https://bmus.latticegroup.com/file/bmuse4g6bf12png
[1364] https://bmus.latticegroup.com/docs/bmus_e4_G6B.F.1.2_0.png
[1365] https://www.nscisc.uab.edu/Public/Facts%202016.pdf
[1366] https://bmus.latticegroup.com/file/bmuse4g6bg01png
[1367] https://bmus.latticegroup.com/docs/bmus_e4_G6B.G.0.1_0.png
[1368] https://bmus.latticegroup.com/file/bmuse4g6bg02png
[1369] https://bmus.latticegroup.com/docs/bmus_e4_G6B.G.0.2_0.png
[1370] https://bmus.latticegroup.com/file/bmuse4g6bh01png
[1371] https://bmus.latticegroup.com/docs/bmus_e4_G6B.H.0.1_0.png
[1372] https://bmus.latticegroup.com/docs/bmus_e4_ICD%209%20neureomuscular%20codes.pdf
[1373] https://bmus.latticegroup.com/docs/ICD9%20%26%20ICD10%20neuromuscular%20codes.pdf
[1374] https://www.census.gov/newsroom/press-releases/2018/cb18-41-population-projections.html
[1375] https://www.rand.org/pubs/tools/TL221.html
[1376] https://www.cdc.gov/chronicdisease/about/costs/index.htm#ref1
[1377] https://bmus.latticegroup.com/docs/bmus_4e_t7b.1.pdf
[1378] https://bmus.latticegroup.com/docs/bmus_4e_t7b.1.csv
[1379] https://bmus.latticegroup.com/file/bmus4eg7b11png
[1380] https://bmus.latticegroup.com/docs/bmus_4e_g7b.1.1.png
[1381] https://bmus.latticegroup.com/file/bmus4eg7b12png
[1382] https://bmus.latticegroup.com/docs/bmus_4e_g7b.1.2.png
[1383] https://bmus.latticegroup.com/file/bmus4eg7b13png
[1384] https://bmus.latticegroup.com/docs/bmus_4e_g7b.1.3.png
[1385] https://bmus.latticegroup.com/file/bmus4eg7b14png
[1386] https://bmus.latticegroup.com/docs/bmus_4e_g7b.1.4.png
[1387] https://bmus.latticegroup.com/file/bmus4eg7b15png
[1388] https://bmus.latticegroup.com/docs/bmus_4e_g7b.1.5.png
[1389] https://bmus.latticegroup.com/docs/bmus_4e_t7b.2.pdf
[1390] https://bmus.latticegroup.com/docs/bmus_4e_t7b.2.csv
[1391] https://bmus.latticegroup.com/file/bmus4eg7b21png
[1392] https://bmus.latticegroup.com/docs/bmus_4e_g7b.2.1.png
[1393] https://bmus.latticegroup.com/file/bmus4eg7b22png
[1394] https://bmus.latticegroup.com/docs/bmus_4e_g7b.2.2.png
[1395] https://bmus.latticegroup.com/file/bmus4eg7b23png
[1396] https://bmus.latticegroup.com/docs/bmus_4e_g7b.2.3.png
[1397] https://bmus.latticegroup.com/file/bmus4eg7b24png
[1398] https://bmus.latticegroup.com/docs/bmus_4e_g7b.2.4.png
[1399] https://bmus.latticegroup.com/file/bmus4eg7b25png
[1400] https://bmus.latticegroup.com/docs/bmus_4e_g7b.2.5.png
[1401] https://bmus.latticegroup.com/docs/bmus_4e_t7b.3.pdf
[1402] https://bmus.latticegroup.com/docs/bmus_4e_t7b.3.csv
[1403] https://bmus.latticegroup.com/file/bmus4eg7b31png
[1404] https://bmus.latticegroup.com/docs/bmus_4e_g7b.3.1.png
[1405] https://bmus.latticegroup.com/docs/bmus_4e_t7b.4.1.pdf
[1406] https://bmus.latticegroup.com/docs/bmus_4e_t7b.4.1.csv
[1407] https://bmus.latticegroup.com/file/bmus4eg7b41png
[1408] https://bmus.latticegroup.com/docs/bmus_4e_g7b.4.1.png
[1409] https://bmus.latticegroup.com/file/bmus4eg7b42png
[1410] https://bmus.latticegroup.com/docs/bmus_4e_g7b.4.2.png
[1411] https://bmus.latticegroup.com/file/bmus4eg7b43png
[1412] https://bmus.latticegroup.com/docs/bmus_4e_g7b.4.3.png
[1413] https://bmus.latticegroup.com/file/bmus4eg7b44png
[1414] https://bmus.latticegroup.com/docs/bmus_4e_g7b.4.4.png
[1415] https://bmus.latticegroup.com/docs/bmus_4e_t7b.4.2.pdf
[1416] https://bmus.latticegroup.com/docs/bmus_4e_t7b.4.2.csv
[1417] https://bmus.latticegroup.com/file/bmus4eg7b45png
[1418] https://bmus.latticegroup.com/docs/bmus_4e_g7b.4.5.png
[1419] https://bmus.latticegroup.com/docs/bmus_4e_t7b.4.3.pdf
[1420] https://bmus.latticegroup.com/docs/bmus_4e_t7b.4.3.csv
[1421] https://bmus.latticegroup.com/docs/bmus_4e_t7b.4.4.pdf
[1422] https://bmus.latticegroup.com/docs/bmus_4e_t7b.4.4.csv
[1423] https://bmus.latticegroup.com/file/bmus4eg7b46png
[1424] https://bmus.latticegroup.com/docs/bmus_4e_g7b.4.6.png
[1425] https://bmus.latticegroup.com/docs/bmus_4e_t7b.5.1.pdf
[1426] https://bmus.latticegroup.com/docs/bmus_4e_t7b.5.1.csv
[1427] https://bmus.latticegroup.com/file/bmus4eg7b51png
[1428] https://bmus.latticegroup.com/docs/bmus_4e_g7b.5.1.png
[1429] https://bmus.latticegroup.com/file/bmus4eg7b52png
[1430] https://bmus.latticegroup.com/docs/bmus_4e_g7b.5.2.png
[1431] https://bmus.latticegroup.com/file/bmus4eg7b53png
[1432] https://bmus.latticegroup.com/docs/bmus_4e_g7b.5.3.png
[1433] http://www.who.int/chp/topics/Osteoporosis.pdf
[1434] http://www.agingsociety.org/agingsociety/publications/chronic/index.html
[1435] http://www.cdc.gov/HomeandRecreationalSafety/Falls/adulthipfx.html
[1436] https://bmus.latticegroup.com/docs/bmus_4e_t7b.6.pdf
[1437] https://bmus.latticegroup.com/docs/bmus_4e_t7b.6.csv
[1438] https://bmus.latticegroup.com/file/bmus4eg7b6png
[1439] https://bmus.latticegroup.com/docs/bmus_4e_g7b.6.png
[1440] https://bmus.latticegroup.com/docs/bmus_4e_t7b.7.pdf
[1441] https://bmus.latticegroup.com/docs/bmus_4e_t7b.7.csv
[1442] https://bmus.latticegroup.com/file/bmus4eg7b7png
[1443] https://bmus.latticegroup.com/docs/bmus_4e_g7b.7.png
[1444] https://www.ownthebone.org/
[1445] https://www.ncoa.org/news/resources-for-reporters/get-the-facts/falls-prevention-facts/
[1446] https://www.cdc.gov/nchs/nhis/index.htm?CDC_AA_refVal=https%3A%2F%2Fwww.cdc.gov%2Fnchs%2Fnhis.htm
[1447] https://bmus.latticegroup.com/docs/bmus_4e_t7c.0.pdf
[1448] https://bmus.latticegroup.com/docs/bmus_4e_t7c.0.csv
[1449] https://bmus.latticegroup.com/docs/bmus_4e_t7c.0.1.pdf
[1450] https://bmus.latticegroup.com/docs/bmus_4e_t7c.0.1.csv
[1451] https://bmus.latticegroup.com/file/bmus4eg7c01png
[1452] https://bmus.latticegroup.com/docs/bmus_4e_g7c.0.1.png
[1453] https://bmus.latticegroup.com/docs/bmus_4e_t7c.0.2.pdf
[1454] https://bmus.latticegroup.com/docs/bmus_4e_t7c.0.2.csv
[1455] https://bmus.latticegroup.com/file/bmus4eg7c02png
[1456] https://bmus.latticegroup.com/docs/bmus_4e_g7c.0.2.png
[1457] https://www.boneandjointburden.org/fourth-edition/viic17/children-and-adolescent-icd-9-cm-codes
[1458] https://www.hcup-us.ahrq.gov/
[1459] https://bmus.latticegroup.com/file/bmus4et7c10jpg
[1460] https://bmus.latticegroup.com/docs/bmus_4e_t7c.1.0.jpg
[1461] https://www.cpsc.gov/cgibin/NEISSQuery/home.aspx
[1462] http://report.nih.gov/fundingfacts/fundingfacts.aspx
[1463] https://bmus.latticegroup.com/docs/bmus_4e_t7c.1.1.pdf
[1464] https://bmus.latticegroup.com/docs/bmus_4e_t7c.1.1.csv
[1465] https://bmus.latticegroup.com/file/bmus4eg7c11png
[1466] https://bmus.latticegroup.com/docs/bmus_4e_g7c.1.1.png
[1467] https://bmus.latticegroup.com/file/bmus4eg7c12png
[1468] https://bmus.latticegroup.com/docs/bmus_4e_g7c.1.2.png
[1469] https://bmus.latticegroup.com/docs/bmus_4e_t7c.1.2.pdf
[1470] https://bmus.latticegroup.com/docs/bmus_4e_t7c.1.2.csv
[1471] https://bmus.latticegroup.com/file/bmus4eg7c13png
[1472] https://bmus.latticegroup.com/docs/bmus_4e_g7c.1.3.png
[1473] https://bmus.latticegroup.com/file/bmus4eg7c14png
[1474] https://bmus.latticegroup.com/docs/bmus_4e_g7c.1.4.png
[1475] https://bmus.latticegroup.com/docs/bmus_4e_t7c.2.pdf
[1476] https://bmus.latticegroup.com/docs/bmus_4e_t7c.2.csv
[1477] https://bmus.latticegroup.com/file/bmus4eg7c21png
[1478] https://bmus.latticegroup.com/docs/bmus_4e_g7c.2.1.png
[1479] https://bmus.latticegroup.com/file/bmus4eg7c22png
[1480] https://bmus.latticegroup.com/docs/bmus_4e_g7c.2.2.png
[1481] https://bmus.latticegroup.com/docs/bmus_4e_t7c.3.pdf
[1482] https://bmus.latticegroup.com/docs/bmus_4e_t7c.3.csv
[1483] https://bmus.latticegroup.com/file/bmus4eg7c33png
[1484] https://bmus.latticegroup.com/docs/bmus_4e_g7c.3.3.png
[1485] https://bmus.latticegroup.com/file/bmus4eg7c31png
[1486] https://bmus.latticegroup.com/docs/bmus_4e_g7c.3.1.png
[1487] https://bmus.latticegroup.com/file/bmus4eg7c32png
[1488] https://bmus.latticegroup.com/docs/bmus_4e_g7c.3.2.png
[1489] https://www.aafp.org/afp/2014/1215/p843.html
[1490] https://bmus.latticegroup.com/docs/bmus_4e_t7c.4.pdf
[1491] https://bmus.latticegroup.com/docs/bmus_4e_t7c.4.csv
[1492] https://bmus.latticegroup.com/file/bmus4eg7c41png
[1493] https://bmus.latticegroup.com/docs/bmus_4e_g7c.4.1.png
[1494] https://bmus.latticegroup.com/file/bmus4eg7c430png
[1495] https://bmus.latticegroup.com/docs/bmus_4e_g7c.4.3.0.png
[1496] https://bmus.latticegroup.com/file/bmus4eg7c42png
[1497] https://bmus.latticegroup.com/docs/bmus_4e_g7c.4.2.png
[1498] https://bmus.latticegroup.com/file/bmus4eg7c51png
[1499] https://bmus.latticegroup.com/docs/bmus_4e_g7c.5.1.png
[1500] https://bmus.latticegroup.com/docs/bmus_4e_t7c.1.5.pdf
[1501] https://bmus.latticegroup.com/docs/bmus_4e_t7c.1.5.csv
[1502] https://bmus.latticegroup.com/file/bmus4eg7c53png
[1503] https://bmus.latticegroup.com/docs/bmus_4e_g7c.5.3.png
[1504] https://bmus.latticegroup.com/file/bmus4eg7c52png
[1505] https://bmus.latticegroup.com/docs/bmus_4e_g7c.5.2.png
[1506] https://bmus.latticegroup.com/file/bmus4eg7c61png
[1507] https://bmus.latticegroup.com/docs/bmus_4e_g7c.6.1.png
[1508] https://bmus.latticegroup.com/docs/bmus_4e_t7c.6.pdf
[1509] https://bmus.latticegroup.com/docs/bmus_4e_t7c.6.csv
[1510] https://bmus.latticegroup.com/file/bmus4eg7c62png
[1511] https://bmus.latticegroup.com/docs/bmus_4e_g7c.6.2.png
[1512] https://bmus.latticegroup.com/file/bmus4eg7c71png
[1513] https://bmus.latticegroup.com/docs/bmus_4e_g7c.7.1.png
[1514] https://bmus.latticegroup.com/docs/bmus_4e_t7c.7.1.pdf
[1515] https://bmus.latticegroup.com/docs/bmus_4e_t7c.7.1.csv
[1516] https://bmus.latticegroup.com/file/bmus4eg7c72png
[1517] https://bmus.latticegroup.com/docs/bmus_4e_g7c.7.2.png
[1518] https://bmus.latticegroup.com/docs/bmus_4e_t7c.7.2.pdf
[1519] https://bmus.latticegroup.com/docs/bmus_4e_t7c.7.2.csv
[1520] https://bmus.latticegroup.com/file/bmus4eg7c73png
[1521] https://bmus.latticegroup.com/docs/bmus_4e_g7c.7.3.png
[1522] https://bmus.latticegroup.com/file/bmus4eg7c74png
[1523] https://bmus.latticegroup.com/docs/bmus_4e_g7c.7.4.png
[1524] https://bmus.latticegroup.com/file/bmus4eg7c75png
[1525] https://bmus.latticegroup.com/docs/bmus_4e_g7c.7.5.png
[1526] http://www.ncys.org/publications/2008-sports-participation-study.php
[1527] http://www.physicalactivitycouncil.com/pdfs/current.pdf
[1528] https://assets.aspeninstitute.org/content/uploads/2018/10/StateofPlay2018_v4WEB_2-FINAL.pdf
[1529] https://www.boneandjointburden.org/fourth-edition/via0/tumors
[1530] https://bmus.latticegroup.com/file/bmus4eg7c81png
[1531] https://bmus.latticegroup.com/docs/bmus_4e_g7c.8.1.png
[1532] https://bmus.latticegroup.com/docs/bmus_4e_t7c.8.pdf
[1533] https://bmus.latticegroup.com/docs/bmus_4e_t7c.8.csv
[1534] https://bmus.latticegroup.com/file/bmus4eg7c83png
[1535] https://bmus.latticegroup.com/docs/bmus_4e_g7c.8.3.png
[1536] https://bmus.latticegroup.com/file/bmus4eg7c82png
[1537] https://bmus.latticegroup.com/docs/bmus_4e_g7c.8.2.png
[1538] https://bmus.latticegroup.com/docs/bmus_4e_t7c.9.pdf
[1539] https://bmus.latticegroup.com/docs/bmus_4e_t7c.9.csv
[1540] https://bmus.latticegroup.com/file/bmus4eg7c91png
[1541] https://bmus.latticegroup.com/docs/bmus_4e_g7c.9.1.png
[1542] https://bmus.latticegroup.com/file/bmus4eg7c92png
[1543] https://bmus.latticegroup.com/docs/bmus_4e_g7c.9.2.png
[1544] https://bmus.latticegroup.com/docs/bmus_4e_t7c.10.pdf
[1545] https://bmus.latticegroup.com/docs/bmus_4e_t7c.10.csv
[1546] https://bmus.latticegroup.com/file/bmus4eg7c101png
[1547] https://bmus.latticegroup.com/docs/bmus_4e_g7c.10.1.png
[1548] https://bmus.latticegroup.com/file/bmus4eg7c102png
[1549] https://bmus.latticegroup.com/docs/bmus_4e_g7c.10.2.png
[1550] http://www.cdc.gov/arthritis/basics/childhood.htm
[1551] https://bmus.latticegroup.com/file/bmus4eg7c111png
[1552] https://bmus.latticegroup.com/docs/bmus_4e_g7c.11.1.png
[1553] https://bmus.latticegroup.com/docs/bmus_4e_t7c.11.pdf
[1554] https://bmus.latticegroup.com/docs/bmus_4e_t7c.11.csv
[1555] https://bmus.latticegroup.com/file/bmus4eg7c112png
[1556] https://bmus.latticegroup.com/docs/bmus_4e_g7c.11.2.png
[1557] https://bmus.latticegroup.com/file/bmus4eg7c113png
[1558] https://bmus.latticegroup.com/docs/bmus_4e_g7c.11.3.png
[1559] https://stopchildhoodpain.org/
[1560] https://bmus.latticegroup.com/file/bmus4eg7c121png
[1561] https://bmus.latticegroup.com/docs/bmus_4e_g7c.12.1.png
[1562] https://bmus.latticegroup.com/docs/bmus_4e_t7c.12.pdf
[1563] https://bmus.latticegroup.com/docs/bmus_4e_t7c.12.csv
[1564] https://bmus.latticegroup.com/file/bmus4eg7c122png
[1565] https://bmus.latticegroup.com/docs/bmus_4e_g7c.12.2.png
[1566] https://www.boneandjointburden.org/fourth-edition/iiib70/joint-pain-and-joint-replacement
[1567] http://dx.doi.org/10.1007/s11999-016-4903-3
[1568] https://bmus.latticegroup.com/docs/bmus_4e_t7c.13.pdf
[1569] https://bmus.latticegroup.com/docs/bmus_4e_t7c.13.csv
[1570] https://bmus.latticegroup.com/file/bmus4eg7c141png
[1571] https://bmus.latticegroup.com/docs/bmus_4e_g7c.14.1.png
[1572] https://bmus.latticegroup.com/file/bmus4eg7c142png
[1573] https://bmus.latticegroup.com/docs/bmus_4e_g7c.14.2.png
[1574] https://bmus.latticegroup.com/file/bmus4eg7c143png
[1575] https://bmus.latticegroup.com/docs/bmus_4e_g7c.14.3.png
[1576] https://bmus.latticegroup.com/docs/bmus_e4_t7d.1.pdf
[1577] https://bmus.latticegroup.com/docs/bmus_e4_t7d.1.csv
[1578] https://bmus.latticegroup.com/file/bmuse4g7d01png
[1579] https://bmus.latticegroup.com/docs/bmus_e4_g7d.0.1.png
[1580] https://bmus.latticegroup.com/file/bmuse4g7d02png
[1581] https://bmus.latticegroup.com/docs/bmus_e4_g7d.0.2.png
[1582] https://bmus.latticegroup.com/file/bmuse4g7d03png
[1583] https://bmus.latticegroup.com/docs/bmus_e4_g7d.0.3.png
[1584] https://bmus.latticegroup.com/file/bmuse4g7d04png
[1585] https://bmus.latticegroup.com/docs/bmus_e4_g7d.0.4.png
[1586] https://bmus.latticegroup.com/docs/bmus_e4_t7d.2.pdf
[1587] https://bmus.latticegroup.com/docs/bmus_e4_t7d.2.csv
[1588] https://bmus.latticegroup.com/file/bmuse4g7d11png
[1589] https://bmus.latticegroup.com/docs/bmus_e4_g7d.1.1.png
[1590] https://bmus.latticegroup.com/file/bmuse4g7d12png
[1591] https://bmus.latticegroup.com/docs/bmus_e4_g7d.1.2.png
[1592] https://bmus.latticegroup.com/file/bmuse4g7d13png
[1593] https://bmus.latticegroup.com/docs/bmus_e4_g7d.1.3.png
[1594] https://bmus.latticegroup.com/file/bmuse4g7d14png
[1595] https://bmus.latticegroup.com/docs/bmus_e4_g7d.1.4.png
[1596] https://bmus.latticegroup.com/file/bmuse4g7d20png
[1597] https://bmus.latticegroup.com/docs/bmus_e4_g7d.2.0.png
[1598] https://bmus.latticegroup.com/docs/bmus_e4_t7d.4.1.pdf
[1599] https://bmus.latticegroup.com/docs/bmus_e4_t7d.4.1.csv
[1600] https://bmus.latticegroup.com/file/bmuse4g7d21png
[1601] https://bmus.latticegroup.com/docs/bmus_e4_g7d.2.1.png
[1602] https://bmus.latticegroup.com/file/bmuse4g7d221png
[1603] https://bmus.latticegroup.com/docs/bmus_e4_g7d.2.2.1.png
[1604] https://bmus.latticegroup.com/file/bmuse4g7d222png
[1605] https://bmus.latticegroup.com/docs/bmus_e4_g7d.2.2.2.png
[1606] https://bmus.latticegroup.com/docs/bmus_e4_t7d.4.2.pdf
[1607] https://bmus.latticegroup.com/docs/bmus_e4_t7d.4.2.csv
[1608] https://bmus.latticegroup.com/file/bmuse4g7d25png
[1609] https://bmus.latticegroup.com/docs/bmus_e4_g7d.2.5.png
[1610] https://bmus.latticegroup.com/file/bmuse4g7d23png
[1611] https://bmus.latticegroup.com/docs/bmus_e4_g7d.2.3.png
[1612] https://bmus.latticegroup.com/file/bmuse4g7d24png
[1613] https://bmus.latticegroup.com/docs/bmus_e4_g7d.2.4.png
[1614] https://bmus.latticegroup.com/docs/bmus_e4_t7d.4.3.pdf
[1615] https://bmus.latticegroup.com/docs/bmus_e4_t7d.4.3.csv
[1616] https://bmus.latticegroup.com/file/bmuse4g7d26png
[1617] https://bmus.latticegroup.com/docs/bmus_e4_g7d.2.6.png
[1618] https://www.cdc.gov/mmwr/preview/mmwrhtml/00041424.htm
[1619] http://www.cdc.gov/pcd/issues/2010/may/10_0035.htm
[1620] http://healthfinder. gov/news/newsstorv.aspx?Docid=658088
[1621] https://bmus.latticegroup.com/file/bmuse4g7d31png
[1622] https://bmus.latticegroup.com/docs/bmus_e4_g7d.3.1.png
[1623] https://bmus.latticegroup.com/docs/bmus_e4_t7d.5.pdf
[1624] https://bmus.latticegroup.com/docs/bmus_e4_t7d.5.csv
[1625] https://bmus.latticegroup.com/file/bmuse4g7d32png
[1626] https://bmus.latticegroup.com/docs/bmus_e4_g7d.3.2.png
[1627] https://bmus.latticegroup.com/docs/bmus_e4_t7d.6.pdf
[1628] https://bmus.latticegroup.com/docs/bmus_e4_t7d.6.csv
[1629] https://bmus.latticegroup.com/file/bmuse4g7d41png
[1630] https://bmus.latticegroup.com/docs/bmus_e4_g7d.4.1.png
[1631] https://bmus.latticegroup.com/file/bmuse4g7d42png
[1632] https://bmus.latticegroup.com/docs/bmus_e4_g7d.4.2.png
[1633] https://bmus.latticegroup.com/file/bmuse4g7d43png
[1634] https://bmus.latticegroup.com/docs/bmus_e4_g7d.4.3.png
[1635] https://bmus.latticegroup.com/docs/bmus_e4_t7d.7.pdf
[1636] https://bmus.latticegroup.com/docs/bmus_e4_t7d.7.csv
[1637] https://bmus.latticegroup.com/file/bmuse4g7d51png
[1638] https://bmus.latticegroup.com/docs/bmus_e4_g7d.5.1.png
[1639] https://bmus.latticegroup.com/file/bmuse4g7d52png
[1640] https://bmus.latticegroup.com/docs/bmus_e4_g7d.5.2.png
[1641] https://www.boneandjointburden.org/2014-report/xl0/economic-cost-icd-9-cm-codes
[1642] https://meps.ahrq.gov/mepsweb/
[1643] https://meps.ahrq.gov/about_meps/Price_Index.shtml
[1644] http://www.bea.gov/national/index.htm#gdp
[1645] https://www.bea.gov/national/
[1646] https://bmus.latticegroup.com/file/bmuse4g8b01png
[1647] https://bmus.latticegroup.com/docs/bmus_e4_G8.B.0.1.png
[1648] https://bmus.latticegroup.com/docs/bmus_e4_TA8.1.1.pdf
[1649] https://bmus.latticegroup.com/docs/bmus_e4_TA8.1.1.csv
[1650] https://bmus.latticegroup.com/file/bmuse4g8b11png
[1651] https://bmus.latticegroup.com/docs/bmus_e4_G8.B.1.1.png
[1652] https://bmus.latticegroup.com/file/bmuse4g8b21png
[1653] https://bmus.latticegroup.com/docs/bmus_e4_G8.B.2.1.png
[1654] https://bmus.latticegroup.com/docs/bmus_e4_T8.1.2.pdf
[1655] https://bmus.latticegroup.com/docs/bmus_e4_T8.1.2.csv
[1656] https://bmus.latticegroup.com/docs/bmus_e4_T8.1.3.pdf
[1657] https://bmus.latticegroup.com/docs/bmus_e4_T8.1.3.csv
[1658] https://bmus.latticegroup.com/docs/bmus_e4_T8.1.4.pdf
[1659] https://bmus.latticegroup.com/docs/bmus_e4_T8.1.4.csv
[1660] https://bmus.latticegroup.com/docs/bmus_e4_TA8.1.2.pdf
[1661] https://bmus.latticegroup.com/docs/bmus_e4_TA8.1.2.csv
[1662] https://bmus.latticegroup.com/docs/bmus_e4_TA8.1.3.pdf
[1663] https://bmus.latticegroup.com/docs/bmus_e4_TA8.1.3.csv
[1664] https://bmus.latticegroup.com/docs/bmus_e4_TA8.1.4.pdf
[1665] https://bmus.latticegroup.com/docs/bmus_e4_TA8.1.4.csv
[1666] https://bmus.latticegroup.com/docs/bmus_e4_TA8.1.5.pdf
[1667] https://bmus.latticegroup.com/docs/bmus_e4_TA8.1.5.csv
[1668] https://bmus.latticegroup.com/docs/bmus_e4_TA8.1.6.pdf
[1669] https://bmus.latticegroup.com/docs/bmus_e4_TA8.1.6.csv
[1670] https://bmus.latticegroup.com/docs/bmus_e4_T8.2.1.pdf
[1671] https://bmus.latticegroup.com/docs/bmus_e4_T8.2.1.csv
[1672] https://bmus.latticegroup.com/file/bmuse4g8c11png
[1673] https://bmus.latticegroup.com/docs/bmus_e4_G8.C.1.1.png
[1674] https://bmus.latticegroup.com/docs/bmus_e4_TA8.2.pdf
[1675] https://bmus.latticegroup.com/docs/bmus_e4_TA8.2.csv
[1676] https://bmus.latticegroup.com/file/bmuse4g8c21png
[1677] https://bmus.latticegroup.com/docs/bmus_e4_G8.C.2.1.png
[1678] https://bmus.latticegroup.com/docs/bmus_e4_T8.2.3.pdf
[1679] https://bmus.latticegroup.com/docs/bmus_e4_T8.2.3.csv
[1680] https://bmus.latticegroup.com/docs/bmus_e4_T8.2.6.pdf
[1681] https://bmus.latticegroup.com/docs/bmus_e4_T8.2.6.csv
[1682] https://bmus.latticegroup.com/docs/bmus_e4_T8.3.pdf
[1683] https://bmus.latticegroup.com/docs/bmus_e4_T8.3.csv
[1684] https://bmus.latticegroup.com/docs/bmus_e4_T8.4.1.pdf
[1685] https://bmus.latticegroup.com/docs/bmus_e4_T8.4.1.csv
[1686] https://bmus.latticegroup.com/file/bmuse4g8d11png
[1687] https://bmus.latticegroup.com/docs/bmus_e4_G8.D.1.1.png
[1688] https://bmus.latticegroup.com/docs/bmus_e4_T8.5.1.pdf
[1689] https://bmus.latticegroup.com/docs/bmus_e4_T8.5.1.csv
[1690] https://bmus.latticegroup.com/file/bmuse4g8d12png
[1691] https://bmus.latticegroup.com/docs/bmus_e4_G8.D.1.2.png
[1692] https://bmus.latticegroup.com/docs/bmus_e4_T8.4.6.pdf
[1693] https://bmus.latticegroup.com/docs/bmus_e4_T8.4.6.csv
[1694] https://bmus.latticegroup.com/docs/bmus_e4_T8.7.pdf
[1695] https://bmus.latticegroup.com/docs/bmus_e4_T8.7.csv
[1696] https://bmus.latticegroup.com/file/bmuse4g8d13png
[1697] https://bmus.latticegroup.com/docs/bmus_e4_G8.D.1.3.png
[1698] https://bmus.latticegroup.com/docs/bmus_e4_T8.5.2.pdf
[1699] https://bmus.latticegroup.com/docs/bmus_e4_T8.5.2.csv
[1700] https://bmus.latticegroup.com/docs/bmus_e4_T8.5.4.pdf
[1701] https://bmus.latticegroup.com/docs/bmus_e4_T8.5.4.csv
[1702] https://bmus.latticegroup.com/docs/bmus_e4_T8.5.5.pdf
[1703] https://bmus.latticegroup.com/docs/bmus_e4_T8.5.5.csv
[1704] https://bmus.latticegroup.com/docs/bmus_e4_T8.5.6.pdf
[1705] https://bmus.latticegroup.com/docs/bmus_e4_T8.5.6.csv
[1706] https://bmus.latticegroup.com/docs/bmus_e4_T8.8.pdf
[1707] https://bmus.latticegroup.com/docs/bmus_e4_T8.8.csv
[1708] https://bmus.latticegroup.com/file/bmuse4g8d15png
[1709] https://bmus.latticegroup.com/docs/bmus_e4_G8.D.1.5_0.png
[1710] https://bmus.latticegroup.com/file/bmuse4g8d14png
[1711] https://bmus.latticegroup.com/docs/bmus_e4_G8.D.1.4.png
[1712] https://bmus.latticegroup.com/file/bmuse4g8d21png
[1713] https://bmus.latticegroup.com/docs/bmus_e4_G8.D.2.1.png
[1714] https://bmus.latticegroup.com/docs/bmus_e4_T8.6.6.pdf
[1715] https://bmus.latticegroup.com/docs/bmus_e4_T8.6.6.csv
[1716] https://bmus.latticegroup.com/file/bmuse4g8d22png
[1717] https://bmus.latticegroup.com/docs/bmus_e4_G8.D.2.2.png
[1718] https://bmus.latticegroup.com/file/bmuse4g8d23png
[1719] https://bmus.latticegroup.com/docs/bmus_e4_G8.D.2.3.png
[1720] https://www.boneandjointburden.org/fourth-edition/viiid1/person-expenditures
[1721] https://bmus.latticegroup.com/file/bmuse4g8d24png
[1722] https://bmus.latticegroup.com/docs/bmus_e4_G8.D.2.4.png
[1723] https://bmus.latticegroup.com/file/bmuse4g8e01png
[1724] https://bmus.latticegroup.com/docs/bmus_e4_G8.E.0.1.png
[1725] http://www.bea.gov/national/xls/gdplev.xls
[1726] https://bmus.latticegroup.com/file/bmuse4g8f01png
[1727] https://bmus.latticegroup.com/docs/bmus_e4_G8.F.0.1.png
[1728] https://bmus.latticegroup.com/file/bmuse4g8f02png
[1729] https://bmus.latticegroup.com/docs/bmus_e4_G8.F.0.2.png
[1730] https://bmus.latticegroup.com/file/bmuse4g8g01png
[1731] https://bmus.latticegroup.com/docs/bmus_e4_G8.G.0.1.png
[1732] https://bmus.latticegroup.com/file/bmuse4g8g02png
[1733] https://bmus.latticegroup.com/docs/bmus_e4_G8.G.0.2.png
[1734] https://www.boneandjointburden.org/fourth-edition/iiib23/connective-tissue-disorders
[1735] https://www.boneandjointburden.org/fourth-edition/iiib30/gout
[1736] https://www.boneandjointburden.org/fourth-edition/iiib21/rheumatoid-arthritis
[1737] https://www.boneandjointburden.org/fourth-edition/iiib10/osteoarthritis
[1738] https://www.boneandjointburden.org/fourth-edition/iiaf0/economic-burden
[1739] https://bmus.latticegroup.com/file/bmuse4g8h01png
[1740] https://bmus.latticegroup.com/docs/bmus_e4_G8.H.0.1.png
[1741] https://bmus.latticegroup.com/file/bmuse4g8h02png
[1742] https://bmus.latticegroup.com/docs/bmus_e4_G8.H.0.2.png
[1743] https://bmus.latticegroup.com/docs/bmus_e4_T8.16.pdf
[1744] https://bmus.latticegroup.com/docs/bmus_e4_T8.16.csv
[1745] https://bmus.latticegroup.com/docs/bmus_e4_T8.17.pdf
[1746] https://bmus.latticegroup.com/docs/bmus_e4_T8.17.csv
[1747] https://bmus.latticegroup.com/docs/bmus_e4_T8.18.pdf
[1748] https://bmus.latticegroup.com/docs/bmus_e4_T8.18.csv
[1749] https://bmus.latticegroup.com/file/bmuse4g8i01png
[1750] https://bmus.latticegroup.com/docs/bmus_e4_G8.I.0.1.png
[1751] https://bmus.latticegroup.com/docs/bmus_e4_VIII%20econ%20tables%20summary_by%20file.pdf
[1752] https://bmus.latticegroup.com/docs/bmus_e4_VIII%20econ%20tables%20summary_by%20content.pdf
[1753] https://bmus.latticegroup.com/file/2016-econ-tables-filepng
[1754] https://bmus.latticegroup.com/docs/2016%20econ%20tables%20by%20file.png
[1755] https://bmus.latticegroup.com/file/2016-econ-tables-contentpng
[1756] https://bmus.latticegroup.com/docs/2016%20econ%20tables%20by%20content.png