

In the United States, the national prevalence of osteoporosis is based on data from the National Health and Nutrition Examination Survey [1] (NHANES). NHANES is conducted by the National Center for Health Statistics, Centers for Disease Control and Prevention (CDC), to assess the health and nutrition status of a representative sample of the noninstitutionalized US population. Interviews of participants in the study are conducted in their homes. They receive standardized physical measurements, including BMD measurements via DXA, in mobile examination centers that are moved around the nation. The most recent national estimates of the prevalence of osteoporosis are based on femoral neck and spine BMD data from NHANES 2005–2010.
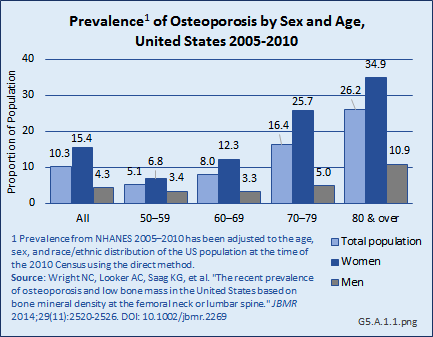
After adjusting for age, sex, and race/ethnicity, the prevalence of osteoporosis at either the femoral neck or lumbar spine is estimated to be 10.3% among adults age 50 years and older, representing more than 10 million people in the United States.1 (Reference Table 5.1 PDF [2] CSV [3])
Women have higher rates of osteoporosis at either of these two skeletal sites than men in the same age group across all ages: the prevalence of osteoporosis in adults age 50 years and older was 4.3% in men and 15.4% in women. Age is an even greater factor than sex in prevalence rates, particularly among women. Women ages 50 years to 59 years have a prevalence of 6.8%, while the prevalence increases to 34.9% for women age 80 years and older. Men show a similar, but less dramatic increase, with prevalence increasing from 3.4% among those ages 50 years to 59 years to 10.9% among men age 80 years and older. (Reference Table 5.1 PDF [2] CSV [3])
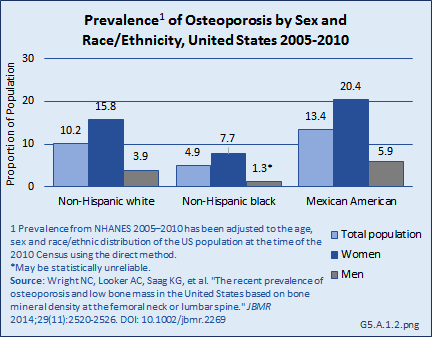
The prevalence of osteoporosis by race and ethnicity differs somewhat by BMD measurement site. Non-Hispanic Blacks have the lowest prevalence when based on BMD at either the hip or the spine, while Mexican Americans have the highest prevalence. However, when looking at the two skeletal sites separately, the group with the highest prevalence differs. Mexican Americans have the highest prevalence of osteoporosis if based on the lumbar spine BMD alone, but Non-Hispanic Whites have the highest prevalence if based on the femoral neck BMD alone.1 (Reference Table 5.1 PDF [2] CSV [3])
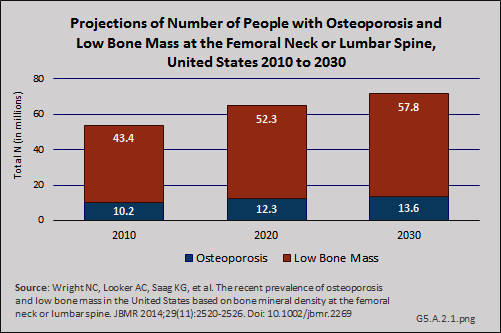
Using the current prevalence estimates of osteoporosis based on the NHANES BMD measurements at either the femoral neck or lumbar spine and future US Census projections, the number of people with osteoporosis will increase from an estimated 10.2 million in 2010 to 13.6 million people in 2030, with low bone mass, which may be a precursor to osteoporosis, increasing from 43.4 million people to 57.8 million over the same time frame.1
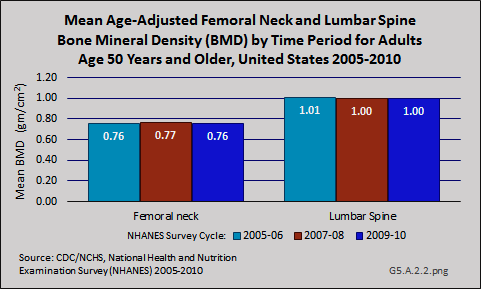
Although the prevalence of clinically diagnosed osteoporosis is projected to increase further, it is not clear whether the increase reflects an increase in diagnosis or an increase in the actual prevalence of the condition. Specifically, a comparison of femoral neck data from NHANES between 1988 and 1994 and 2005 and 2008 showed an increase in femoral neck BMD and a decline in prevalence of osteoporosis during this time. The observed differences in participant demographics and DXA methods between these NHANES surveys did not completely explain the observed increase in femoral neck BMD. Furthermore, data from NHANES 2005–2010 indicate that both mean femoral neck BMD and total lumbar spine BMD have remained stable during this five-year period among those age 50 years and older.
However, as noted in the introduction to osteoporosis, the diagnosis can also be made based on fragility fracture, which could also play a role in the discrepancy observed between secular trends in the prevalence of clinically diagnosed osteoporosis versus BMD-defined osteoporosis based on femoral neck data from NHANES.2
International Classification of Diseases (ICD) codes are often used in studies to define conditions in records of national health databases. However, health care providers may include codes that are not primary to the condition being treated, or may make errors in the coding process. Nevertheless, analysis of medical conditions based on ICD diagnosis or treatment codes is the most frequently used basis for health conditions research. Osteoporosis is identified with the ICD code of 733.
Data from the Agency for Healthcare Research and Quality Medical Expenditures Panel Survey [4] (MEPS) is used to estimate the economic burden [5] (cost) of musculoskeletal diseases throughout this site. The MEPS is the only US database to include actual cost paid by insurance companies and patients for the health care they receive.
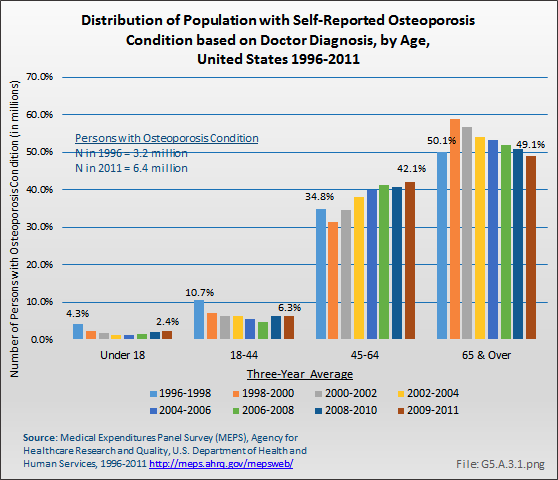
Using the MEPS data, the prevalence of people with diagnosed osteoporosis has risen as the population ages. The number of persons in the population with an osteoporosis condition rose from 3.2 million to 6.5 million between 1996 and 1998 and 2009 and 2011, nearly doubling the number of people with osteoporosis. This number is lower than the 10 million estimated prevalence for people age 50 years and older reported based on BMD [6].
People between the ages of 45 years and 64 years experienced the steepest rise in osteoporosis diagnosis, increasing from 32% to 35% of all people with osteoporosis in the late 1990s to more than 40% in recent years. (Reference Table 10.1 PDF [7] CSV [8])
A recent report using Medicare data showed an overall increase of 18 percentage points in the number of Medicare beneficiaries with diagnosed osteoporosis, based on ICD-9-CM codes, between 2008 and 2010.1
Links:
[1] http://www.cdc.gov/nchs/nhanes.htm
[2] https://bmus.latticegroup.com/docs/T5.1.pdf
[3] https://bmus.latticegroup.com/docs/T5.1.csv
[4] http://meps.ahrq.gov/mepsweb/
[5] http://www.boneandjointburden.org/2014-report/x0/economic-cost
[6] http://www.boneandjointburden.org/2014-report/va2/projected-prevalence
[7] https://bmus.latticegroup.com/docs/T10001.1.pdf
[8] https://bmus.latticegroup.com/docs/T10001.1.csv
[9] http://dx.doi.org/10.5888/pcd11.130118