

Demographic changes have created an urgent need. The growth in the number and proportion of older adults is unprecedented in the history of the United States. Two factors—longer life spans and aging boomers (those born between 1946 and 1964)—will combine to double the population of Americans age 65 years or older during the next 25 years to about 72 million. By 2030, older adults will account for roughly 20% of the US population.
Chronic conditions present a strong economic incentive for action. During the past century, a major shift occurred in the leading causes of death for all age groups, including older adults, from infectious diseases and acute illnesses to chronic diseases and degenerative illnesses. More than a quarter of all Americans, and two of every three older Americans, have multiple chronic conditions. Treatment for this chronic-conditions population accounts for 66% of the country’s healthcare budget.1
Mobility is fundamental to everyday life and central to an understanding of health and well-being among older populations. Impaired mobility is associated with a variety of adverse health outcomes. As the age of the US population continues to increase, aging and public health professionals have a growing role to play in improving mobility for older adults. There are critical gaps in the assessment and measurement of mobility among older adults who live in the community, particularly those who have physical disabilities or cognitive impairments. By changing the physical environment in which older people live and creating unique integrated interventions across various disciplines, we can improve mobility for older adults.
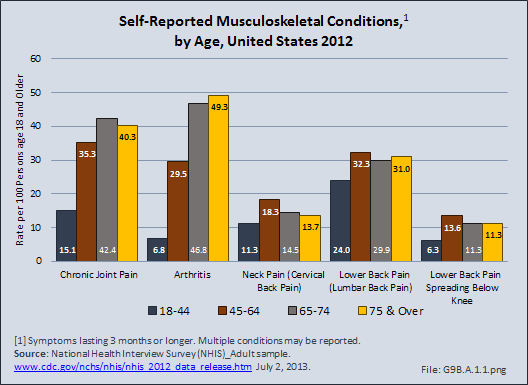
As expected, the aging population is prone to higher rates of nearly all musculoskeletal conditions than those found in younger people. In large part, these conditions can be attributed to wear and tear on bones and joints over a lifetime. However, some musculoskeletal conditions such as back pain are equally prominent in younger age populations, particularly those in their middle ages.
Arthritis is self-reported in 2012 at the highest among persons aged 75 years and older (49%), but by nearly as many in the 65- to 74-year age range (47%). Only 30% of ages 45 to 64 years self-report they have a form of arthritis. Chronic joint pain, however, is reported at the highest rate by the 65- to 74-year age group, with both those aged 75 years and older and 45 to 64 years reporting rates of chronic joint pain at close to this rate. Low back pain, on the other hand, was self-reported at the highest rate by persons aged 45 to 64 years, closely followed by all persons age 65 years and older. Overall, 126.6 million people age 18 years and older self-reported one or more types of musculoskeletal conditions in 2012. (Reference Table 9B.1 PDF [2] CSV [3])
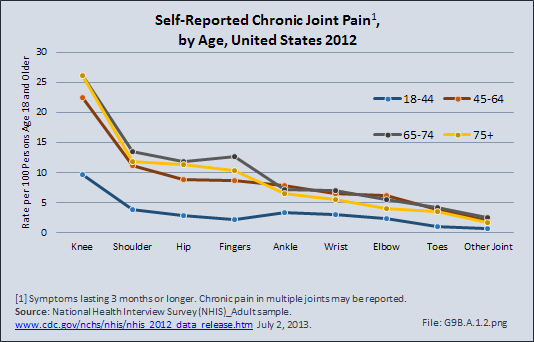
The most common chronic joint pain reported by the 63.1 million people of all ages is knee pain, followed by shoulder pain. However, the rate per 100 people reporting chronic pain in specific joints varies by age. Knee pain is reported by 22% to 26% of people age 45 years and older, with these age groups reporting shoulder pain at rates of 11% to 13.5%. Hip and finger joint pain are both reported at higher rates by people age 65 years and older, while ankle pain has the highest rate among people aged 45 to 64 years. Joint pain in the ankle, wrist, elbow, and toes is lower among those in the oldest age group, compared to those 45 to 74 years of age, possibly due to being less active and placing lower stress on these joints. (Reference Table 9B.1 PDF [2] CSV [3])
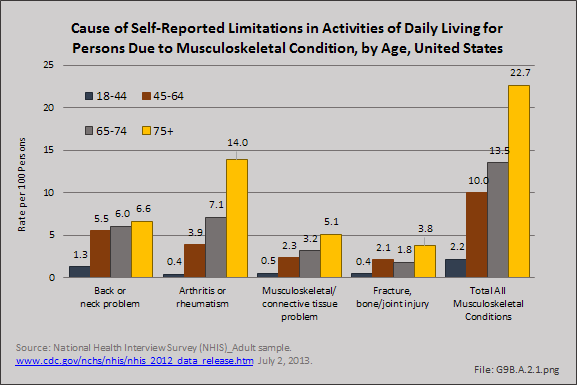
An estimated 6 in 100 persons report they have limitations performing activities of daily living such as dressing, bathing and walking due to musculoskeletal conditions. However, the rate with limitations rises steadily as the population ages, from just over 2 in 100 for those age 18 to 44 years, to 23 in 100 for people who have reached the age of 75 years. The highest rate of limitation is due to arthritis in the oldest group, but due to back or neck problems in the younger ages. (Reference Table 9B.1 PDF [2] CSV [3])
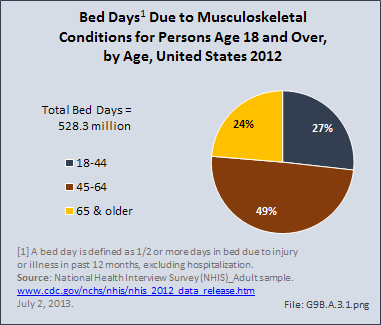
People age 45 to 64 years accounted for one-half (49%) of the 528.3 million bed days from a musculoskeletal condition that were reported in 2012 by people age 18 years and older. A bed day is defined as one-half or more days in bed due to injury or illness, excluding hospitalization. The greater number of total bed days reported by this age group is due to a high mean of 10.4 days combined with close to half the population reporting bed days because of a musculoskeletal condition. (Reference Table 9B.1 PDF [2] CSV [3])
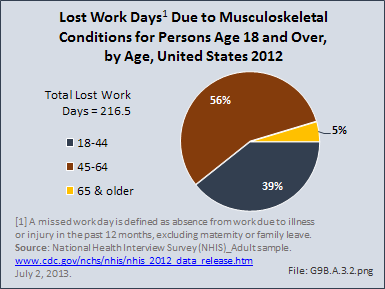
This same age group also accounted for slightly more than half (56%) of the 216.5 million lost work days due to musculoskeletal conditions reported by people age 18 years and older and in the workforce. People aged 65 years and older reported only 5% of total lost work days because of the low number that are still in the workforce. (Reference Table 9B.1 PDF [2] CSV [3])
Older adults will often experience musculoskeletal diseases affecting the spine, with spondyloarthritis and osteoporosis with vertebral fractures often the cause of pain and functional decline. Seniors with such problems may find themselves unable to push or pull large objects, or at times even reach above their heads. They may have problems lifting groceries from the floor, and bending at the waist may increase the risk for vertebral fractures in people with osteoporosis. Additionally, thoracic vertebral fractures (middle back) will result in decreasing functional vital capacity, predisposing older adults to chronic lung disease and pneumonias.
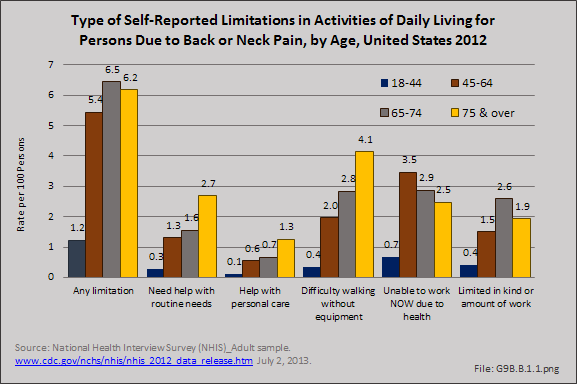
Self-reported back and neck pain rates peaked in the age range of 45 to 64 in 2012, and were reported at slightly lower rates for persons age 65 years and older. Roughly one in three people aged 45 years and older reported back or neck pain.
About 4 in 100 persons reported limitations with activities of daily living due to a chronic back or neck problem, with the highest rate (6.5 in 100) among people aged 65 to 74 years. The oldest population, those aged 75 years and older, have most difficulty walking without equipment (4.1 in 100) due to back pain. People aged 45 to 64 years reported the highest rate (3.5 in 100) of being unable to work because of chronic back and neck problems, while people aged 65 to 74 years reported the highest rate (2.6 in 100) with limitations in kind or amount of work. (Reference Table 9B.2.1 PDF [4] CSV [5])
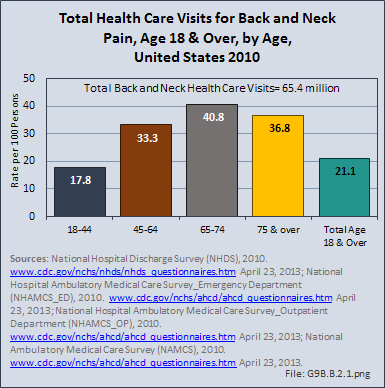
People aged 65 to 74 years had the highest rate of healthcare visits for back and neck pain (40.8 per 100 persons), but accounted for only 14% of the 65.4 million total healthcare visits made by adults for back or neck pain in 2010, due to their smaller share of the total population. The rate of healthcare visits was similar for people aged 75 years and older (36.8 per 100) and those aged 45 to 64 years (33.3 per 100). While only 17.8 in 100 people ages 18 to 44 years had a healthcare visit in 2010 for back and neck pain, this age group comprised 31% of all visits. Total healthcare visits included hospital discharges, emergency department (ED) and outpatient clinic visits, and physician office visits.
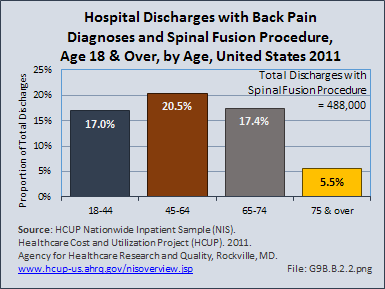
Those aged 45 to 64 years had the highest rate of spinal fusion procedures performed for back or neck pain. One in five, or 20.5%, of hospital discharges in this age group with a back or neck pain diagnosis had a spinal fusion procedure performed. People aged 75 years and older have a low rate of spinal fusion procedures (5.5%). (Reference Table 9B.2.2 PDF [6] CSV [7])
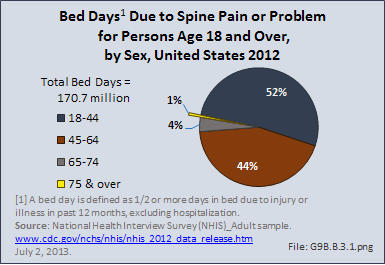
People aged 65 years and older account for only a small share (0.7%) of people who report taking a bed day due to spinal pain or problems, in spite of the number who report having pain. Younger people, aged 18 to 45 years, account for slightly more than half (52%) of the total 170.7 million bed days taken in 2012 due to back pain. (Reference Table 9B.2.1 PDF [4] CSV [5])
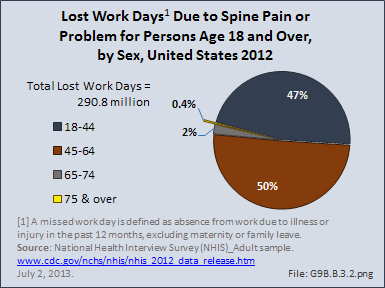
Lost work days due to spine pain or problems in 2012 were taken primarily by people aged 18 to 64 years, the prime workforce ages, and split nearly equally between those under and over the age of 45 years. In 2012, 290.8 million work days were reported lost due to back pain. (Reference Table 9B.2.1 PDF [4] CSV [5])
This report includes a range of deformity conditions that affect the spine. The most common spinal deformity in older adults is acquired through multiple vertebral fractures resulting in kyphosis. For each thoracic vertebral fracture, it is estimated there is an estimated decline of 7% in functional vital capacity1, which is compounded by additional fractures. Vertebral fractures are often clinically unrecognized, and may show merely as height loss. Nonetheless, vertebral fractures greatly increase the likelihood of future fractures and mortality.2,3
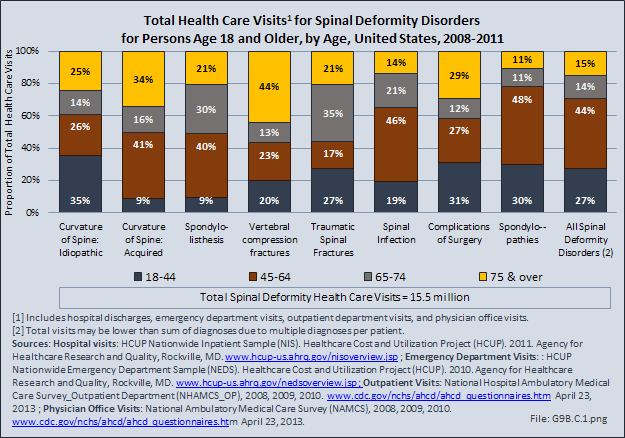
The most familiar spinal deformity condition is that of curvature of the spine, which includes scoliosis, kyphosis, and lordosis. In addition to curvature of the spine, other spinal deformity conditions include spondylolisthesis, spinal infections, complications of surgery, and spondylopathies. Of the 15.5 million health care visits for spinal deformity, 10.5 million had a diagnosis of spondylopathy, which refers to any disease of the vertebrae or spinal column associated with compression of peripheral nerve roots and spinal cord, causing pain and stiffness.
The oldest age group, people aged 75 years and older, account for the largest share of vertebral compression fractures (44%) and a major portion (34%) of acquired curvature of the spine, even though they represent only 8% of the population aged 18 years and older. They also account for a large share (29%) of spondylopathy diagnosis as well as 25% of idiopathic curvature of spine diagnosis; this is overall a larger share of all spinal deformity diagnoses than expected for the size of this age group.
People aged 65 to 74 years comprise 9% of the population over 18 years of age. This group also has a higher than expected share of healthcare visits for all spinal deformity diagnoses. The two conditions that stand out in this age group are traumatic spinal fractures (35% of total visits) and spondylolisthesis (30% of all visits).
On an annual average, 15.5 million healthcare visits were made between the years 2008 and 2011 by people aged 18 years and older. Those aged 45 to 64 years, 35% of the population aged 18 years and older, were treated in 44% of these visits. (Reference Table 9B.3 PDF [8] CSV [9])
Arthritis is one of the most common chronic conditions found in the US population. It currently affects 46 million US adults and is projected to increase 45% by 2030. It is the most common cause of disability in the United States, substantially affecting a person’s quality of life due to pain causing work and activity limitations, which subsequently affects the economy.
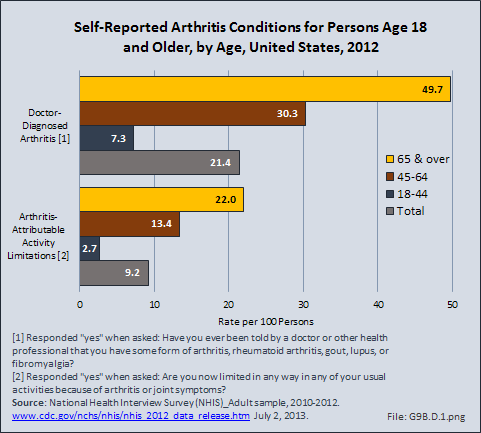
Arthritis and other rheumatic conditions (AORC) affect people in higher numbers as they age. Only 7 in 100 persons between the ages of 18 and 44 years report they have doctor-diagnosed arthritis. By the age of 65 years and older, this rate has increased to one in two with some form of arthritis. Although the rates of persons reporting limitations in performing activities of daily living are lower, there is a large disparity between younger persons and the aging. (Reference Table 9B.4.1 PDF [10] CSV [11])
Bed days occur when a person spends at least one-half day in bed in the previous 12 months due to a health condition. In 2012, 537.6 million bed days were reported by persons age 18 years and older due to arthritis. Only 4% of people aged 18 to 44 years reported arthritis-caused bed days. For all people aged 45 years and older, the rate was between 14% and 16%.
Arthritis is most likely to be the cause of lost work days among people between the ages of 45 and 64 years, with nearly 1 in 10 reporting work days lost. In 2012, 172.1 million work days were reported lost due to arthritis, with 65% lost by people in the 45- to 64-year age group. Likely, this higher share of lost work days for this group is due to the much higher participation in the workforce for this prime working age cohort. (Reference Table 9B.4.1 PDF [10] CSV [11])
In spite of the frequency and severe pain often experienced with arthritis and other rheumatic conditions, these illnesses account for only a small portion of hospital discharges. Visits to a physician’s office or alternative types of care account for the majority of health care related to AORC, with more than 100 million ambulatory visits in 2010. Among the 6.6 million hospital discharges for an AORC in 2011, age was a factor in increasing rates of hospitalization. Fewer than 1 in 100 persons ages 18 to 44 years had a hospital discharge with a diagnosis of an AORC, while 13 in 100 aged 75 years and older were discharged with an AORC diagnosis.
Osteoarthritis is the primary form of arthritis to affect older persons, and begins to show increasing rates for people in their 60s. By the age of 75 years, multiple forms of arthritis are often diagnosed and categorized as other rheumatic conditions. (Reference Table 9B.4.2 PDF [12] CSV [13])
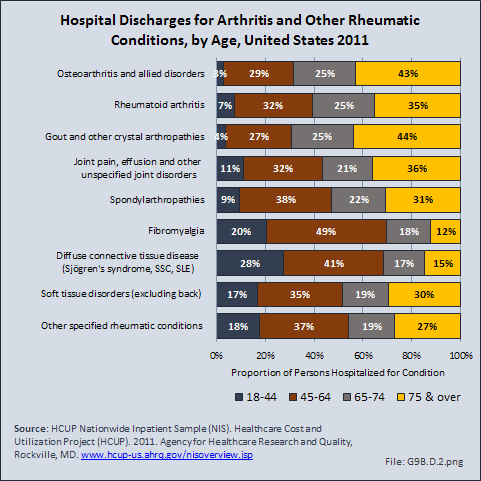
Age is not a factor in the length of hospital stay or mean charges with a diagnosis of an AORC. In general, the type of AORC is also not a factor in length of stay or charges, with the exception of a diagnosis of spondylarthropathy, which results in slightly higher mean hospital charges. Hospital charges are a rough estimate of hospital cost, and do not include doctor’s fees. (Reference Table 9B.4.2 PDF [12] CSV [13])
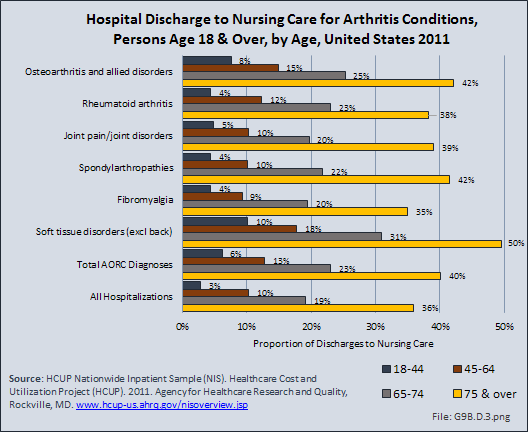
Discharge from a hospital to short- or long-term care is a major healthcare cost. The frequency of this increases significantly with age, and is more likely to occur with an AORC diagnosis than for all causes of hospitalization. One in eight people age 45 to 64 years discharged from a hospital with a diagnosis of an AORC is sent to intermediate-term or skilled nursing care. This increases to one in four for persons aged 65 to 74 years, and two in five for ages 75 years and older. The most likely AORC to result in nursing care is a soft tissue disorder, but all causes of AORC result in nursing home care for 35% or more of discharges among patients aged 75 years and older. (Reference Table 9B.4.3 PDF [14] CSV [15])
Osteoporosis means "porous bone." It is a condition that develops when more bone calcium is absorbed than is replaced in the normal bone remodeling process. Several factors contribute to the development of osteoporosis, but the exact reason why the remodeling process becomes unbalanced is unknown. Factors that often lead to osteoporosis include aging, physical inactivity, reduced levels of estrogen, excessive cortisone or thyroid hormone, smoking, and excessive alcohol intake. Loss of bone calcium accelerates in women after menopause.
Bone loss occurs most frequently in the spine, lower forearm above the wrist, and upper femur or thigh, the site where hip fractures usually occur.
Standard Definitions for Osteoporosis Diagnosis:
Low bone mass: A value for bone mineral density more than 1 standard deviation (SD) below the young female adult mean but less than 2.5 SD below this value.1
Osteoporosis: A value for bone mineral density 2.5 SD or more below the young female adult mean.2
Young female adult mean and standard deviation (SD): For the femoral neck, the mean and SD were based on data for 20- to 29-year-old non-Hispanic white females from the Third National Health and Nutrition Examination Survey (NHANES III).3 For the lumbar spine, the mean and SD were based on data for 30-year-old white women from the dual-energy x-ray absorptiometry (DEXA) densitometer manufacturer.4
Other races: People from racial and ethnic groups other than non-Hispanic white, non-Hispanic black, or Mexican American. This group consists primarily of Hispanic descent other than Mexican American, Asian, Native American, and multiracial persons, among others.
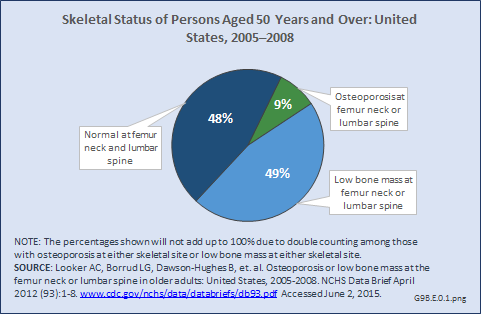
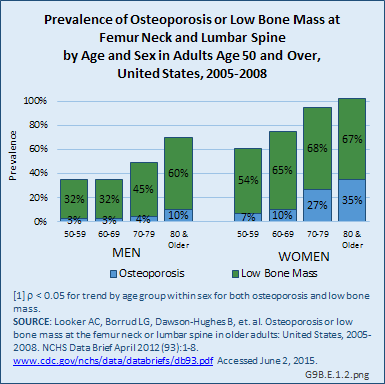
Nine percent of people aged 50 years and older had osteoporosis at either the femur neck or lumbar spine from 2005 to 2008 (Figure 1). Roughly one-half of older adults in the population had low bone mass at either the femoral neck or lumbar spine. Forty-eight percent of older adults in the United States had normal bone density at both the femur neck and lumbar spine.
From 2005 to 2008, the prevalence of osteoporosis in women aged 50 years and older at either the femur neck or lumbar spine was 9%, with 4% with osteoporosis at the lumbar spine only, 3% with osteoporosis at the femur neck only, and 2% with osteoporosis at both the lumbar spine and femur neck. The prevalence of low bone mass at either skeletal site was 49%, with 10% having low bone mass at the lumbar spine, 22% with low bone mass at the femur neck, and 17% with low bone mass at both the lumbar spine and femur neck.
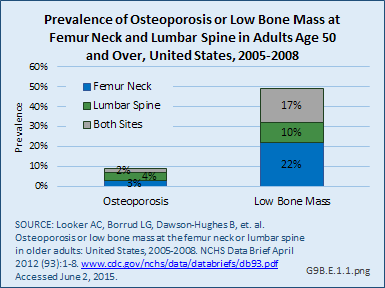
Age is a significant factor in the presence of osteoporosis and low bone mass in both men and women, but particularly in women. By the age of 70 years, virtually all women have low bone mass, with 27% or more having osteoporosis. In men, the prevalence of osteoporosis does not begin to increase until the age of 80 years, although low bone mass begins to climb for men in their 70s.
Osteoporosis often is not the principal diagnosis code related to a healthcare visit because the condition is usually an underlying cause of another condition, in particular, fragility fractures that often occur after a fall or other seemingly minor incident. Many times in such healthcare visits, osteoporosis may not even be listed as a condition. Still, in 2011, primary osteoporosis was listed in 1.8 million hospital discharges and emergency department visits as a reason for the visit in the population aged 50 and over. Fragility fractures occurred in 1.2 million visits for people aged 50 years and older. (Reference Table 9B.5 PDF [16] CSV [17])
Age is a factor in both primary osteoporosis diagnosis and in the occurrence of fragility fractures with most occurring in people after the age of 70. Nearly three-fourths (72%) of primary osteoporosis diagnoses were for people ages 70 years and older. However, in 2011, 9% of osteoporosis diagnoses was for people aged 50 to 59 years, and 19% of those aged 60 to 69 years. Among fragility fractures, 66% were for people aged 70 years and older, with the remainder split among those aged 50 to 69. The site of the fracture was particularly important with respect to age. The oldest group, those 70 years and older, were prone to fractures of the hip and vertebrae, as well as stress and pathological fractures. Fractures of the wrist and ankle or foot occurred across all people over the age of 50.
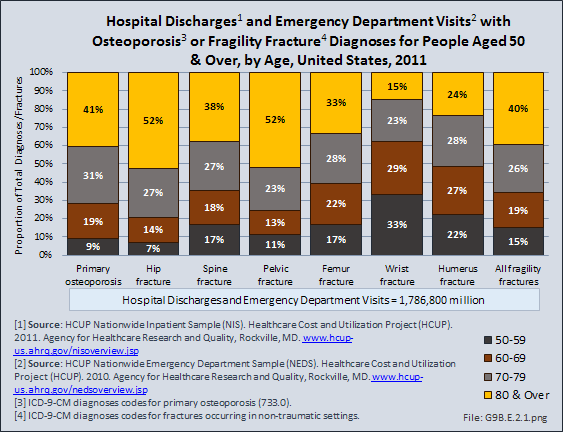
For 340,400 emergency department visits or hospital discharges for fragility fractures, or 16%, primary osteoporosis was also listed as a condition. The rate at which both diagnoses were made rose steadily as the population aged. Hospital discharge visits were more likely to include both primary osteoporosis and a fragility diagnosis than were visits to an emergency department.
Fractures are associated with significant increases in health services utilization compared to prefracture levels. Relative to the prior 6-month period, rates of acute hospitalization are between 19.5 (distal radius/ulna) and 72.4 (hip) percentage points higher in the 6 months after fractures. Average acute inpatient days are 1.9 (distal radius/ulna) to 8.7 (hip) higher in the postfracture period. Fractures are associated with large increases in all forms of postacute care, including postacute hospitalizations (13.1% to 71.5%), postacute inpatient days (6.1% to 31.4%), home health care hours (3.4% to 8.4%), and hours of physical (5.2% to 23.6%) and occupational (4.3% to 14.0%) therapy. Among patients who were initially community dwelling at the time of the initial fracture, 0.9% to 1.1% were living in a nursing home 6 months after the fracture. These rates rose by 2.4% to 4.0% one year after the fracture.1
INSTITUTIONALIZATION
Since 1980, there has been a nearly 15% decrease in the prevalence of chronic disability and institutionalization among people aged 65 years and older. A drop in disability translates directly into cost savings since it is seven times more expensive to care for a disabled senior versus a healthy one. Major activity limitations are a common cause of nursing home admissions. While the most common cause of limitations is arthritis, affecting nearly 50% of people older than 65 years and an estimated 60 million by 2020.2 Hip fractures are a second source of immobility, and are projected to reach 289,000 in the year 2030, nearly all fall-related.3
FRACTURES AND MORTALITY
Vertebral and hip osteoporotic fractures result in a 20% increase in mortality, usually observed in the 12 months after the fracture. Men, who are generally older at the time of the hip fracture, have a 30% mortality rate after the fracture. Moreover, comorbidities such as cardiovascular disease contribute to a higher mortality rate.
A population-based study in Olmsted County, MN, found that within the first seven days after hip fracture repair, 116 (10.4%) of participants experienced myocardial infarction and 41 (3.7%) subclinical myocardial ischemia. Overall, the 1-year mortality was 22%, with no difference between those with subclinical myocardial ischemia and those with no myocardial ischemia. One-year mortality for those with a myocardial infraction was significantly higher (35.8%) than for the other two groups.4 The relative mortality after vertebral fracture varies from 1.2 to 1.9 in different reports,5,6 but the excess deaths occur late, rather than early, after vertebral fractures.5
For older adults, falls and associated injuries threaten health, independence, and quality of life. More than a third of people aged 65 years and older who live independently fall each year; falls are the leading cause of injury-related deaths and hospital emergency department visits.
While numerous fall risk factors have been identified, limited information is available about the detailed circumstances surrounding falls among community-dwelling older adults. Several studies have used survey data to analyze falls, while other studies have limited their analysis to falls seen in emergency departments, in older women, or falls that resulted in fracture or hip fracture.
More than 6.8 million injury episodes for which people sought medical treatment were self-reported by individuals in 2012. The majority of injuries occurred to people between the ages of 18 and 64 years, the ages that comprised 83% of the over-18-year population in the United States. Sprains and strains was the most frequent injury type for which medical care was sought, but 16% suffered fractures, 14% severe contusions, and 13% open wounds.
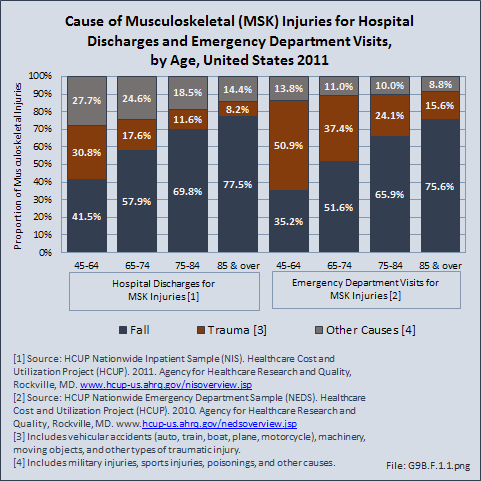
Falls are the primary cause of musculoskeletal injuries as the population ages. Approximately three out of four injuries among people aged 85 years and older for which a person is hospitalized or visits an emergency department is the result of a fall. Falls are also the primary cause of injury for anyone aged 65 years and older. Trauma such as auto accidents and other accidents involving machinery or moving objects is a major cause of musculoskeletal injuries among people ages 45 to 64 years, particularly for injuries where care is received in an emergency department. Other causes of injuries, including sports injuries, are seen in more than one in four (28%) injuries to people aged 45 to 64 years with a hospital discharge. (Reference Table 9B.6.1 PDF [20] CSV [21] and Table 9B.6.2 PDF [22] CSV [23])
In 2011, 1.6 million hospital discharges and 14.7 million emergency department visits were made by people aged 18 years and older for treatment of a musculoskeletal injury. Another 35.5 million musculoskeletal injuries were serious enough to receive outpatient treatment. The most frequent type of injury involving hospitalization was a fracture, with people aged 85 years and older accounting for 45% of hospitalizations for fractures. Injuries seen in emergency departments were distributed across all types of musculoskeletal injuries (fractures, dislocations, sprains and strains, contusions, open wounds, and other types of musculoskeletal injuries). The youngest and oldest age groups (18 to 44 years and 85 years and older) had the highest rate of injury seen in the ED (6.9/100 persons and 9.9/100, respectively). Because of the large size of the 18- to 44-year age group (48% of the US population is over age 18), this group constituted a majority of all injury cases seen, with the exception of fractures. (Reference Table 9B.6.2 PDF [22] CSV [23] and Table 6A.2.2.2 PDF [24] CSV [25])
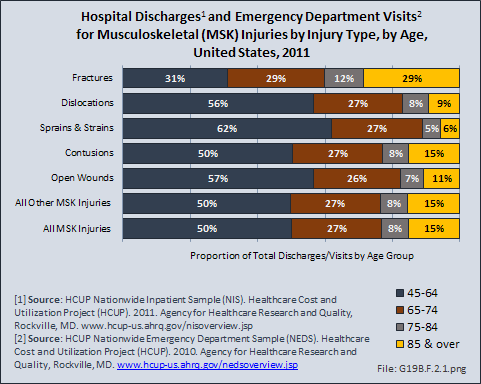
For all types of musculoskeletal injuries resulting in hospitalization, three of four people ages 85 years and older were discharged to intermediate-term nursing care, while two in three aged 75 to 84 years went to nursing care. Fractures were the most likely type of injury to result in discharge to intermediate-term nursing care for all ages, followed by dislocations. (Reference Table 9B.6.3 PDF [26] CSV [27])
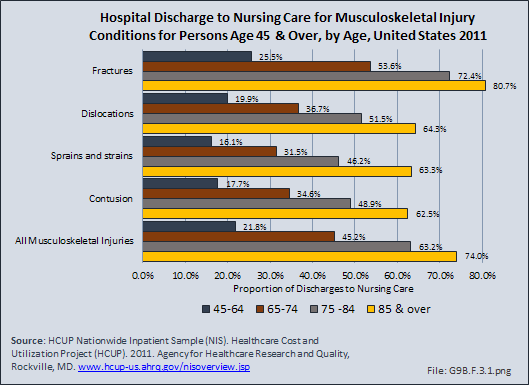
Discharge to intermediate-term or skilled nursing care greatly increases the economic burden of musculoskeletal injuries. In 2011, 40% of hospital discharge patients with a musculoskeletal injury, or 690,000, were sent to long-term or skilled nursing facilities.
Osteogenic sarcoma exhibits a bimodal distribution, with the significant second peak in incidence occuring in the seventh and eighth decades of life. Osteosarcoma in the elderly can also be attributed to Paget’s disease or previous radiotherapy. The expectation that these elderly patients may not tolerate aggressive modern chemotherapy means that those who develop OS over the age of 40 years are excluded from current treatment trials. As a result, remarkably little is known about the outcome for this age group.1
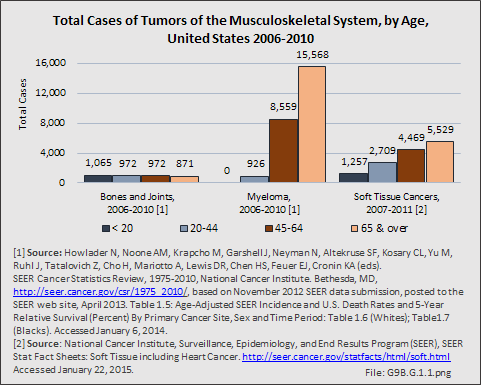
The overall incidence of tumors of the musculoskeletal system is lower than many types of cancers. This is particularly true for primary cancers of the bones and joints, although bones and joints are frequently a site of secondary, or metastasized, cancers. The occurrence of cancers of the bones and joints affects all ages and is one of the primary cancers in young people. Myeloma, cancer of the bone marrow, is a disease of the elderly, with nearly two-thirds of cases found in people ages 65 years and older. Soft tissue cancers affect all ages, but the occurrence increases with age. (Reference Table 9B.7 PDF [28] CSV [29])
Key challenges in the area of musculoskeletal health in older adults are considerable because we have a dramatic increase in older adults and prolonged life expectancy, greatly increasing the likelihood of development of arthritis, osteoporosis, and other musculoskeletal disorders.
A growing body of work on health-related knowledge translation reveals significant gaps between what is known to improve health and what is done to improve health. The costs of ignoring these gaps are increasingly apparent: suboptimal or unnecessary care, overuse or premature adoption of treatments, and new research that may not be based on the latest evidence or may not adequately address patient needs.
A gap in medical care occurs after an osteoporosis-related fracture in older adults. Furthermore, decreasing rate of treatment for osteoporosis after hip fracture is noted in the US by Solomon and colleagues.1 The latest quality measures by the National Commission on Quality Assessment indicate that treatment for osteoporosis after a fracture in an older woman is merely 23%; thus, thousands of individuals are at an elevated risk for recurrent fractures. New quality indicators by the Centers for Medicare and Medicaid Services (CMS), namely Physician Quality Reporting System [30] (PQRS), are expected to promote clinical changes. PQRS measure 40, which addresses osteoporosis management after distal radius, vertebral, and hip fractures in women over the age of 50 years, will be used to assess performance for physicians. The Joint Commission is considering similar measures for hospitals. Quality improvement programs have been successful in increasing treatment rates for osteoporosis after a fracture, but as of yet, they are not widely available in the United States.2,3,4
Prevention of falls is another area with a gap in medical care. Falls are common in older individuals, affecting as many as 30% of older women. Injuries from falls include fractures and blunt head trauma, and may result in increased mortality. Women with self-reported osteoarthritis (OA), in particular, have an increased risk of falls and, in spite of elevated bone mass, remain at risk of fractures.5 In 2012, the cost of fall injuries totaled more than $36 billion. As the population ages, the financial toll for older-adult falls is projected to reach $59.6 billion by 2020.6
Falls result in more than 2.4 million injuries treated in ERs annually, including more than 772,000 hospitalizations and more than 21,700 deaths. Every 15 seconds, an older adult is treated in the ER for a fall. Every 29 minutes, an older adult dies after a fall.7
Musculoskeletal disorders are prevalent, and often of serious consequences in older adults. A greater awareness in the medical community and dissemination of effective interventions will result in a higher quality of life and prevention of disability among America’s seniors.
Links:
[1] http://www.nia.nih.gov/newsroom/features/nih-seeking-strategies-multiple-chronic-conditions-older-people
[2] https://bmus.latticegroup.com/docs/T9B.1.pdf
[3] https://bmus.latticegroup.com/docs/T9B.1.csv
[4] https://bmus.latticegroup.com/docs/T9B.2.1.pdf
[5] https://bmus.latticegroup.com/docs/T9B.2.1.csv
[6] https://bmus.latticegroup.com/docs/T9B.2.2.pdf
[7] https://bmus.latticegroup.com/docs/T9B.2.2.csv
[8] https://bmus.latticegroup.com/docs/T9B.3.pdf
[9] https://bmus.latticegroup.com/docs/T9B.3.csv
[10] https://bmus.latticegroup.com/docs/T9B.4.1.pdf
[11] https://bmus.latticegroup.com/docs/T9B.4.1.csv
[12] https://bmus.latticegroup.com/docs/T9B.4.2.pdf
[13] https://bmus.latticegroup.com/docs/T9B.4.2.csv
[14] https://bmus.latticegroup.com/docs/T9B.4.3.pdf
[15] https://bmus.latticegroup.com/docs/T9B.4.3.csv
[16] https://bmus.latticegroup.com/docs/T9B.5.pdf
[17] https://bmus.latticegroup.com/docs/T9B.5.csv
[18] http://www.agingsociety.org/agingsociety/publications/chronic/index.html
[19] http://www.cdc.gov/HomeandRecreationalSafety/Falls/adulthipfx.html
[20] https://bmus.latticegroup.com/docs/T9B.6.1.pdf
[21] https://bmus.latticegroup.com/docs/T9B.6.1.csv
[22] https://bmus.latticegroup.com/docs/T9B.6.2.pdf
[23] https://bmus.latticegroup.com/docs/T9B.6.2.csv
[24] https://bmus.latticegroup.com/docs/T6A.2.2.2.pdf
[25] https://bmus.latticegroup.com/docs/T6A.2.2.2.csv
[26] https://bmus.latticegroup.com/docs/T9B.6.3.pdf
[27] https://bmus.latticegroup.com/docs/T9B.6.3.csv
[28] https://bmus.latticegroup.com/docs/T9B.7.pdf
[29] https://bmus.latticegroup.com/docs/T9B.7.csv
[30] http://www.cms.gov/Medicare/Quality-Initiatives-Patient-Assessment-Instruments/PQRS/index.html?redirect=/PQRS/
[31] http://www.uspreventiveservicestaskforce.org/Page/Document/RecommendationStatementFinal/falls-prevention-in-older-adults-counseling-and-preventive-medication
[32] http://www.cdc.gov/homeandrecreationalsafety/Falls/community_preventfalls.html